How Many SaaS Companies Are There? (2024)

As one of the three primary tiers of cloud computing, Software as a Service (SaaS) is very much on the rise.
Numerous companies have ridden the SaaS wave, going from strength to strength off the back of the growing industry.
With that in mind, here’s a breakdown of what we’ll cover:
- SaaS Company Stats 2024 (Top Picks)
- Number Of SaaS Companies In 2024
- New SaaS Startups Launched By Year
- Global SaaS Revenue
- SaaS Companies By Region
- SaaS Company Market Share
- SaaS Market Projections And Future Growth
SaaS Company Stats 2024 (Top Picks)
Here are five key insights into the SaaS market:
- There are currently approximately 30,000 SaaS companies.
- The US has the largest proportion of SaaS companies (around 60%).
- Including repeat users, the US has around 54 billion SaaS customers.
- Salesforce has the largest SaaS market share at just under 10%.
- The SaaS market is predicted to reach a valuation of $307 billion by 2026.
For further details and even more statistics, read on.
Number of SaaS Companies in 2024
The latest data suggests that approximately 17,000 SaaS companies exist worldwide.
The lion’s share (9,100) of these SaaS companies are based in the United States.
The United Kingdom (1,500), Canada (992), Germany (840), and India (711) make up the rest of the top five countries.
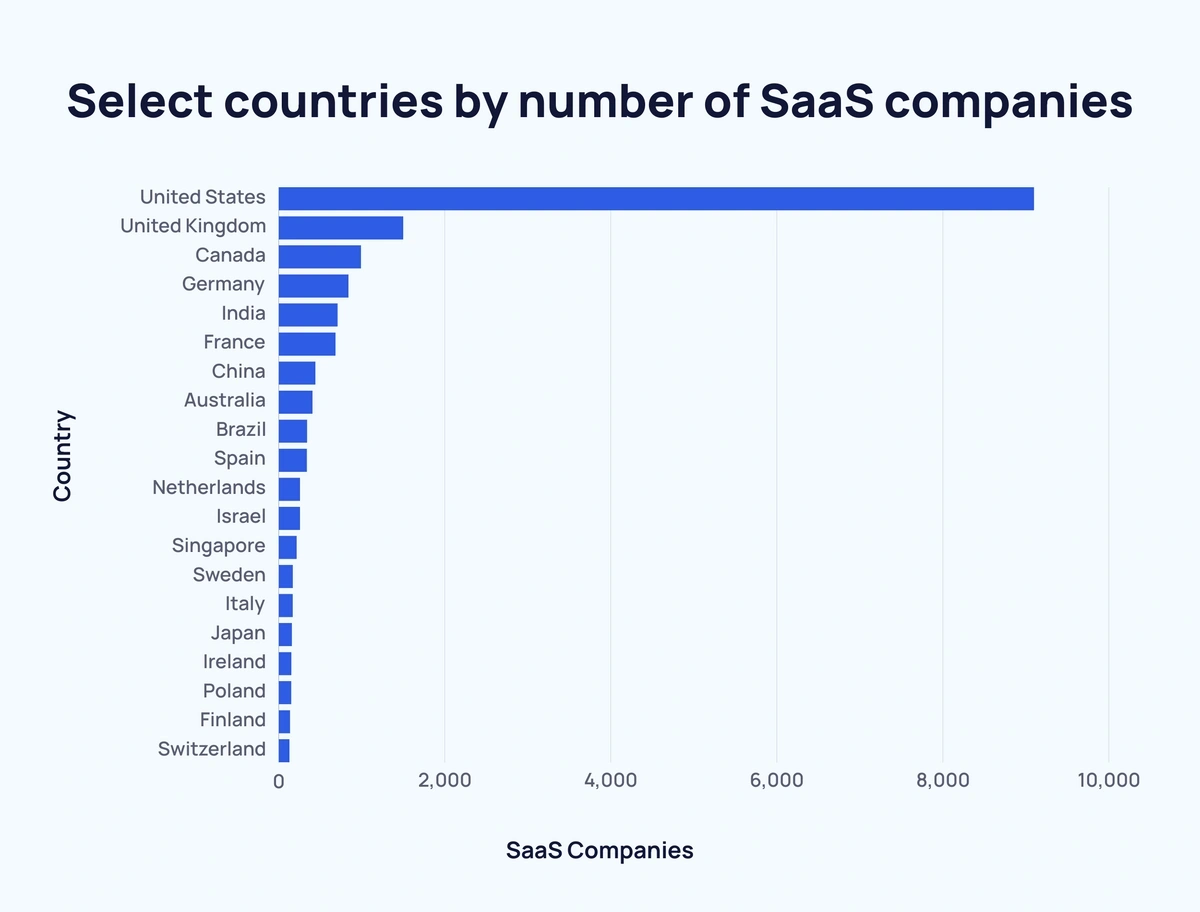
Here is a list of the top SaaS-producing countries:
| Country | No. of SaaS Companies |
| United States | 9,100 |
| United Kingdom | 1,500 |
| Canada | 992 |
| Germany | 840 |
| India | 711 |
| France | 684 |
| China | 443 |
| Australia | 408 |
| Netherlands | 402 |
| Brazil | 342 |
| Spain | 341 |
| Netherlands | 256 |
| Israel | 256 |
| Singapore | 217 |
| Sweden | 171 |
| Italy | 169 |
| Japan | 160 |
| Ireland | 152 |
| Poland | 151 |
| Finland | 138 |
| Switzerland | 129 |
Within those 15,000 or so SaaS companies, an estimated 337 are classified as unicorns. And around 15 of those are decacorns.
Including repeat customers, the US has a staggering 54 billion SaaS customers. That's more than all other nations combined.
China, the UK, and Canada are the next closest each with around 3 billion SaaS customers.
India (2 billion), Germany (2 billion), and France (1 billion) are the other countries with over 1 billion SaaS customers.
The number of SaaS startups launched increased year-over-year from the early 2000s to the mid-2010s. These numbers have dipped in recent years but look to be on the rise once more.
New SaaS Startups Launched By Year
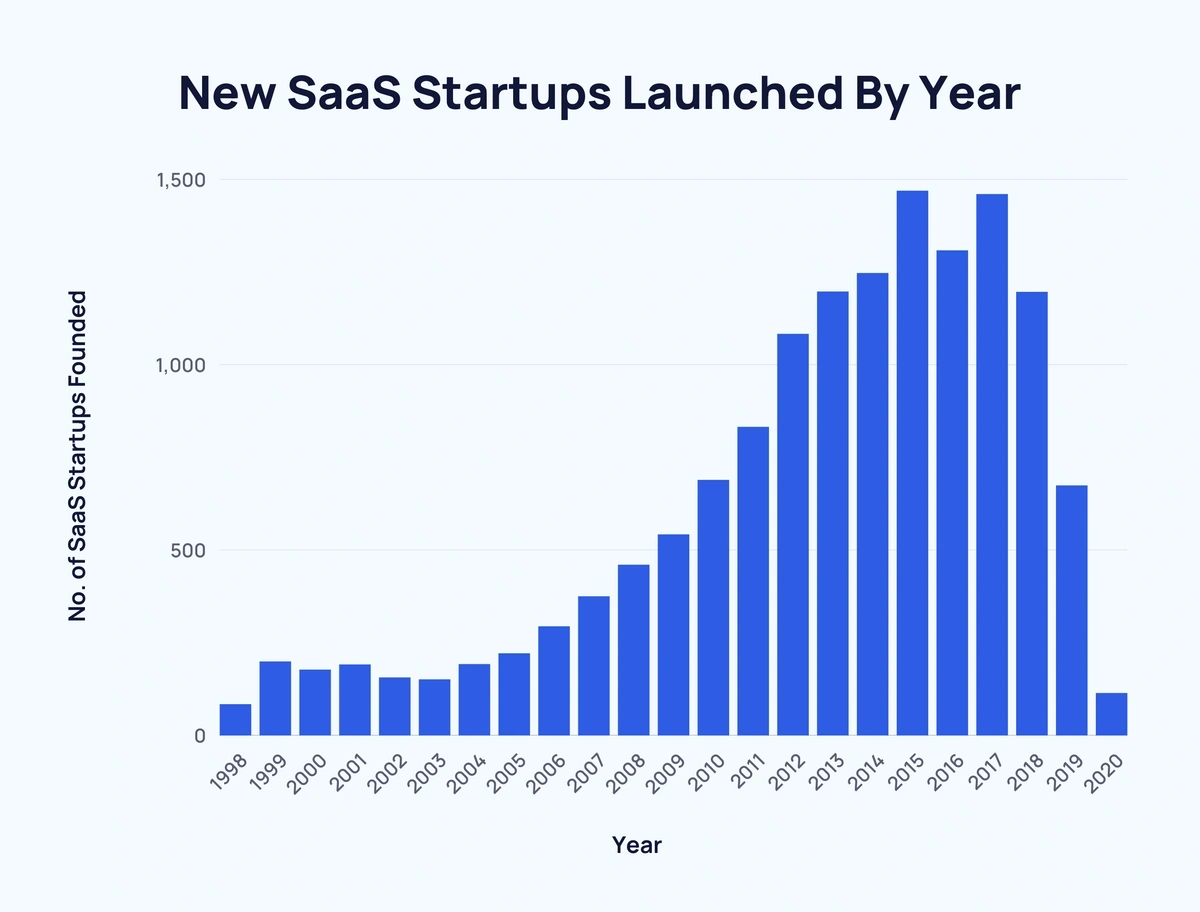
Here’s the latest data on SaaS startups founded each year since 1998:
| Year | No. of SaaS Startups Founded | Change Over Previous Year | Change Over Previous Year (%) |
| 1998 | 84 | - | - |
| 1999 | 199 | ↑ 115 | ↑ 136.9% |
| 2000 | 177 | ↓ 22 | ↓ 11.1% |
| 2001 | 191 | ↑ 14 | ↑ 7.9% |
| 2002 | 156 | ↓ 35 | ↓ 18.3% |
| 2003 | 151 | ↓ 5 | ↓ 3.2% |
| 2004 | 192 | ↑ 41 | ↑ 27.2% |
| 2005 | 221 | ↑ 29 | ↑ 15.1% |
| 2006 | 294 | ↑ 73 | ↑ 33% |
| 2007 | 375 | ↑ 81 | ↑ 27.6% |
| 2008 | 460 | ↑ 85 | ↑ 22.7% |
| 2009 | 542 | ↑ 82 | ↑ 17.8% |
| 2010 | 689 | ↑ 147 | ↑ 27.1% |
| 2011 | 832 | ↑ 143 | ↑ 20.8% |
| 2012 | 1083 | ↑ 251 | ↑ 30.2% |
| 2013 | 1197 | ↑ 114 | ↑ 10.5% |
| 2014 | 1247 | ↑ 50 | ↑ 4.2% |
| 2015 | 1469 | ↑ 222 | ↑ 17.8% |
| 2016 | 1308 | ↓ 161 | ↓ 11% |
| 2017 | 1460 | ↑ 152 | ↑ 11.6% |
| 2018 | 1196 | ↓ 264 | ↓ 18.1% |
| 2019 | 674 | ↓ 522 | ↓ 43.6% |
| 2020 | 114 | ↓ 560 | ↓ 83.1% |
In the last year (as of September 2022) 377 SaaS organizations have been founded.
The drop-off in SaaS startups being launched could be a result of incomplete recent data, further exacerbated by the effects of the pandemic. However, despite this decline, the industry is expected to continue its overall ascension.
Sources: The Latka Agency, SaaStr, Crunchbase, CardConnect
Global SaaS Revenue
Over the last decade, the cloud application market has grown year over year.
In 2013, the market was worth an estimated $30.4 billion. And by 2017 this figure had almost tripled to $86.3 billion.
As of 2022, the cloud application market is valued at approximately $146.6 billion. And is set to hit $168.6 billion by 2025.
Similarly, the SaaS market has followed suit, growing in value year-over-year.
Back in 2008, the SaaS market was worth just over $5 billion. However, by 2020, the market had grown by over 28x to $157 billion.
Unsurprisingly, as the SaaS market has grown, so too has end-user spending.
In less than 10 years, global spending has increased by over 5x to approximately $176.62 billion.
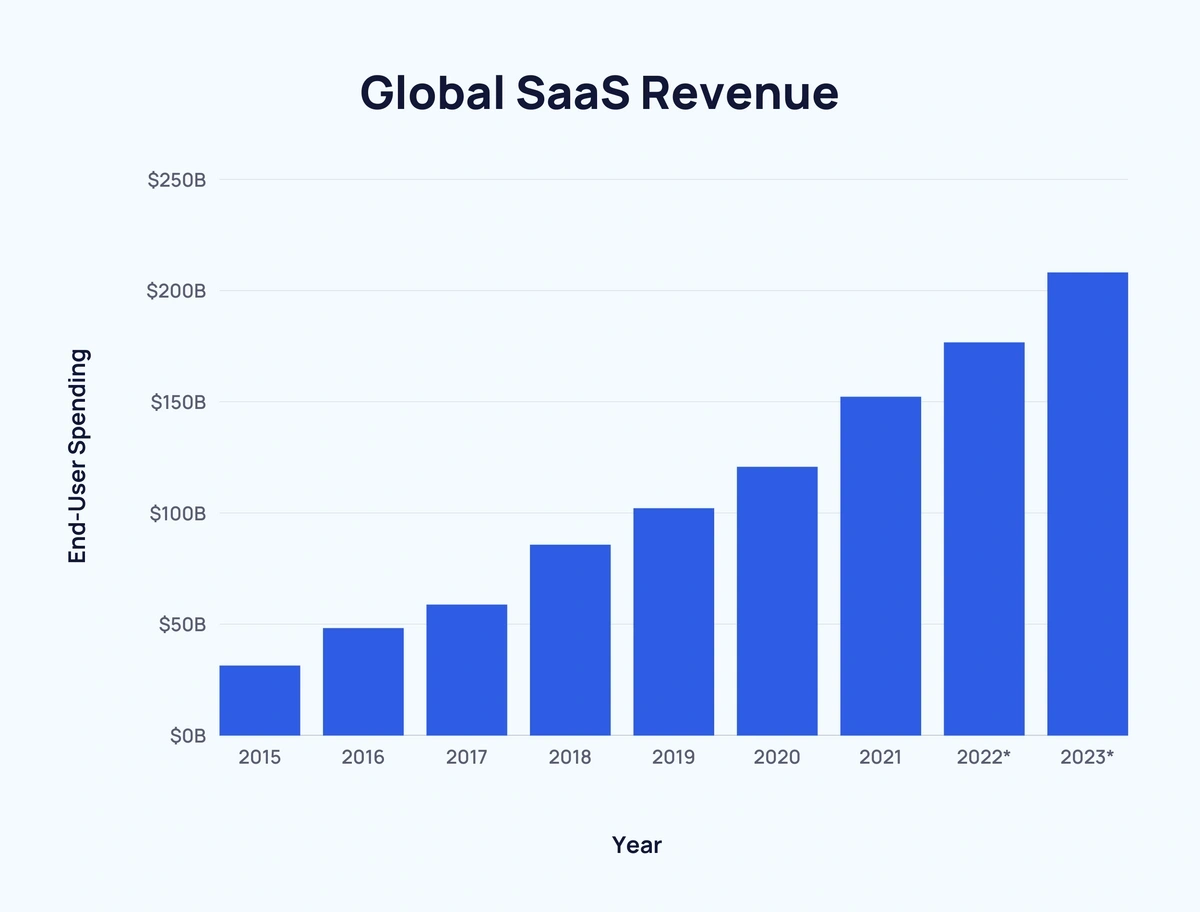
Here’s a full breakdown of worldwide SaaS end-user spending figures since 2015:
| Year | End-User Spending | Increase Over Previous Year | Increase Over Previous Year (%) |
| 2015 | $31.4 billion | - | - |
| 2016 | $48.2 billion | ↑ $16.8 billion | ↑ 53.5% |
| 2017 | $58.8 billion | ↑ $10.6 billion | ↑ 21.99% |
| 2018 | $85.7 billion | ↑ $26.9 billion | ↑ 45.75% |
| 2019 | $102.1 billion | ↑ $16.4 billion | ↑ 19.14% |
| 2020 | $120.7 billion | ↑ $18.6 billion | ↑ 18.22% |
| 2021 | $152.18 billion | ↑ $31.48 billion | ↑ 26.08% |
| 2022* | $176.62 billion | ↑ $24.34 billion | ↑ 16.06% |
| 2023* | $208.1 billion | ↑ $31.48 billion | ↑ 17.82% |
*Projected figures
Source: Apps Run The World, Forbes, Gartner
SaaS Companies by Region
In total, 11 of the top 20 SaaS-producing countries are located in Europe.
Africa is the only inhabited continent not to feature a nation within the top 20 SaaS producers.
Here’s a closer look at SaaS companies by region*:
| Rank | Region | SaaS Companies* | Approximate Market Share |
| #1 | North America | 10,000 | 58.6% |
| #2 | Europe | 4,531 | 26.5% |
| #3 | Asia | 1,787 | 10.5% |
| #4 | Oceania | 408 | 2.4% |
| #5 | South America | 342 | 2% |
*Only includes countries inside the top 20
In 2020, the SaaS market was worth an estimated €107.5 billion ($113.8 billion).
The US was responsible for €92 billion ($97.4 billion).
While the UK contributed €7.5 billion ($7.9 billion).
By comparison, all other software sectors were worth approximately €174.4 billion ($184.7 billion). As a result, the SaaS market equated to 38.12% of the overall software industry.
By 2025, the SaaS market is expected to reach a valuation of €229.5 billion ($242.9 billion) - an increase of 113.49%.
Despite losing some market share, the US SaaS sector is expected to more than double, reaching a value of €191 billion ($202.2 billion).
And the UK’s SaaS sector is forecast to almost double to €14.5 billion ($15.4 billion).
China’s SaaS market is predicted to experience the most growth, jumping from €4 billion ($4.2 billion) in 2020 to €13 billion ($13.8 billion) in 2025.
All other software sectors combined are forecast to drop in value to €169 billion ($178.9 billion). This means the SaaS market will equate to 50.8% of the overall software industry.
Source: The Latka Agency, Reply
SaaS Company Market Share
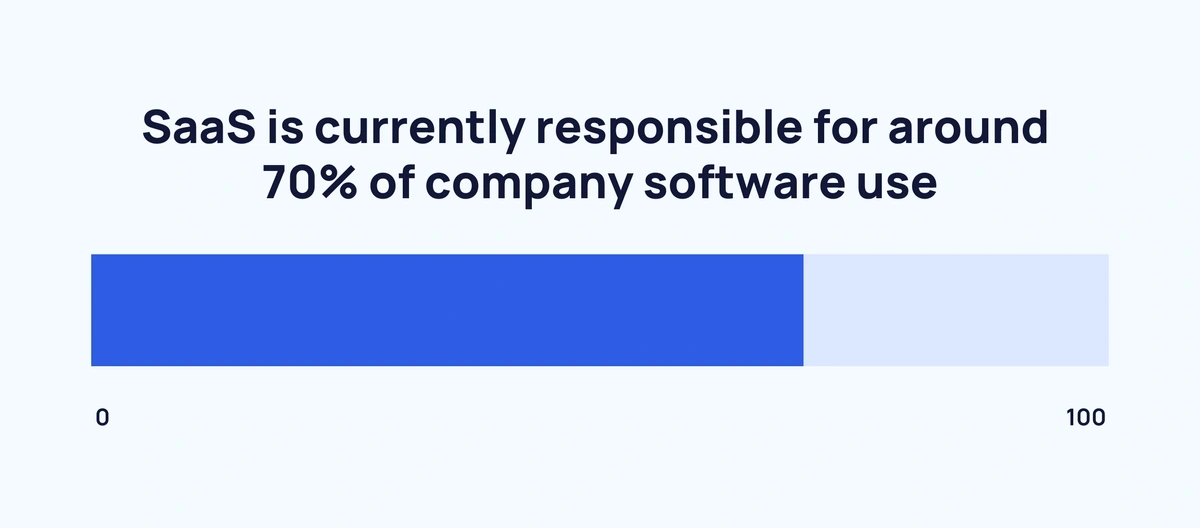
SaaS is currently responsible for around 70% of company software use. This figure is forecast to rise to 85% by 2025.
No single company dominates the SaaS market. As of 2020, the five largest SaaS companies held a combined market share of approximately 30.5%.
However, each one of those five companies increased its 2020 market share by between 0.3% and 1.5% over the previous year.
Here’s a closer look at each of those five companies:
Salesforce
With a 9.3% market share, Salesforce claims the largest piece of the SaaS pie.
Salesforce revenue has increased year-over-year for over a decade, gaining increasing momentum in recent years.
In 2017, the company generated $8.39 billion. But by 2021 Salesforce’s annual revenue had reached $21.25 billion - an increase of 153.28%.
Microsoft
Multinational tech giant Microsoft has an 8.7% SaaS market share.
Microsoft has increased its annual revenue each year since 2016. The biggest jump came in 2021, up 17.53% from $143.02 in 2020 to $168.09 in 2021.
SAP
German software corporation SAP holds 4.7% of the total SaaS market share.
Between 2009 and 2019 SAP revenue grew annually from $10.67 billion to $27.64 billion - an increase of 159.04%.
After a small dip in 2020, SAP's annual revenue rose back up to $27.84 billion in 2021, fueled largely by an increase in cloud-based revenue ($9.42 billion).
Oracle
Not far behind Sap with a market share of 4% is Oracle.
Unlike the first three companies mentioned, Oracle’s revenue figures have remained largely unchanged over the last decade. During that period, the company’s revenue has remained between $37.12 billion and $40.48 billion.
However, Oracle’s primary sources of revenue have changed.
Up until 2013, the company was largely reliant on cloud & on-premise software, hardware systems, and services. Oracle then made software license updates & product support, new software licenses, and services hardware a focus between 2014 and 2017.
Since then, the corporation has pivoted towards cloud services and license support as the main revenue stream. This is supplemented by a cloud license & on-premise license
Rounding off the top five, Google has a SaaS market share of 3.8%.
Google cloud revenue has skyrocketed since 2017 when annual revenue reached $4.06 billion. This more than doubled to $8.92 billion in 2019. And Google repeated the trick in 2021, with an annual cloud revenue figure of $19.21 billion.
Source: BetterCloud, Salesforce, Microsoft, SAP, Oracle, Google
SaaS Market Projections and Future Growth
Within IT security, cloud security spending was the segment projected to grow the most in 2021 (41.2%).
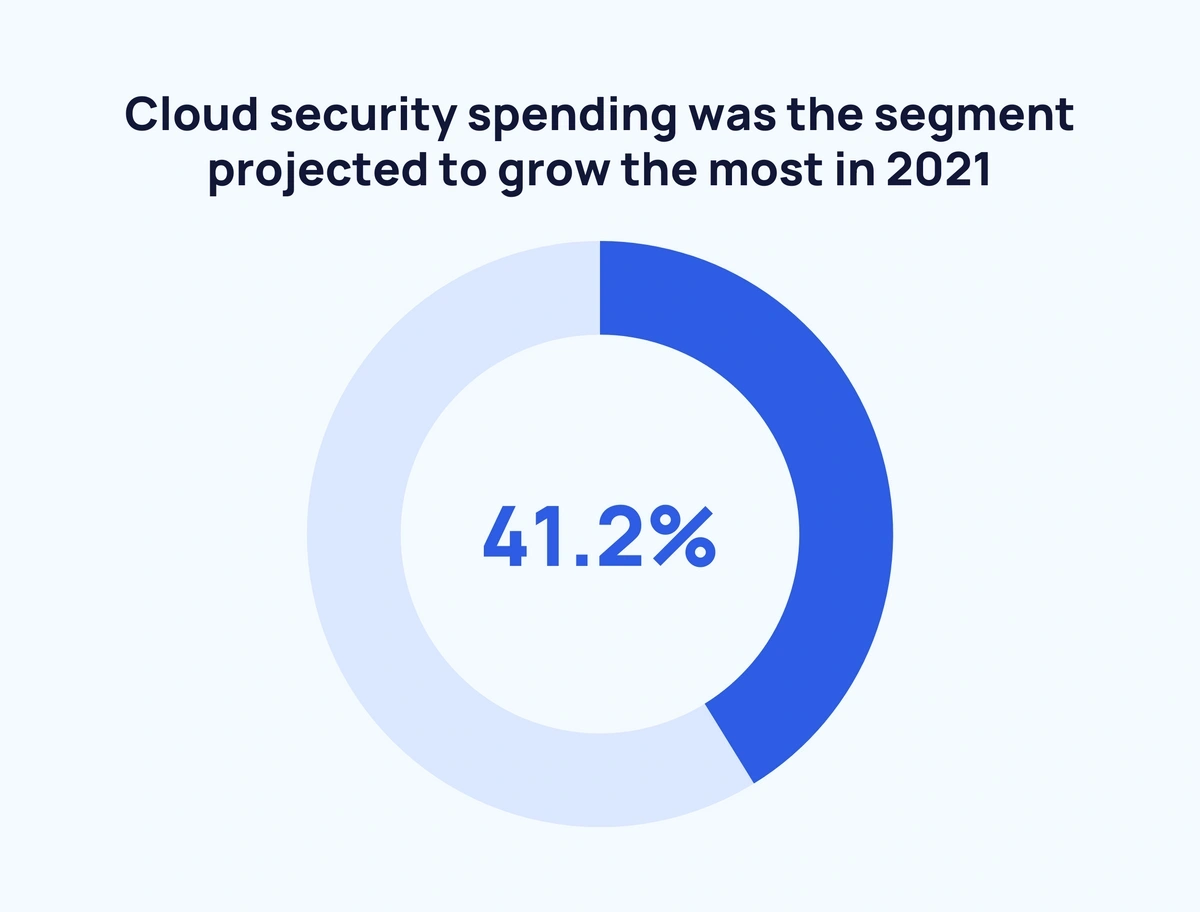
By comparison, data security came a distant second with 17.5%, followed by infrastructure protection with 16.8%.
It is clear that there is a concerted effort to invest in SaaS and the cloud.
A 2020 survey showed that respondents expect cloud vendors in both Europe and the US to increase spending across the board.
Microsoft Azure claimed the most significant percentage of respondents who believe business spending will increase for the cloud computing service (61%).
In total, 21 cloud vendors were included in the survey, yet only three were predicted to see a decrease in business spending.
Here’s a detailed look at the business spend prediction data for cloud vendors:
| Cloud Vendor | Significant Decrease | Slight Decrease | Slight Increase | Significant Increase | Majority? |
| Microsoft Azure | 3% | 5% | 42% | 19% | Increase |
| Microsoft SaaS software | 3% | 7% | 43% | 14% | Increase |
| Microsoft licensed software | 4% | 14% | 36% | 10% | Increase |
| AWS | 3% | 6% | 35% | 19% | Increase |
| Salesforce | 2% | 7% | 30% | 8% | Increase |
| 3% | 6% | 23% | 8% | Increase | |
| ServiceNow | 3% | 5% | 25% | 6% | Increase |
| VMware licensed software | 5% | 13% | 27% | 4% | Increase |
| VMware SaaS software | 3% | 9% | 21% | 5% | Increase |
| VMware cloud | 3% | 7% | 20% | 4% | Increase |
| Oracle Saas software | 4% | 11% | 17% | 5% | Increase |
| Oracle licensed software | 9% | 16% | 19% | 3% | Decrease |
| Oracle infrastructure cloud | 4% | 9% | 16% | 4% | Increase |
| SAP SaaS software | 3% | 7% | 18% | 6% | Increase |
| SAP licensed software | 3% | 7% | 18% | 4% | Increase |
| Adobe SaaS software | 3% | 7% | 17% | 4% | Increase |
| Adobe licensed software | 3% | 11% | 18% | 3% | Increase |
| IBM cloud | 5% | 9% | 12% | 4% | Increase |
| IBM SaaS software | 5% | 12% | 13% | 3% | Decrease |
| IBM licensed software | 6% | 17% | 9% | 4% | Decrease |
| Workday | 3% | 4% | 10% | 5% | Increase |
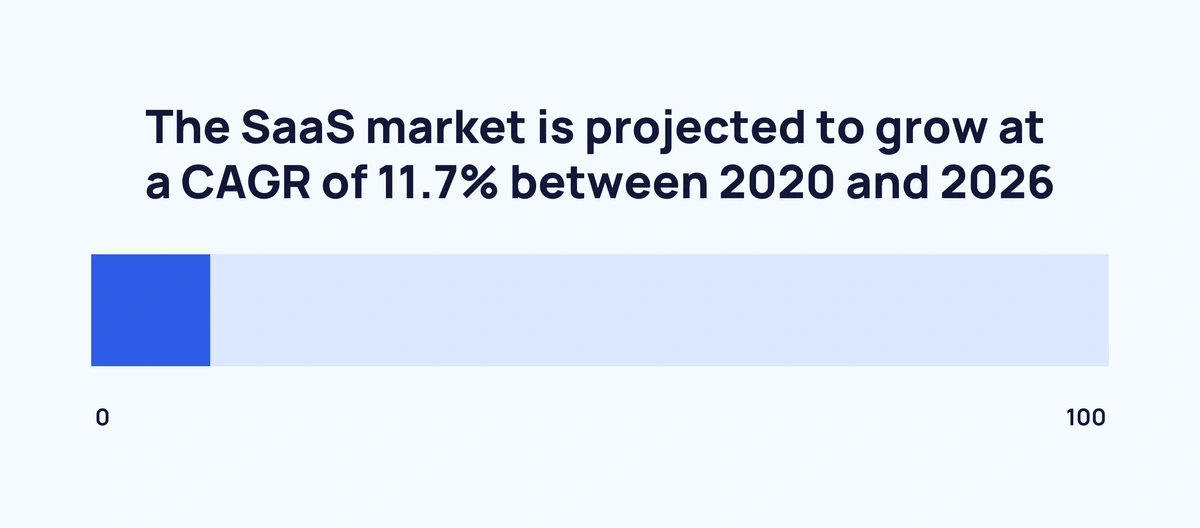
The SaaS market is projected to grow at a CAGR of 11.7% between 2020 and 2026, reaching a valuation of $307 billion.
Source: Gartner, Flexera Software, PRNewswire
Conclusion
The SaaS market is on the rise and the number of SaaS companies in existence is naturally following suit.
As industries and consumers continue to move towards cloud computing, SaaS business spending and revenue are only likely to grow further, encouraging even more companies to prioritize SaaS.
For more related content, take a look at these pages: 40 Skyrocketing SaaS Companies & Startups, 11 Important SaaS Trends, and 36 Growing B2B SaaS Startups.