Number of Freelancers (2024)

Freelancing has grown enormously in recent years.
From the pandemic to the creator economy to new technologies, more and more people are working for themselves than ever before.
We’ll dive deeper into just how many people freelance in 2024 below.
Contents
- Top Freelancer Stats
- How Many Freelancers Are There In the US?
- How Many Freelancers Are There Worldwide?
- Freelancing in Other Regions
- Who is Freelancing in 2023?
- Top Reasons for Freelancing
Top Freelancer Stats (Editor’s Choice)
Before we dive in, here are the top 5 freelance statistics for 2024:
- There are nearly 75 million freelancers in the US
- Around 9 in 20 workers are self-employed
- Niger is the country with the highest proportion of self-employment (95.1%)
- The arts & design industry has the highest self-employment rate (77%)
- Gen Z is the generation most likely to freelance
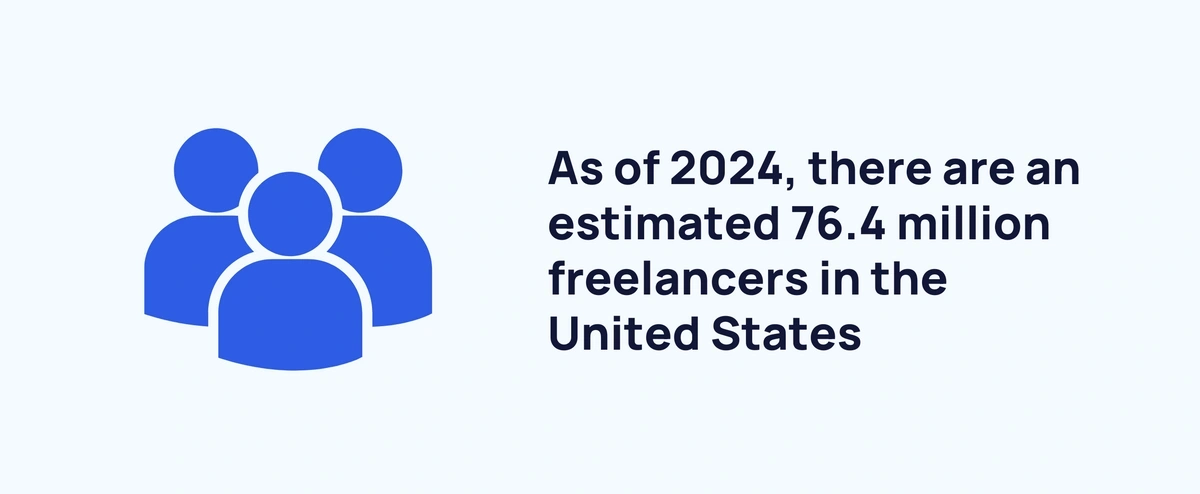
How Many Freelancers Are There In the US?
As of 2024, there are an estimated 76.4 million freelancers in the United States.
This figure has grown year-over-year by at least 2 million since 2017. And by 2028, the latest data suggests there will be over 90 million US freelancers.
This is how the US gig economy is expected to progress over the next few years:
|
Year |
Number of Freelancers |
Change over Previous Year |
|
2017 |
57.3 million |
- |
|
2018 |
59.7 million |
↑ 2.4 million |
|
2019 |
62.2 million |
↑ 2.5 million |
|
2020 |
64.8 million |
↑ 2.6 million |
|
2021 |
67.6 million |
↑ 2.8 million |
|
2022 |
70.4 million |
↑ 2.8 million |
|
2023 |
73.3 million |
↑ 2.9 million |
|
2024 |
76.4 million |
↑ 3.1 million |
|
2025 |
79.6 million |
↑ 3.2 million |
|
2026 |
83 million |
↑ 3.4 million |
|
2027 |
86.5 million |
↑ 3.5 million |
|
2028 |
90.1 million |
↑ 3.6 million |
Approximately 59 million (36% of the US workforce) are classified as independent workers.
Here’s the distribution of the US workforce according to a 2022 survey:
|
Type of Work |
Number of US Workers |
|
Permanent Workers |
100 million |
|
Gig and contract, freelance, and temporary workers |
26 million |
|
Contract, freelance, and temporary only |
29 million |
|
Gig only |
14 million |
|
Unemployed |
6 million |
Sources: Edelman, Bureau of Labor Statistics
How Many Freelancers Are There Worldwide?
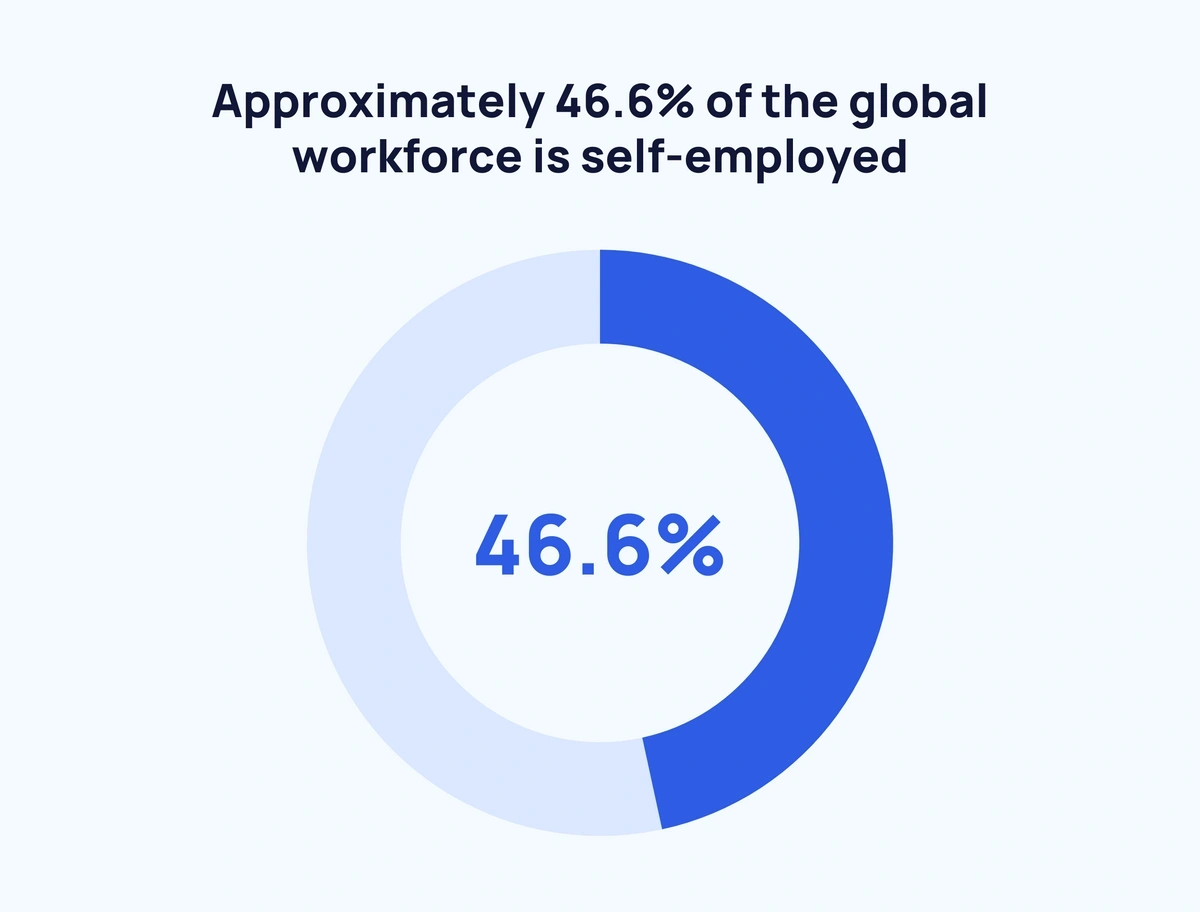
Approximately 1.57 billion people are self-employed around the globe.
That figure accounts for nearly half (46.6%) of the global workforce.
Source: World Bank
Freelancing in Other Regions
According to recent data, Niger has the highest recorded proportion of freelance workers (95.1%).
Here are the top 10 countries ranked by proportion of self-employment:
|
Rank |
Country |
Self-Employment Percentage |
|
1 |
Niger |
95.1% |
|
2 |
Central African Republic |
93.2% |
|
3 |
Chad |
92.6% |
|
4 |
Guinea |
91.9% |
|
5 |
Somalia |
91.7% |
|
6 |
South Sudan |
91.6% |
|
7 |
Sierra Leone |
90.3% |
|
8 |
Equatorial Guinea |
88.4% |
|
9 |
Benin |
88.1% |
|
10 |
Madagascar |
87.8% |
Each of the top 10 nations by the proportion of freelance workers is located in Africa. In fact, only two of the top 25 countries are not African:
- 11th - North Korea (87.2% self-employed)
- 18th - Afghanistan (82.2% self-employed)
Below are the highest-ranked nations by proportion of self-employment for selected regions:
|
Region |
Regional Average |
Highest-Ranked Country (Rank) |
Self-Employment |
|
Sub-Saharan Africa |
75.2% |
Niger (1) |
95.1% |
|
South Asia |
71.6% |
Nepal (26) |
77.3% |
|
East Asia and Pacific |
43.5% |
North Korea (11) |
87.2% |
|
Latin America and Caribbean |
38.2% |
Haiti (33) |
73.5% |
|
Middle-East and North Africa |
29.7% |
Afghanistan (18) |
82.2% |
|
European Union |
15.2% |
Greece (100) |
31.9% |
|
North America |
7.1% |
Canada (142) |
15.2% |
On the other end of the spectrum, the lowest-ranked nations by self-employment proportion are as follows:
|
Rank |
Country |
Region |
Self-Employment |
|
178 |
Belarus |
Eastern Europe |
4.3% |
|
179 |
Oman |
Middle-East |
3.7% |
|
180 |
Bahrain |
Middle-East |
2.7% |
|
181 |
Kuwait |
Middle-East |
1.8% |
|
182 |
Qatar |
Middle-East |
0.4% |
Focusing on income, low-income countries have an average self-employment rate of 80%. By contrast, high-income countries have an average self-employment rate of just 12.4%.
Here’s a breakdown of how national income affects the self-employment rate:
|
National Income |
Self-Employment |
|
Low |
80% |
|
Lower-Middle |
39.6% |
|
Middle |
51.4% |
|
Higher-Middle |
63.4% |
|
High |
12.4% |
Source: World Bank
Who is Freelancing in 2023?
Industry
The arts & design industry has the highest proportion of freelance workers in the US - around 3 in 4 are self-employed.
In contrast, just 19% of office workers and administrative support employees are freelancers.
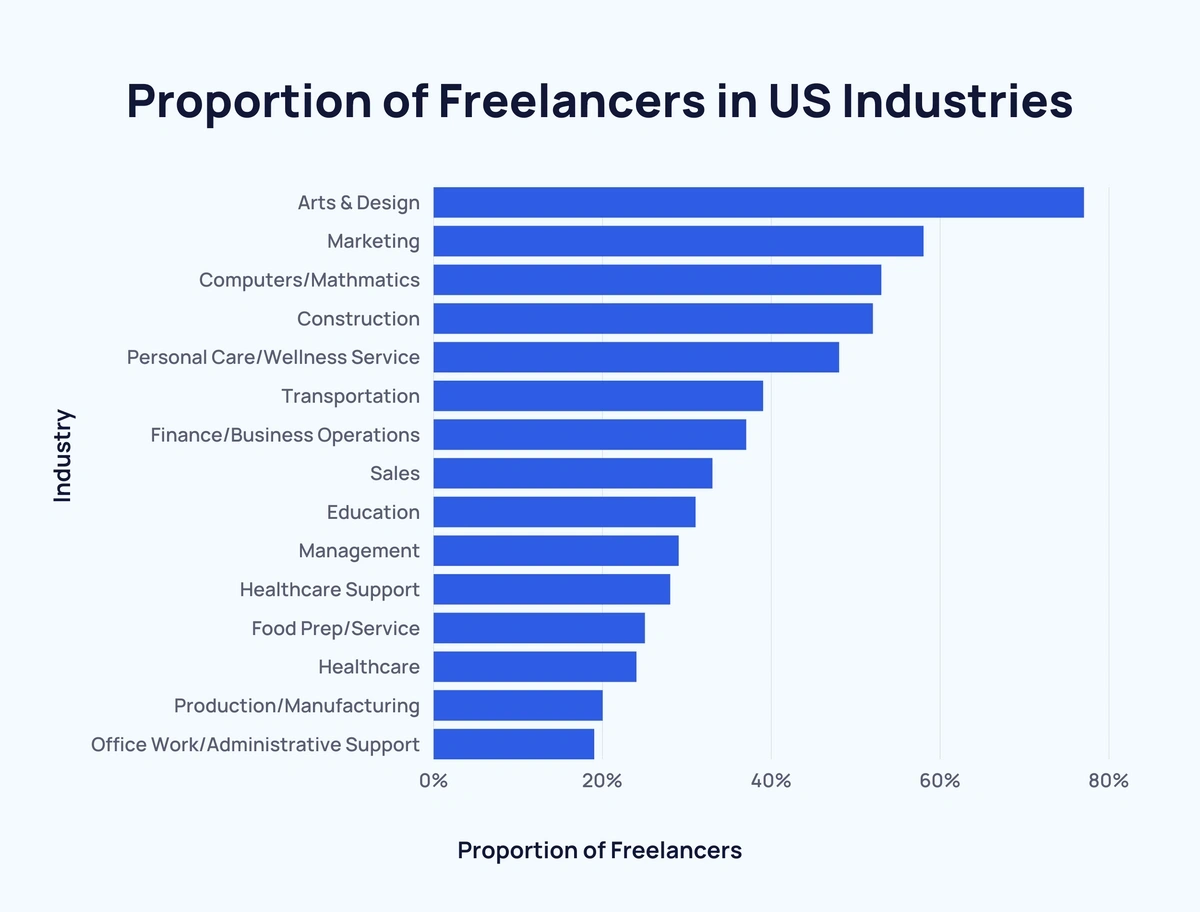
This is how American industries compare in terms of freelance employment:
|
Industry |
Proportion of Freelancers |
|
Arts & design |
77% |
|
Marketing |
58% |
|
Computers/Mathematics |
53% |
|
Construction |
52% |
|
Personal care/Wellness service |
48% |
|
Transportation |
39% |
|
Finance/Business operations |
37% |
|
Sales |
33% |
|
Education |
31% |
|
Management |
29% |
|
Healthcare support |
28% |
|
Food prep/Service |
25% |
|
Healthcare |
24% |
|
Production/Manufacturing |
20% |
|
Office work/Administrative support |
19% |
Age
According to 2020 data, there is a direct correlation between age and freelancing.
Half of all US Gen Zers (18 to 22-year-olds) participate in freelance work. That figure steadily drops off with each older generation and sits at 26% for baby boomers (55+ years old).
Here’s the full picture:
|
Generation |
Proportion of People Who Have Freelanced in Last Year |
|
Gen Z (18-22 yo) |
50% |
|
Millennial (23-38 yo) |
44% |
|
Gen X (39-54 yo) |
30% |
|
Baby Boomers (55+ yo) |
26% |
Another recent survey corroborated these findings.
When asked about earning money via freelancing, the youngest age group (18-29 year-olds) topped each of the following:
- Share of respondents currently freelancing (9%)
- Share of respondents who freelanced in the past 12 months, but not currently (13%)
- Share of respondents who freelanced 12+ months ago (9%)
Here’s the full breakdown:
|
Age |
Currently Freelancing |
Freelanced in Last Year |
Freelanced Over a Year Ago |
Combined |
|
18 to 29 yo |
9% |
13% |
9% |
31% |
|
30 to 49 yo |
4% |
6% |
8% |
18% |
|
50 to 64 yo |
3% |
4% |
6% |
13% |
|
65+ yo |
1% |
1% |
4% |
6% |
Race
Statistically, Hispanic people are more than 4x more likely to be currently freelancing. If you’re Hispanic, you are also approximately twice as likely to freelance than if you’re Black or Asian.
Here’s a look at the proportion of freelancers by race in the US:
|
Race |
Currently Freelancing |
Freelanced in Last Year |
Freelanced Over a Year Ago |
Combined |
|
Hispanic |
9% |
11% |
10% |
30% |
|
Black |
5% |
6% |
9% |
20% |
|
Asian |
4% |
8% |
6% |
18% |
|
White |
2% |
4% |
6% |
12% |
Gender
Differences in the likelihood of freelancing are far less pronounced between genders compared to age or race:
|
Gender |
Currently Freelancing |
Freelanced in Last Year |
Freelanced Over a Year Ago |
Combined |
|
Women |
4% |
6% |
7% |
17% |
|
Men |
4% |
5% |
6% |
15% |
Education
Over half of post-graduates in the US (51%) do freelance work - an increase of 6% over 2019’s figures. That’s at least 16% higher than any other education level.
By comparison, just 31% of Americans without an education level higher than high school work as freelancers.
Here’s how education affects the likelihood of freelancing:
|
Highest Education Level |
Proportion of Freelancers |
|
High school graduate or less |
51% |
|
Some college or associate degree |
35% |
|
Bachelor’s degree |
35% |
|
Post-graduate degree |
31% |
Sources: Upwork, Pew Research Center
Top Reasons for Freelancing
More than half of US freelancers (56%) agree the leading reason for taking work on a gig platform is to save up extra money.
This is followed by needing to cover gaps or a change in income (52%).
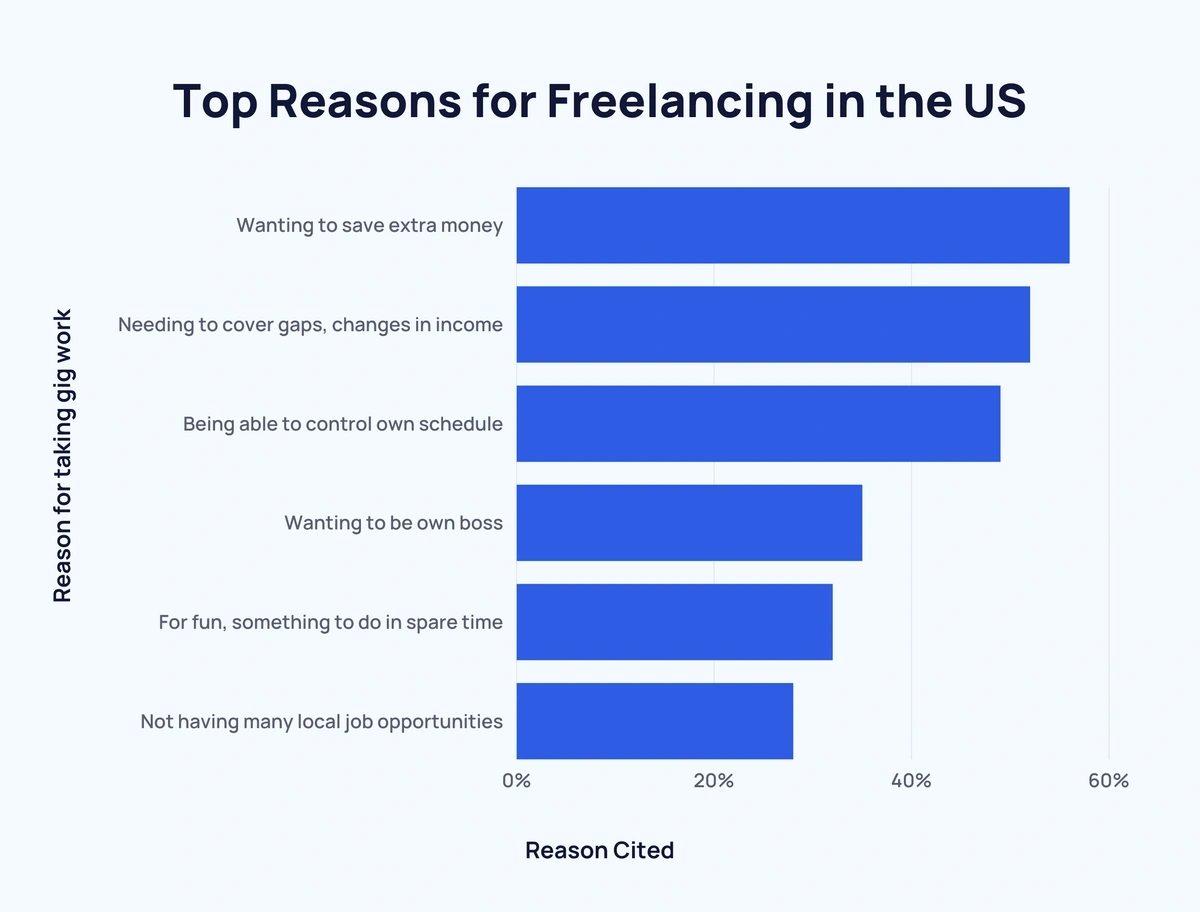
Here’s a full breakdown of the 2021 survey:
|
Reason for Taking Gig Work |
Reason Cited |
|
Wanting to save extra money |
56% |
|
Needing to cover gaps, changes in income |
52% |
|
Being able to control own schedule |
49% |
|
Wanting to be own boss |
35% |
|
For fun, something to do in spare time |
32% |
|
Not having many local job opportunities |
28% |
In general, there appears to be a correlation between freelancers and an optimistic outlook.
From a survey of over 25,000 Americans, around 1 in 3 freelancers expect to have more economic opportunities in 12 months' time - that's compared to 1 in 5 of all workers.
Similarly, over 40% of freelancers think that there will be continuous economic growth in five years. By comparison, around one-third of all workers agree.
According to McKinsey, the most common reason for engaging in contract, freelance, or temporary work is out of necessity to support basic family needs.
Here's a breakdown of their findings:
| Primary Reason for Independent Work | Proportion of Freelancers Who Agree |
| A necessity to support basic family need | 25.7% |
| For the autonomy and flexibility it offers | 24.9% |
| Enjoy the work | 24.7% |
| Additional discretionary income | 19.5% |
| Other | 5.2% |
Source: Pew Research Center, McKinsey
Conclusion
Self-employment has become indispensable to the global workforce - the growing number of freelancers is a testament to this.
And these figures are set to continue to rise over the coming years.
For more content on freelancing and employment, take a look at 7 Remote Work Trends and 57+ Freelance Statistics, Trends and Insights.