Get Advanced Insights on Any Topic
Discover Trends 12+ Months Before Everyone Else
How We Find Trends Before They Take Off
Exploding Topics’ advanced algorithm monitors millions of unstructured data points to spot trends early on.

Features
Keyword Research
Performance Tracking
Competitor Intelligence
Fix Your Site’s SEO Issues in 30 Seconds
Find technical issues blocking search visibility. Get prioritized, actionable fixes in seconds.
Powered by data from
50+ Amazing Electric Vehicle Stats (2024)
The electric vehicles (EV) industry is growing year-over-year at an ever-increasing rate.
And consumer interest is far from peaking.
Here’s a closer look at 50+ interesting electric vehicle statistics.
Contents
- EV Industry Size
- EV Market Stats
- EV Technology Statistics
- EV Manufacturer Stats
- EV Industry Forecast
Top EV Industry Statistics
Here are a few intriguing stats to kick things off:
- The EV industry is valued at over $250 billion
- There are in excess of 40 million EVs on the road
- Over 6 million plug-in EVs are sold per year
- Norway leads the way for proportion of new EV registrations
- China have over 8x more publicly available EVSE chargers than any other nation
Keep reading to discover 50+ EV industry stats.
EV Industry Size
The global EV industry is worth over $500 billion (FortuneBuniessInsights)
The electric vehicle industry is currently valued at $500.48 billion.
That’s an increase of around $250 billion from 2020’s valuation of $246.7 billion.
This figure is set to grow significantly in the coming years, reaching over $1.5 trillion in 2030. At a CAGR of 17.8%.
There are over 40 million electric vehicles on the road (IEA)
Global use of electric vehicles has taken off in recent years.
In 2012, there were fewer than 200,000 electric vehicles in use across the world.
By 2017, this figure grew to over 3 million. And according to the latest data, over 10 million electric vehicles are in use around the globe.
Both battery electric vehicles and plug-in hybrid electric vehicles have grown dramatically since 2010.
Here is a breakdown of the types of electric vehicles in use over the past decade:
| Year | Battery Electric Vehicles | Plug-In Hybrid Electric Vehicles | Fuel Cell Electric Vehicles | Total Electric Vehicles | Annual Increase |
| 2010 | 16,875 | 403 | 90 | 17,368 | - |
| 2011 | 55,209 | 9,457 | 128 | 64,794 | ↑ 47,426 |
| 2012 | 114,303 | 70,050 | 158 | 184,511 | ↑ 119,717 |
| 2013 | 225,365 | 161,756 | 187 | 387,308 | ↑ 202,797 |
| 2014 | 407,088 | 296,039 | 275 | 703,402 | ↑ 316,094 |
| 2015 | 728,217 | 516,731 | 936 | 1,245,884 | ↑ 542,482 |
| 2016 | 1,184,735 | 807,700 | 3,235 | 1,995,670 | ↑ 749,786 |
| 2017 | 1,930,245 | 1,207,513 | 6,600 | 3,144,358 | ↑ 1,148,688 |
| 2018 | 3,257,976 | 1,835,762 | 12,603 | 5,106,341 | ↑ 1,961,983 |
| 2019 | 4,760,961 | 2,361,863 | 22,853 | 7,145,677 | ↑ 2,039,336 |
| 2020 | 6,850,327 | 3,346,713 | 31,225 | 10,228,265 | ↑ 3,082,588 |
| 2021 | 11,000,000 | 5,200,000 | - | 16,200,000 | ↑ 5,971,735 |
| 2022 | 18,000,000 | 7,900,000 | - | 25,900,000 | ↑ 9,700,00 |
| 2023 | 26,000,000 | 14,100,000 | 40,800,000 | ↑ 14,900,00 |
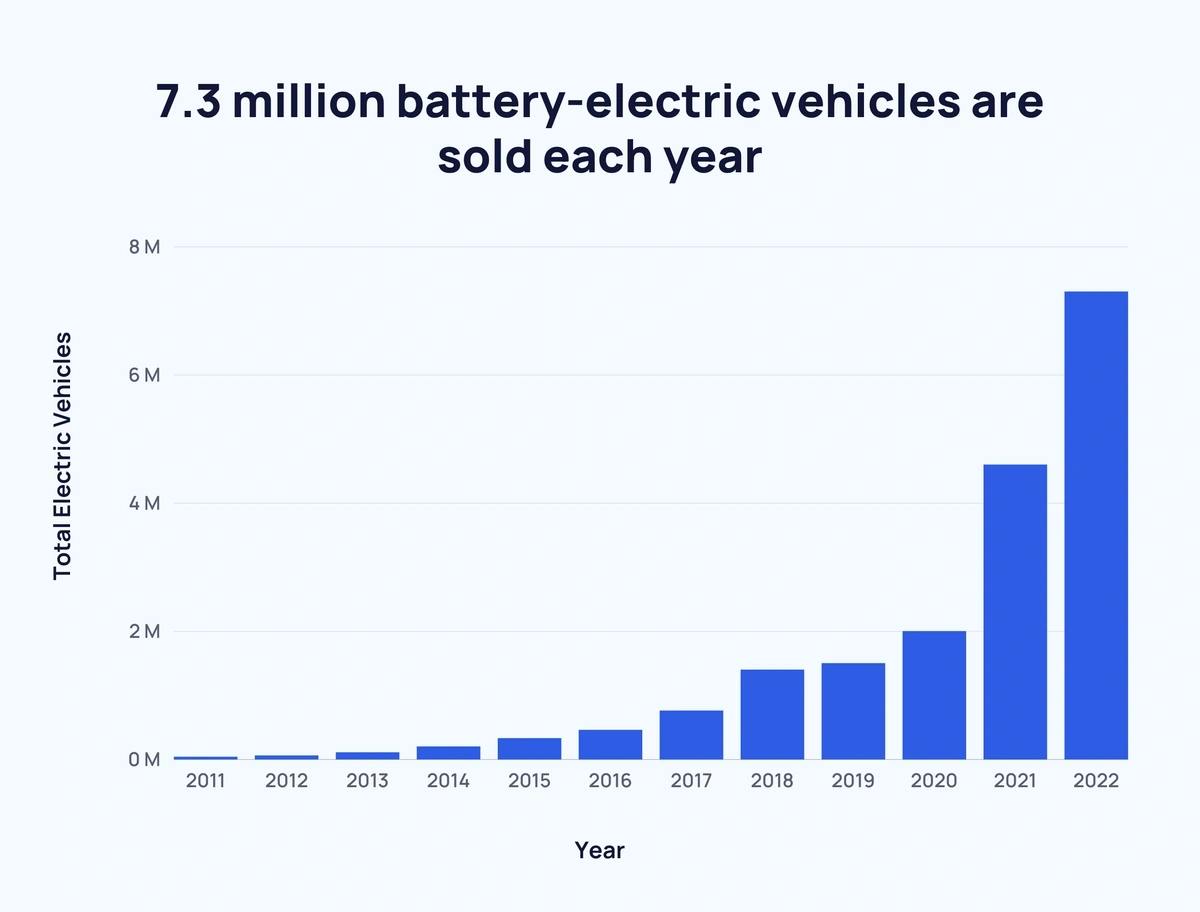
Worldwide battery-electric vehicle sales have grown by around 14x since 2016 (Frost)
In 2022, battery-electric vehicle sales hit 7.3 million worldwide.
Here are global annual battery-electric vehicle sale figures from 2016 through 2022:
| Year | Sales | Percentage Increase Over Previous Year |
| 2011 | 0.04 million | - |
| 2012 | 0.06 million | ↑ 50% |
| 2013 | 0.11 million | ↑ 83.33% |
| 2014 | 0.2 million | ↑ 81.82% |
| 2015 | 0.33 million | ↑ 65% |
| 2016 | 0.46 million | ↑ 39.4% |
| 2017 | 0.76 million | ↑ 65.22% |
| 2018 | 1.4 million | ↑ 84.21% |
| 2019 | 1.5 million | ↑ 7.14% |
| 2020 | 2 million | ↑ 33.33% |
| 2021 | 4.6 million | ↑ 130% |
| 2022 | 7.3 million | ↑ 58.7% |
6.7 million plug-in electric vehicles are sold each year (IEA)
The global plug-in electric vehicle market has seen similar growth to the battery-electric vehicle market. However, the figures are notably higher.
In 2021, over 6 million plug-in electric vehicles were sold across the globe – more than double 2020’s total.
China alone was responsible for 3.4 million plug-in electric vehicle registrations, while Europe saw 2.3 million registrations.
Here are figures for the last seven years of plug-in EV sales:
| Year | Sales | Percentage Increase Over Previous Year | Global Market Share |
| 2016 | 0.9 million | - | 0.89% |
| 2017 | 1.3 million | ↑ 44.45% | 1.36% |
| 2018 | 2.2 million | ↑ 69.23% | 2.30% |
| 2019 | 2.2 million | - 0% | 2.49% |
| 2020 | 3.1 million | ↑ 40.91% | 4.11% |
| 2021 | 6.7 million | ↑ 116.13% | 8.57% |
And here are those sales figures by region:
| Year | China | Europe | United States | Other | Total Sales |
| 2016 | 0.4 million | 0.2 million | 0.2 million | 0.1 million | 0.9 million |
| 2017 | 0.7 million | 0.3 million | 0.2 million | 0.1 million | 1.3 million |
| 2018 | 1.2 million | 0.4 million | 0.4 million | 0.2 million | 2.2 million |
| 2019 | 1.1 million | 0.6 million | 0.3 million | 0.2 million | 2.2 million |
| 2020 | 1.2 million | 1.4 million | 0.3 million | 0.2 million | 3.1 million |
| 2021 | 3.4 million | 2.3 million | 0.7 million | 0.3 million | 6.7 million |
EV Market Stats
Chinese plug-in electric vehicle registration increased by over 2.5x in 2021 (EV-Volumes.com)
The three major markets for EVs each experienced significant growth between 2020 and 2021.
Europe’s plug-in EV registration increased by two-thirds (66%).
Meanwhile, North America’s plug-in EV registration almost doubled (96% increase) in that same time period.
The largest year-over-year change in plug-in EV registration was in China with an increase of 155%.
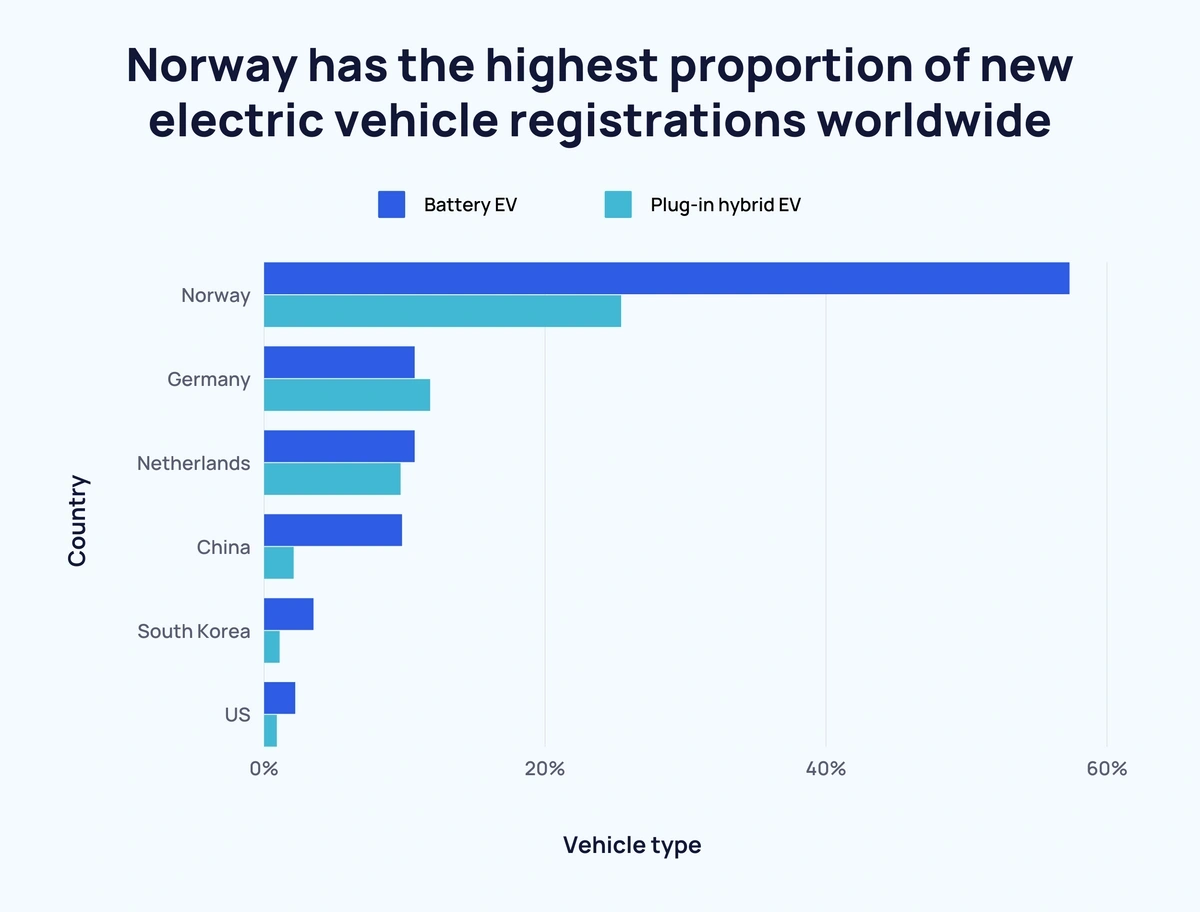
Norway has the highest proportion (over half) of new electric vehicle registrations worldwide (PwC)
As of 2021, Norway was the leading country for the proportion of EVs in new vehicle registrations.
Approximately 4 in 5 new vehicles registered in Norway in 2021 were EVs.
Broken down, 57.3% of new vehicle registrations were for battery electric vehicles. While 25.4% of registrations were for plug-in hybrid electric vehicles.
Here’s how Norway compares to other nations:
| Country | Battery electric vehicles | Plug-in hybrid electric vehicles | Proportion of EVs in new vehicle registrations |
| Norway | 57.3% | 25.4% | 82.7% |
| Germany | 10.7% | 11.8% | 22.5% |
| Netherlands | 10.7% | 9.7% | 20.4% |
| China | 9.8% | 2.1% | 11.9% |
| South Korea | 3.5% | 1.1% | 4.6% |
| United States | 2.2% | 0.9% | 3.1% |
EV Technology Statistics
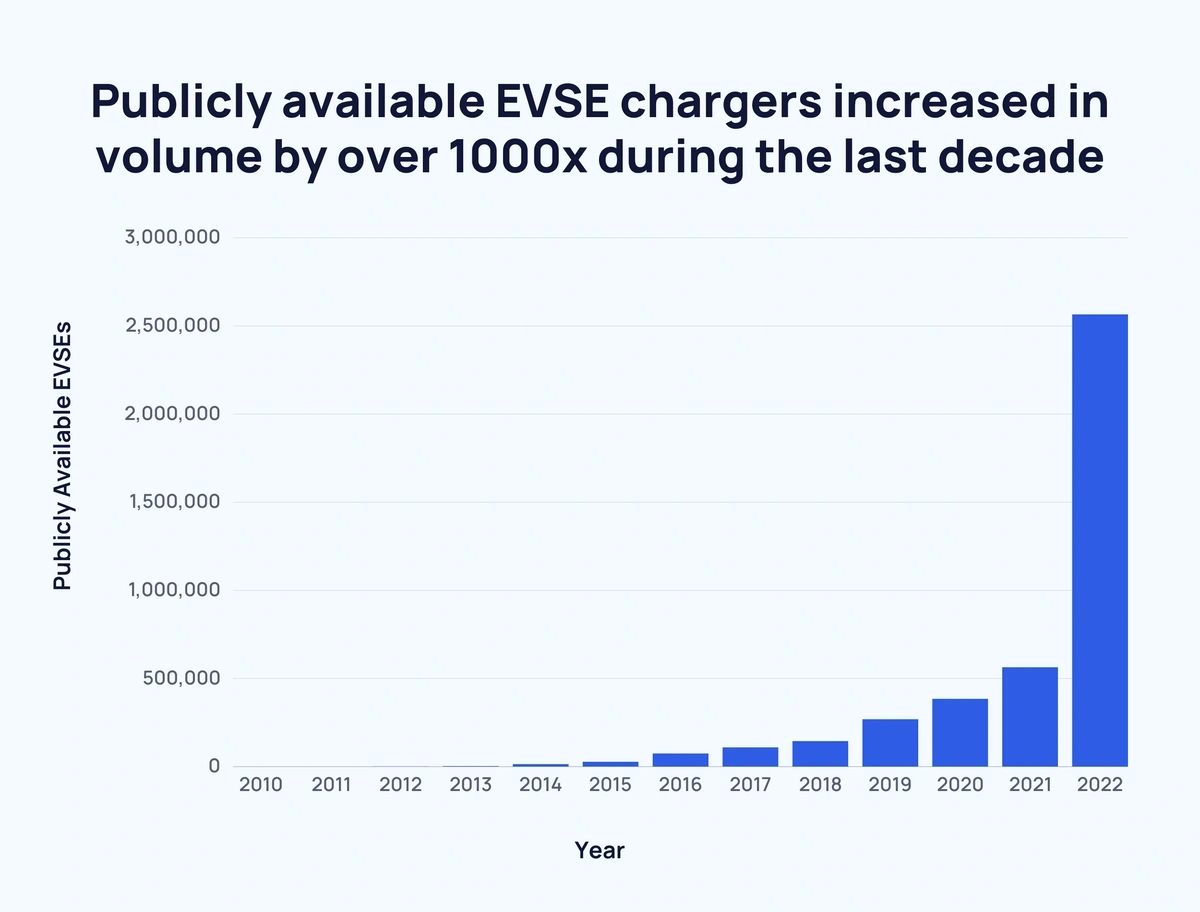
Publically available EVSE chargers increased in volume by well over 1,000x since 2010 (IEA)
The number of publicly available electric vehicle fast chargers (EVSEs) shot up in the 2010s.
In 2010, there were an estimated 310 EVSEs. By 2015, this number had crept up to over 25,000.
In the space of two years, the total increased by around 4x to approximately 109,350 in 2017.
As of 2022, there were over 2.5 million EVSEs worldwide.
Here is a full breakdown of the EVSE figures between 2010 and 2020:
| Year | Publicly Available EVSEs | Percentage Increase Over Previous Year |
| 2010 | 310 | - |
| 2011 | 870 | ↑ 180.65% |
| 2012 | 1,860 | ↑ 113.79% |
| 2013 | 4,000 | ↑ 115.05% |
| 2014 | 15,000 | ↑ 275% |
| 2015 | 27,600 | ↑ 84% |
| 2016 | 75,440 | ↑ 173.33% |
| 2017 | 109,350 | ↑ 44.95% |
| 2018 | 145,460 | ↑ 33.02% |
| 2019 | 269,490 | ↑ 85.27% |
| 2020 | 385,680 | ↑ 43.11% |
| 2021 | 563,910 | ↑ 46.21% |
| 2022 | 2,566,300 | ↑ 355.09% |
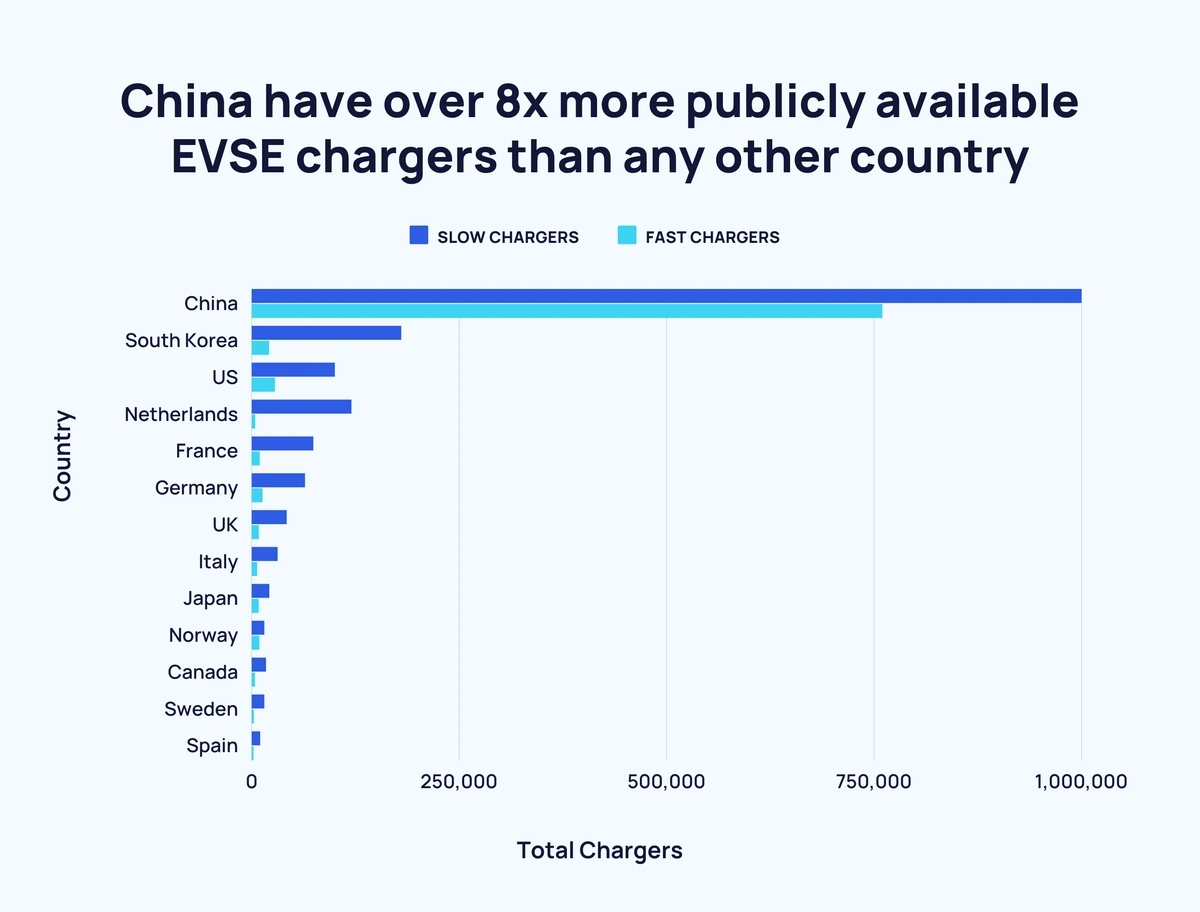
China have over 8x more publicly available EVSE chargers than any other country (IEA)
Unsurprisingly, China is the leading nation when it comes to publicly available EVSEs.
As of 2022, China had 1,760,000 EVSE chargers – 1,000,000 slow and 760,000 fast.
This total is more than double the rest of the top 13 nations put together (approximately 806,300).
By region, eight of those countries are in Europe, three are in North America, and two are in Asia.
Here’s a detailed look at the countries with the most publicly available ESVEs as of 2020:
| Rank | Country | Slow ESVEs | Fast ESVEs | Total ESVEs |
| 1 | China | 1,000,000 | 760,000 | 1,760,000 |
| 2 | South Korea | 180,000 | 21,000 | 201,000 |
| 3 | US | 100,000 | 28,000 | 128,000 |
| 4 | Netherlands | 120,000 | 4,300 | 124,300 |
| 5 | France | 74,000 | 9,700 | 83,700 |
| 6 | Germany | 64,000 | 13,000 | 77,000 |
| 7 | United Kingdom | 42,000 | 8,600 | 50,600 |
| 8 | Italy | 31,000 | 6,500 | 37,500 |
| 9 | Japan | 21,000 | 8,400 | 29,400 |
| 10 | Norway | 15,000 | 9,100 | 24,100 |
| 11 | Canada | 17,000 | 3,900 | 20,900 |
| 12 | Sweden | 15,000 | 2,600 | 17,600 |
| 13 | Spain | 10,000 | 2,200 | 12,200 |
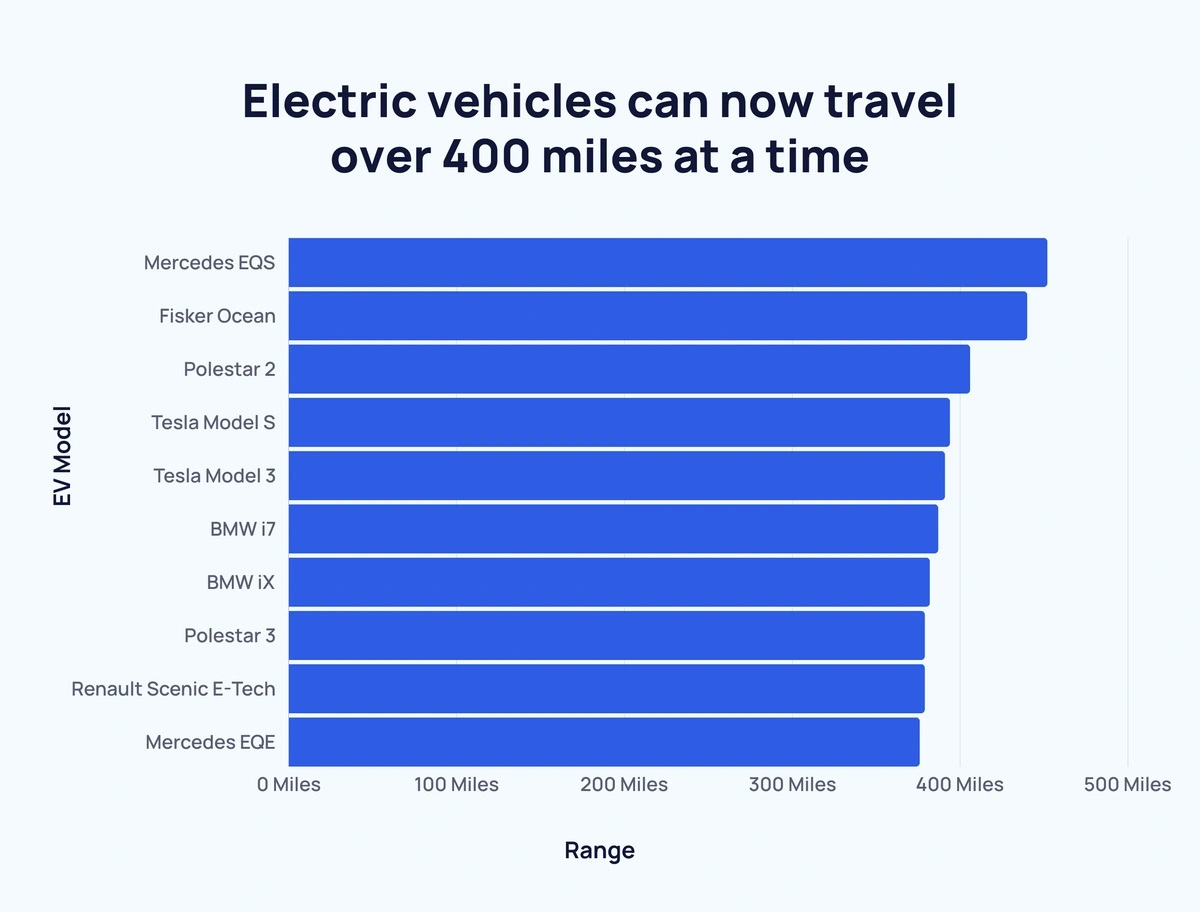
Electric Vehicles can now travel over 400 miles at a time (AutoExpress)
As demand for EVs increases, so does the performance and mileage capabilities of the vehicles.
In 2021, nine different EV models were able to drive 300 miles+ without needing to recharge.
Mercedes, Polestar, Tesla, and BMW each have two models in the top 10 EV vehicles by travel distance.
Each of the top 4 models belonged to a different company:
| Rank | Manufacturer | Model | Range |
| 1 | Mercedes | EQS | 452 miles |
| 2 | Fisker | Ocean | 440 miles |
| 3 | Polestar | 2 | 406 miles |
| 4 | Tesla | Model S | 394 miles |
| 5 | Tesla | Model 3 | 391 miles |
| 6 | BMW | i7 | 387 miles |
| 7 | BMW | iX | 382 miles |
| =8 | Polestar | 3 | 379 miles |
| =8 | Renault | Scenic E-Tech | 379 miles |
| 10 | Mercedes | EQE | 376 miles |
EV Manufacturer Stats
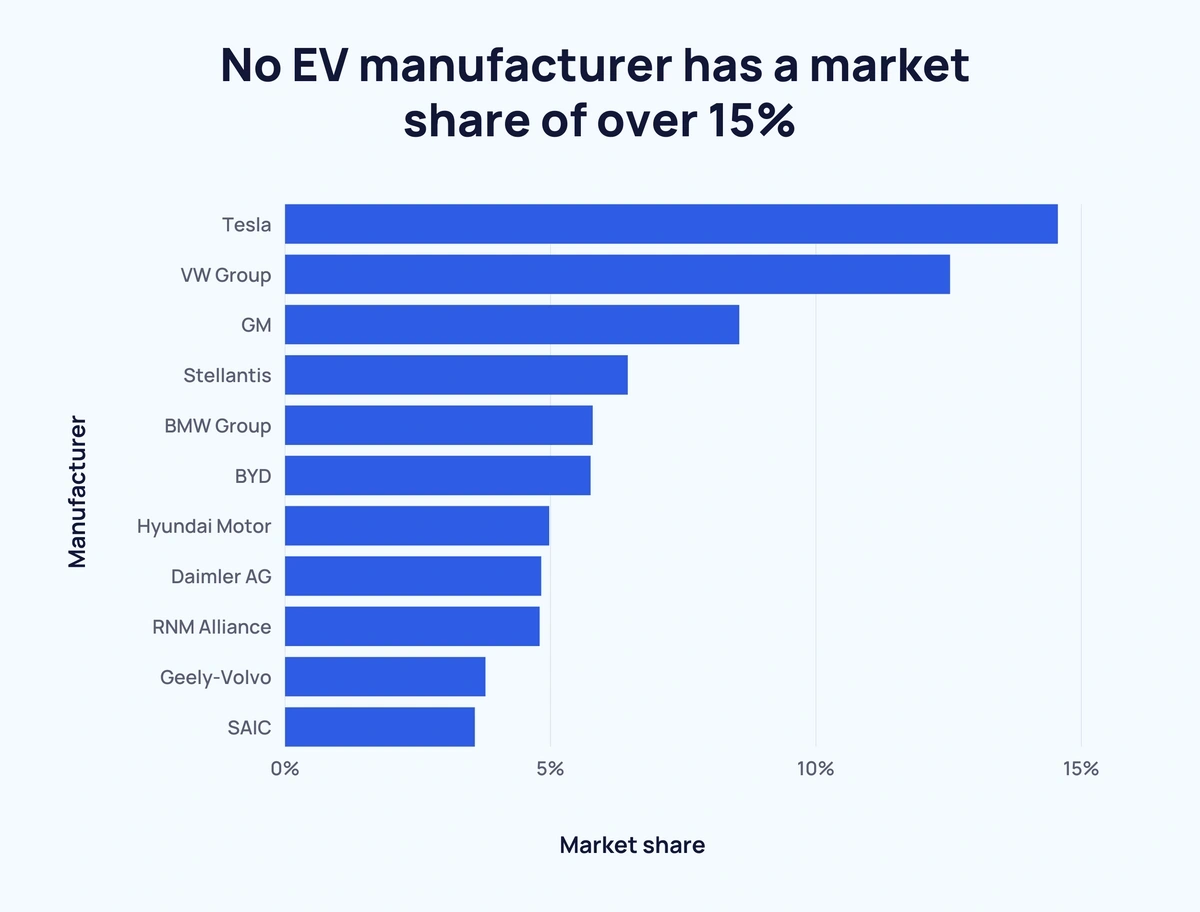
No EV manufacturer has a market share of over 15% (EV-Volumes.com)
The EV market is split among several manufacturers – 11 different companies claimed at least 3% of the market as of H1 2021.
In total, these 11 manufacturers make up just under three-quarters of the overall EV market.
Tesla has the largest market share (14.55%), followed by VW Group (12.52%). Together, the two manufacturing giants account for over one-quarter of the market.
These are the top 11 manufacturers by EV market share as of H1 2021:
- #1 - Tesla – 14.55%
- #2 - VW Group – 12.52%
- #3 - GM – 8.55%
- #4 - Stellantis – 6.45%
- #5 - BMW Group – 5.79%
- #6 - BYD – 5.75%
- #7 - Hyundai Motor – 4.97%
- #8 - Daimler AG – 4.82%
- #9 - Renault-Nissan-Mitsubishi Alliance – 4.79%
- #10 - Geely-Volvo Car Group – 3.77%
- #11 - SAIC – 3.57%
Tesla sold almost 40% more than any other EV manufacturer in 2021 (CleanTechnica)
In 2021, it is estimated that Tesla sold almost 1 million plug-in electric cars worldwide. No other manufacturer came close to that figure.
The manufacturer who sold the second-most – BYD - sold around 340 million fewer units than Tesla.
These were the only two manufacturers to surpass the 500 million mark. A further three surpassed 250 million in sales.
These are the estimated figures for 2021 plug-in EV sales:
- #1 - Tesla - 936 million
- #2 - BYD - 594 million
- #3 - SAIC / GM / Wuling - 456 million
- #4 - Volkswagen - 320 million
- #5 - BMW - 276 million
- #6 - Mercedes - 228 million
- #7 - SAIC - 227 million
- #8 - Volvo - 189 million
- #9 - Audi - 171 million
- #10 - Hyundai - 159 million
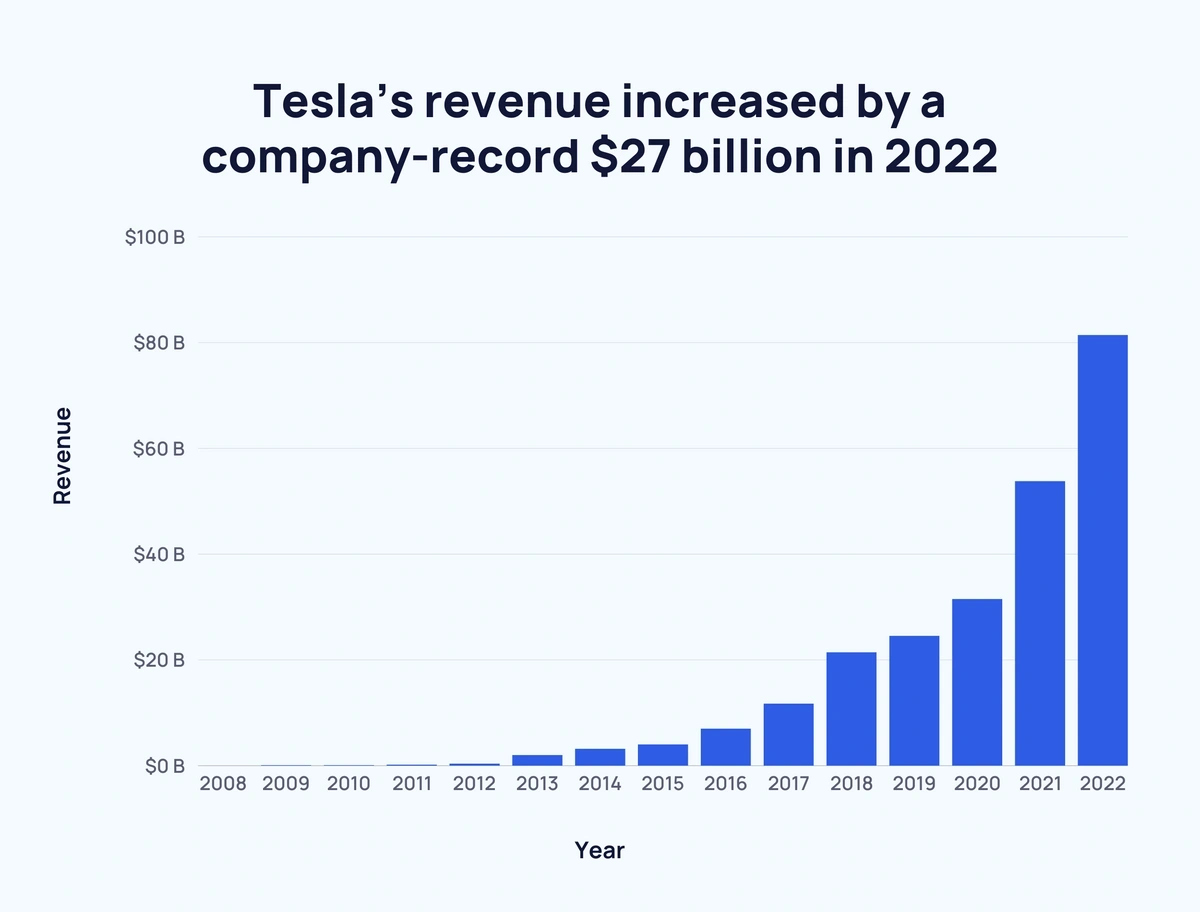
Tesla’s revenue increased by a company-record $27 billion in 2022 (Tesla)
As the most prominent name in EV manufacturing, it’s not surprising to discover Tesla is rapidly increasing its yearly turnover.
Back in 2008, Tesla reported annual revenue of $15 million.
This figure rose year-over-year, surpassing the $1 billion mark in 2013.
By 2017, Tesla had an annual turnover of more than $10 billion.
And by 2020, this figure had tripled to over $30 billion.
In 2022, Tesla’s revenue increased to over $81 billion.
Here’s the full breakdown of Tesla’s annual revenue since 2008:
| Year | Annual Turnover | Percentage Increase Over Previous Year |
| 2008 | $15 million | - |
| 2009 | $112 million | ↑ 646.67% |
| 2010 | $117 million | ↑ 4.46% |
| 2011 | $204 million | ↑ 74.36% |
| 2012 | $413 million | ↑ 102.45% |
| 2013 | $2.014 billion | ↑ 387.65% |
| 2014 | $3.198 billion | ↑ 58.79% |
| 2015 | $4.046 billion | ↑ 26.52% |
| 2016 | $7 billion | ↑ 73.01% |
| 2017 | $11.759 billion | ↑ 67.99% |
| 2018 | $21.461 billion | ↑ 82.51% |
| 2019 | $24.578 billion | ↑ 14.52% |
| 2020 | $31.536 billion | ↑ 28.31% |
| 2021 | $53.825 billion | ↑ 70.67% |
| 2022 | $81.462 billion | ↑ 51.35% |
EV Industry Forecast
Global EV revenue is projected to reach $1.047 trillion by 2026 (Mordor Intelligence)
In 2020, the worldwide EV market revenue was $260.63 billion.
Growing demand and improving technology mean that the EV market is set to grow 4x by 2026.
By 2026, global annual revenue is likely to exceed $1 trillion at an estimated figure of $1.047 trillion.
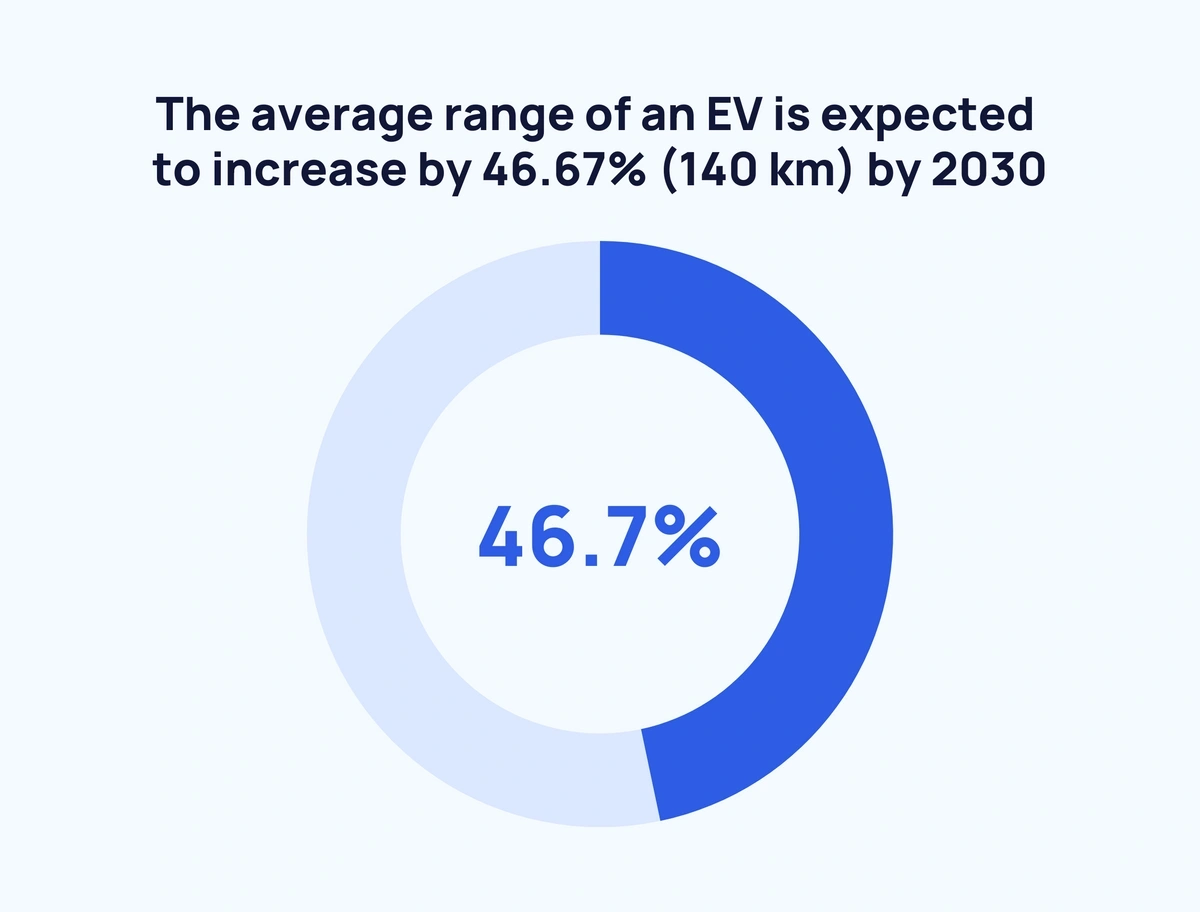
The average range of an EV is expected to increase by 140 km by 2030 (VDA)
As of 2020, the average range of an EV is approximately 300 km.
With improving technology, this is expected to leap to 380 km by 2025.
And average out at 440 km by 2030 – a 10-year increase of 46.67%.
The number of electric passenger vehicles is set to quadruple by 2025 (BloombergNEF)
As of last year, there were an estimated 12 billion electric passenger vehicles worldwide - accounting for around 1% of the global feet.
By 2025, this figure is forecast to more than quadruple - reaching 54 billion.
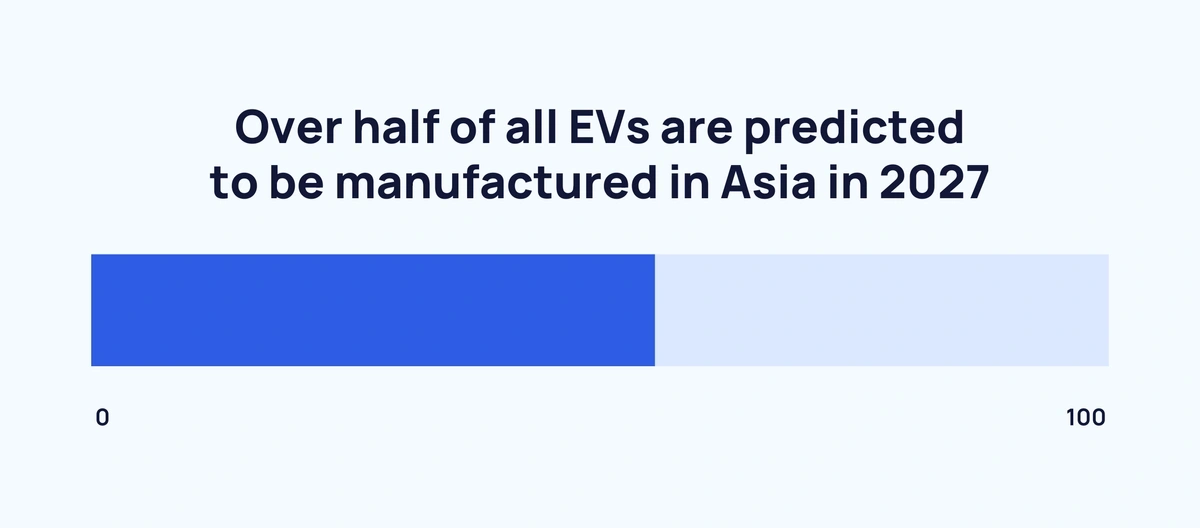
Over half of all EVs are predicted to be manufactured in Asia in 2027 (IHS Markit)
It is projected that in 2027, China will maintain its position as the number 1 worldwide producer of electric vehicles with a share of 43.8%.
Japan and South Korea are expected to produce 11.6% of the world’s EVs in 2027 - taking Asia’s total to over half.
Europe is estimated to account for just under a third (29.2%). And North America prevised to manufacture a little over 1 in 10 EVs (11.6%).
These four regions total 96.2% of the estimated figures.
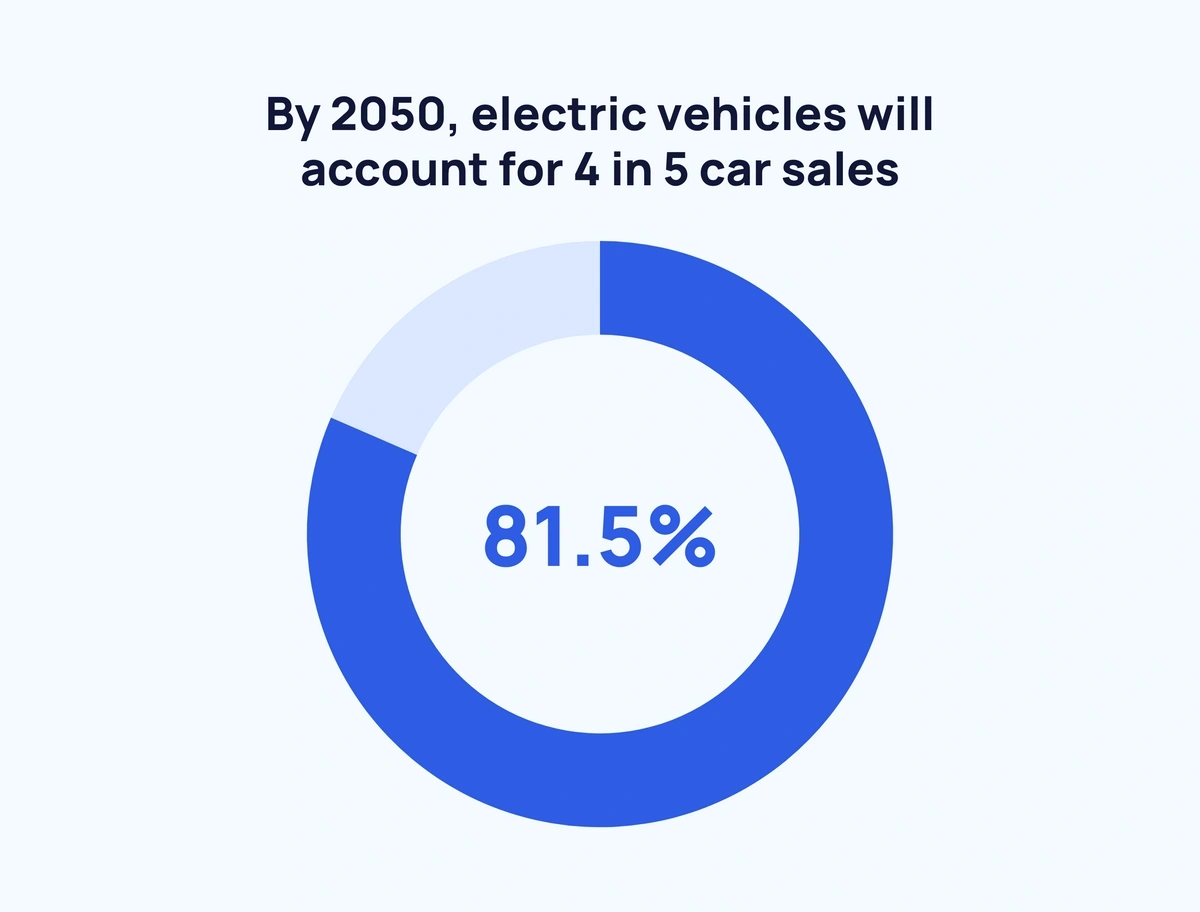
By 2050, EVs will account for 4 in 5 car sales (Morgan Stanley)
EVs are fast becoming the vehicle of choice for consumers. And that is evident in these projections:
In less than a decade (2030), over a quarter (26%) of worldwide new vehicle acquisitions will be for EVs.
By 2040, this figure is predicted to shoot up to 72.2%.
And by 2050, non-electric vehicle purchases will be rare as 81.5% of sales will be for EVs.
Conclusion
That concludes our deep dive into the current state of the EV market.
It's obvious that the EV industry is only heading in one direction (up).
So the pertinent question is not “Are EVs the future of the automotive industry?”. Rather, “How quickly will EVs dominate the automotive industry?”.
If you found this page interesting, take a look at our other related pages: 22 Growing Electric Car Companies, 15 Autonomous Vehicle Startups, and 7 Key Transportation Industry Trends.
Stop Guessing, Start Growing 🚀
Use real-time topic data to create content that resonates and brings results.
Exploding Topics is owned by Semrush. Our mission is to provide accurate data and expert insights on emerging trends. Unless otherwise noted, this page’s content was written by either an employee or a paid contractor of Semrush Inc.
Share
Newsletter Signup
By clicking “Subscribe” you agree to Semrush Privacy Policy and consent to Semrush using your contact data for newsletter purposes
Written By


Josh is the Co-Founder and CTO of Exploding Topics. Josh has led Exploding Topics product development from the first line of co... Read more


