Get Advanced Insights on Any Topic
Discover Trends 12+ Months Before Everyone Else
How We Find Trends Before They Take Off
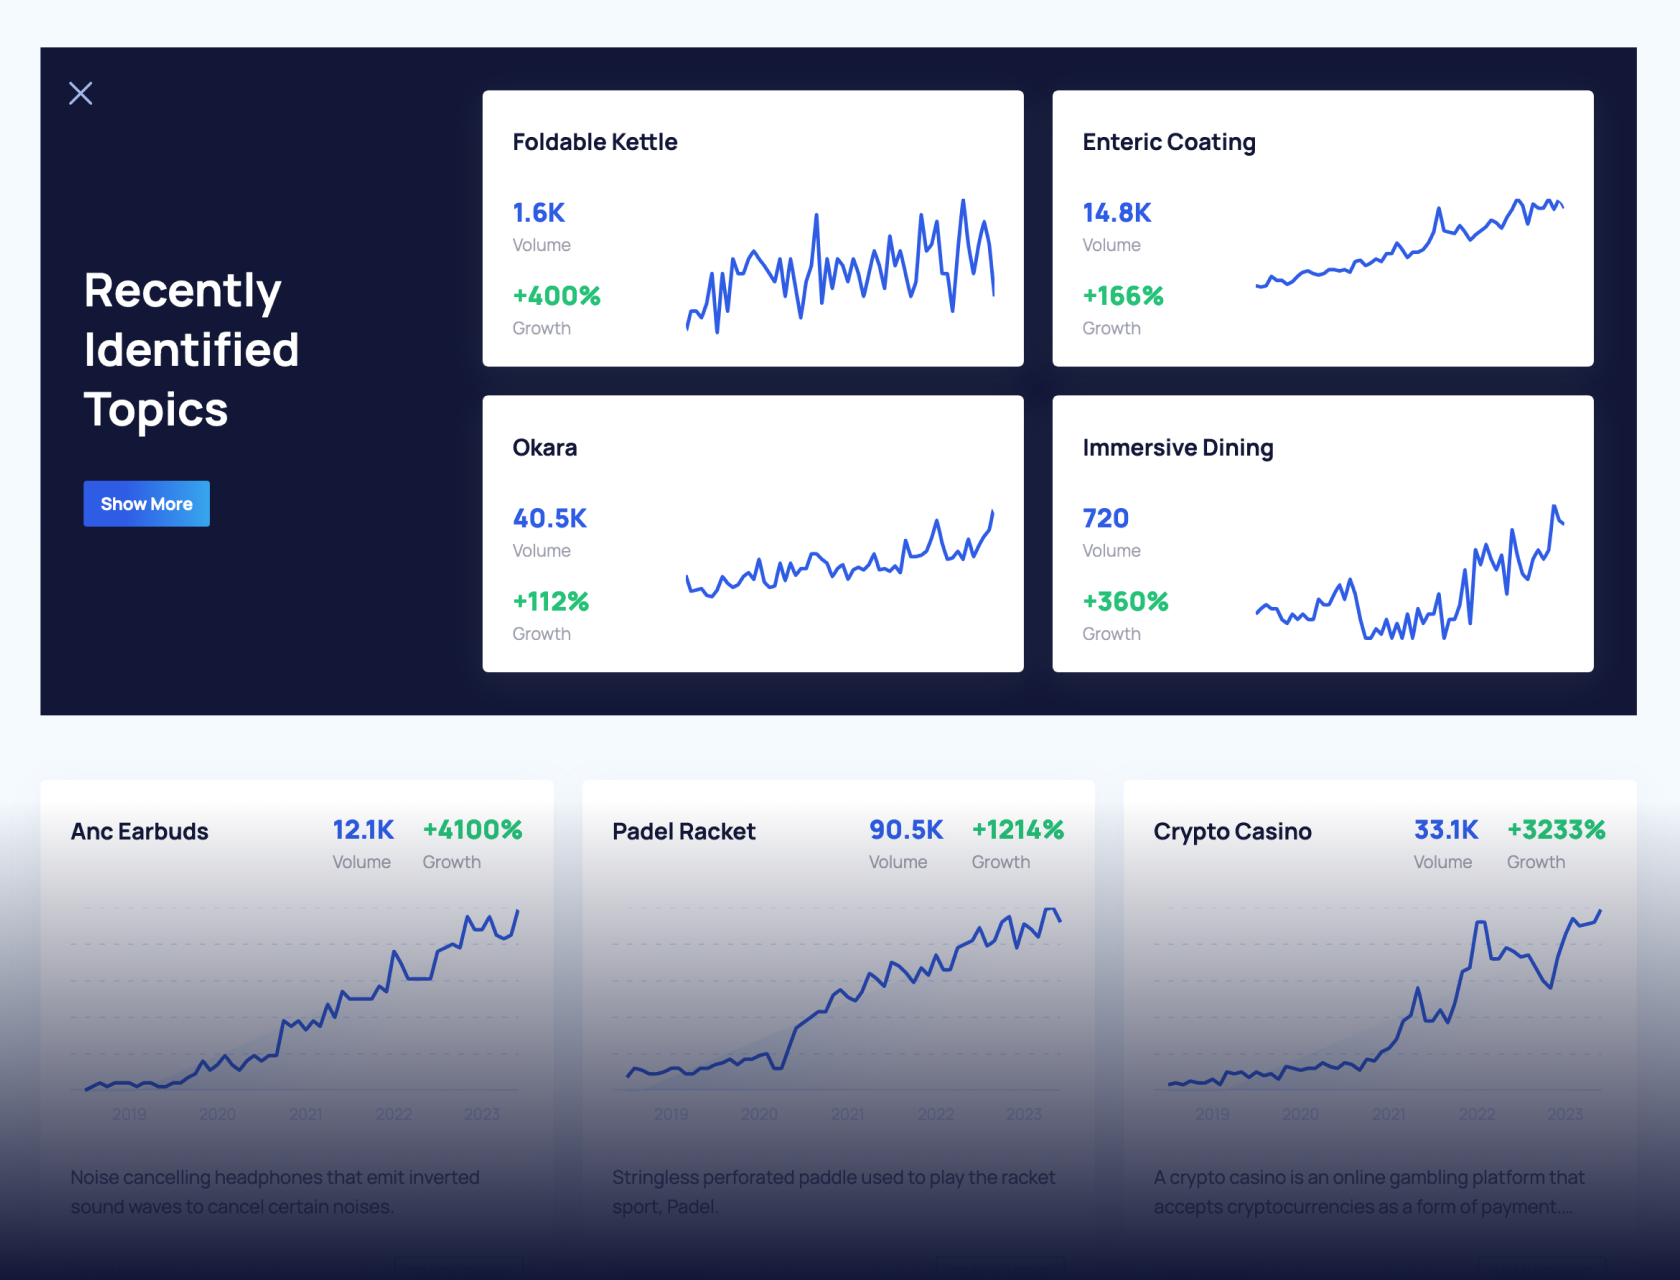
Exploding Topics’ advanced algorithm monitors millions of unstructured data points to spot trends early on.

Features
Keyword Research
Performance Tracking
Competitor Intelligence
Fix Your Site’s SEO Issues in 30 Seconds
Find technical issues blocking search visibility. Get prioritized, actionable fixes in seconds.
Powered by data from
Percent of Corporate Data Stored in the Cloud (2024)
The popularity of cloud computing in business continues to grow.
And each year, more and more corporate data is being stored in the cloud.
We’ll explore the percentage of corporate data stored in the cloud and other related statistics below.
Contents
- Top Corporate Data Storage Statistics
- How Much Corporate Data is Stored in the Cloud?
- Cloud Computing Industry Growth
- Type of Corporate Data Stored in the Cloud
- Cloud Use in Business
- Major Players in Cloud Computing
- Cost of Cloud Computing
Top 4 Corporate Data Storage Statistics
- Around 60% of corporate data is stored in the cloud
- The amount of corporate data stored in the cloud has at least doubled since 2015
- Over 50% of companies store business records in the public cloud
- 89% of companies use a multi-cloud approach
How Much Corporate Data is Stored in the Cloud?
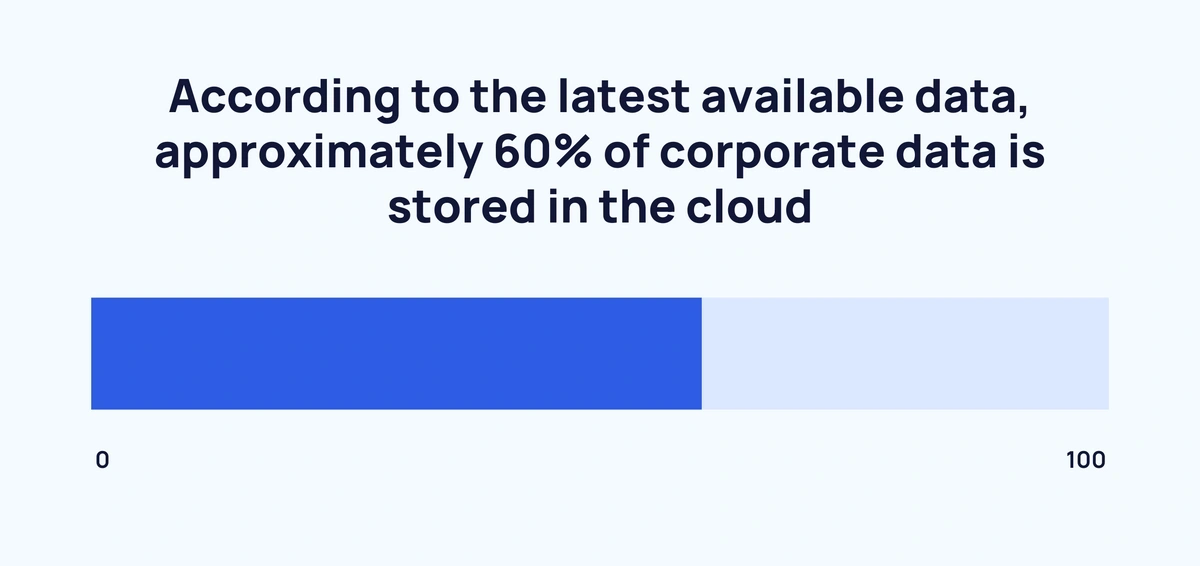
According to the latest available data, approximately 60% of corporate data is stored in the cloud.
This figure has increased 2x from just 30% in 2015.
Here’s how the percentage of corporate data stored in the cloud has changed in recent years:
|
Year |
Proportion of Corporate Data Stored in the Cloud |
|
2015 |
30% |
|
2016 |
35% |
|
2017 |
43% |
|
2019* |
48% |
|
2020 |
50% |
|
2021 |
50% |
|
2022 |
60% |
Source: Thales Group
Cloud Computing Industry Growth
According to the most recent available data, the global cloud computing market is valued at around $545.8 billion.
Over the next few years, the industry is expected to more than double, growing at a CAGR of 17.9% between 2022 and 2027.
By 2027, the cloud computing industry is projected to reach a valuation of $1.24 trillion.
Source: MarketsandMarkets
Type of Corporate Data Stored in the Cloud
Employee data (44%) and customer data (44%) are the most common data categories stored by companies in the cloud.
However, each category has seen a drop from 50% in 2019.
Patient or protected health information is increasingly being stored in the cloud by companies. Since 2019, the proportion of companies storing this sort of data in the cloud has grown from 10% to 14%.
Here’s the data in full:
|
Type of Sensitive Data |
2019 |
2020 |
2022 |
Change Since 2019 |
|
Employee data |
50% |
42% |
44% |
↓ 6% |
|
Customer data |
50% |
44% |
44% |
↓ 6% |
|
Corporate financial information |
26% |
26% |
35% |
↑ 9% |
|
Intellectual property or trade secrets |
16% |
14% |
23% |
↑ 7% |
|
Patient or protected health information |
10% |
12% |
14% |
↑ 4% |
More specifically, most companies (54.4%) keep business records including finance and accounting stored in the public cloud.
Employee records (48.9%) and business intelligence (45.6%) round off the top three.
Here are the latest figures for sensitive data stored in the public cloud:
|
Type of Sensitive Data |
Proportion of Companies Storing Data in the Cloud |
|
Business records (finance and accounting) |
54.4% |
|
Employee records |
48.9% |
|
Business intelligence |
45.6% |
|
Customer personal information |
35.9% |
|
Customer financial information |
32.5% |
|
Intellectual property |
29.5% |
|
Health records |
23.2% |
|
Customer payment card information |
22.4% |
|
National security or law enforcement information |
9.7% |
|
Student records |
8.9% |
|
Other |
5.1% |
Sources: Netwrix, SANS Institute
Cloud Use in Business
As many as 89% of companies use a multi-cloud approach. While 80% take a hybrid approach, utilizing public and private clouds.
Yet, 97% of IT leaders still intend to expand their cloud systems further.
As of 2022, the majority (61%) of businesses use either one (34%) or two (27%) clouds in their organization.
These figures have shifted in favor of using one cloud over two. In 2019 62% of businesses used either one (30%) or two (32%).
The number of organizations using three clouds has almost halved from 20% in 2019 to 11% in 2022. While the number of companies using four clouds has dipped from 7% to 3%.
Here’s the data on the number of clouds used by organizations over time:
|
Year |
0 clouds |
1 cloud |
2 clouds |
3 clouds |
4 clouds |
5+ clouds |
|
2019 |
9% |
30% |
32% |
20% |
7% |
2% |
|
2020 |
7% |
33% |
30% |
20% |
6% |
3% |
|
2021 |
4% |
35% |
30% |
22% |
6% |
2% |
|
2022 |
6% |
34% |
27% |
11% |
3% |
2% |
Sources: Flexera
Major Players in Cloud Computing
In the previous 12 months leading up to September 2022, cloud infrastructure service revenue totaled $217 billion.
From Q3 2022 to Q2 2023 cloud infrastructure service revenue grew to $247 billion.
In Q2 2023 alone, it generated $65 billion.
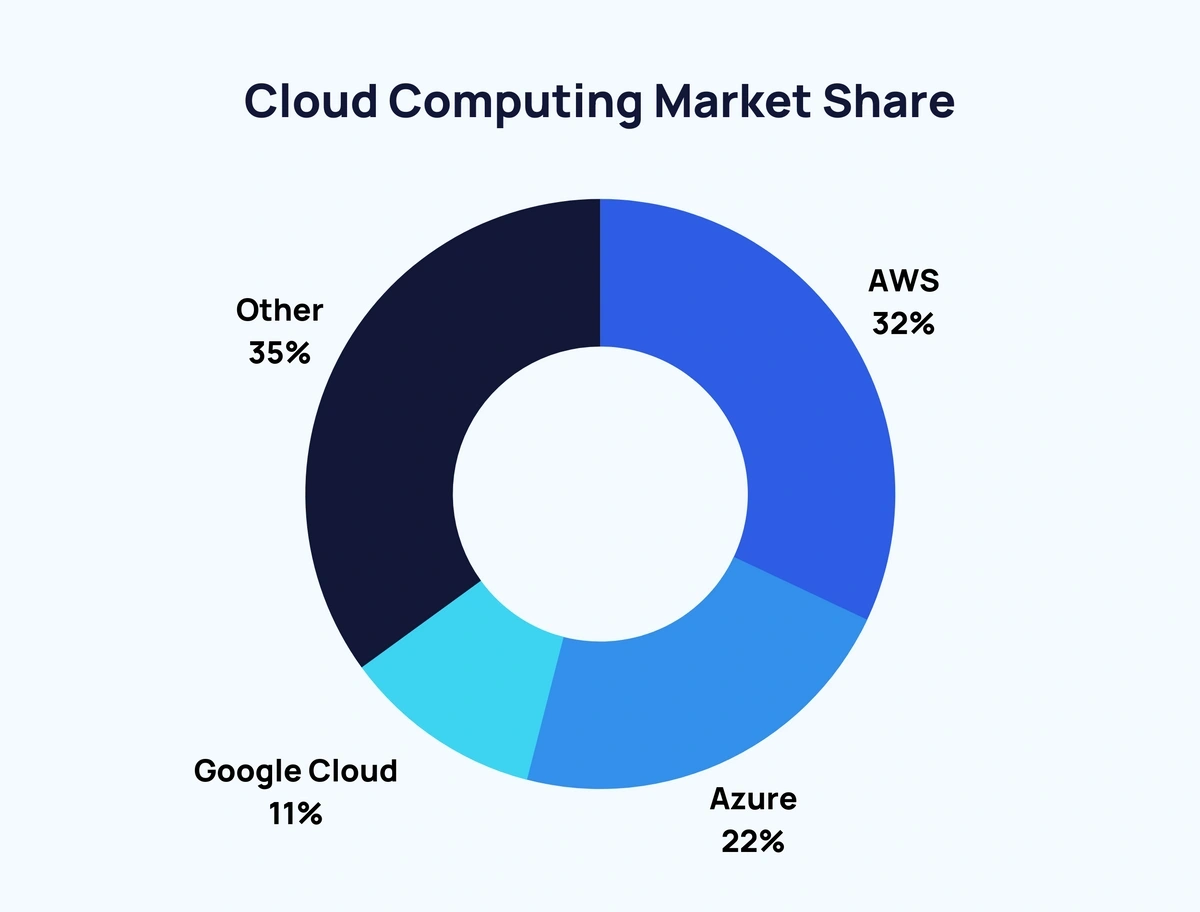
Amazon Web Services is the leading cloud infrastructure service provider with a market share of 32%.
Combined, AWS (32%), Microsoft Azure (22%), and Google Cloud (11%) make up around two-thirds (65%) of the cloud market space.
Here’s a breakdown of the major players in the cloud computing market:
|
Cloud Infrastructure Service Provider |
Market Share |
Approximate Revenue |
|
Amazon Web Services |
32% |
$79.04 billion |
|
Microsoft Azure |
22% |
$54.34 billion |
|
Google Cloud |
11% |
$27.17 billion |
|
Alibaba Cloud |
4% |
$9.88 billion |
|
IBM Cloud |
3% |
$7.41 billion |
|
Salesforce |
3% |
$7.41 billion |
|
Tencent Cloud |
2% |
$4.94 billion |
|
Oracle |
2% |
$4.94 billion |
Source: Statista
Cost of Cloud Computing
Each of the three major cloud providers offers a variety of payment options depending on the service. Long-term, infrequently accessed archive data is considerably cheaper than standard cloud services.
Amazon Web Services
Prices range from $0.00099 per GB for S3 Glacier Deep Archive to $0.125/GB-month for Provisioned IOPS SSD (io2).
Microsoft Azure
Prices range from $0.00099 per GB for Azure Blob Archive Storage to $0.16 per provisioned GiB for Premium Azure Files.
Google Cloud
Prices range from $0.0012 per GB, per month for Google Cloud Archive Storage to $19.84432/vCPU per month for On-Demand Predefined vCPUs.
Source: TechTarget, AWS, Azure, Google Cloud
Conclusion
Cloud infrastructure is now vital to many organizations.
And data storage in the cloud is only likely to increase in the near future.
For more stats on this topic, take a look at Cloud Computing Trends and Skyrocketing Data Storage Startups.
Stop Guessing, Start Growing 🚀
Use real-time topic data to create content that resonates and brings results.
Exploding Topics is owned by Semrush. Our mission is to provide accurate data and expert insights on emerging trends. Unless otherwise noted, this page’s content was written by either an employee or a paid contractor of Semrush Inc.
Share
Newsletter Signup
By clicking “Subscribe” you agree to Semrush Privacy Policy and consent to Semrush using your contact data for newsletter purposes
Written By


Fabio is a research associate at Exploding Topics. Since 2021, Fabio has researched, written, and edited articles for the Explo... Read more


