


Get Advanced Insights on Any Topic
Discover Trends 12+ Months Before Everyone Else
How We Find Trends Before They Take Off
Exploding Topics’ advanced algorithm monitors millions of unstructured data points to spot trends early on.

Keyword Research
Performance Tracking
Competitor Intelligence
Fix Your Site’s SEO Issues in 30 Seconds
Find technical issues blocking search visibility. Get prioritized, actionable fixes in seconds.
Powered by data from
Latest Blog Posts
Featured Case Studies
See what's trending before everyone else
Each week, we'll send you our best Exploding Topics. Plus, expert insight and analysis.
60+ Amazing IoT Statistics (2024-2030)

This guide will feature a variety of Internet of Things (IoT) industry statistics worth highlighting.
(Along with predictions about the future of the space.)
The term “IoT” has only been around for a couple of decades. But the space developed enormously during that time.
The following page will dive deeper into the IoT space as interest and investment start to really pick up.
Contents
- IoT Industry Size
- Worldwide IoT Spending Stats
- IoT Revenue Stats
- Consumer IoT Spending Stats
- Venture Capital Investment In IoT
- The Future of IoT
IoT Statistics (Top Picks)
- There are well over 18.8 billion connected IoT devices around the globe
- It's expected there will be 25.44 billion IoT devices by 2030
- IoT devices surpassed non-IoT devices in 2020
- There are more than 400 active IoT platforms in existence
- Video entertainment is the biggest spending category in IoT
IoT Industry Size
There are more than twice as many connected IoT devices as there are people worldwide (IoT Analytics)
The volume of connected IoT devices has grown recently. And is expected to grow year-over-year for the foreseeable future.
According to the latest available data, there are approximately 18.8 billion connected IoT devices.
There will be over 40 billion IoT devices within the next 5 years (IoT Analytics)
The number of current IoT devices has grown from 10 billion in 2019 to approximately 18.8 billion at the end of 2024.
Thanks to 5G and other technologies, this figure is expected to more than double to 41.1 billion total IoT devices by 2030.
Worldwide IoT Spending Stats
IoT spending surpassed an estimated $1 trillion in 2023 (FinleyUSA)
Worldwide IoT spending has been increasing year-over-year by at least $40 billion since 2018.
In 2020, IoT spending reached $749 billion. In 2022, global IoT spending was predicted to hit $1 trillion.
And in 2023, predicted spending rose to $1.1 trillion, continuing the increased rate of growth year-over-year.
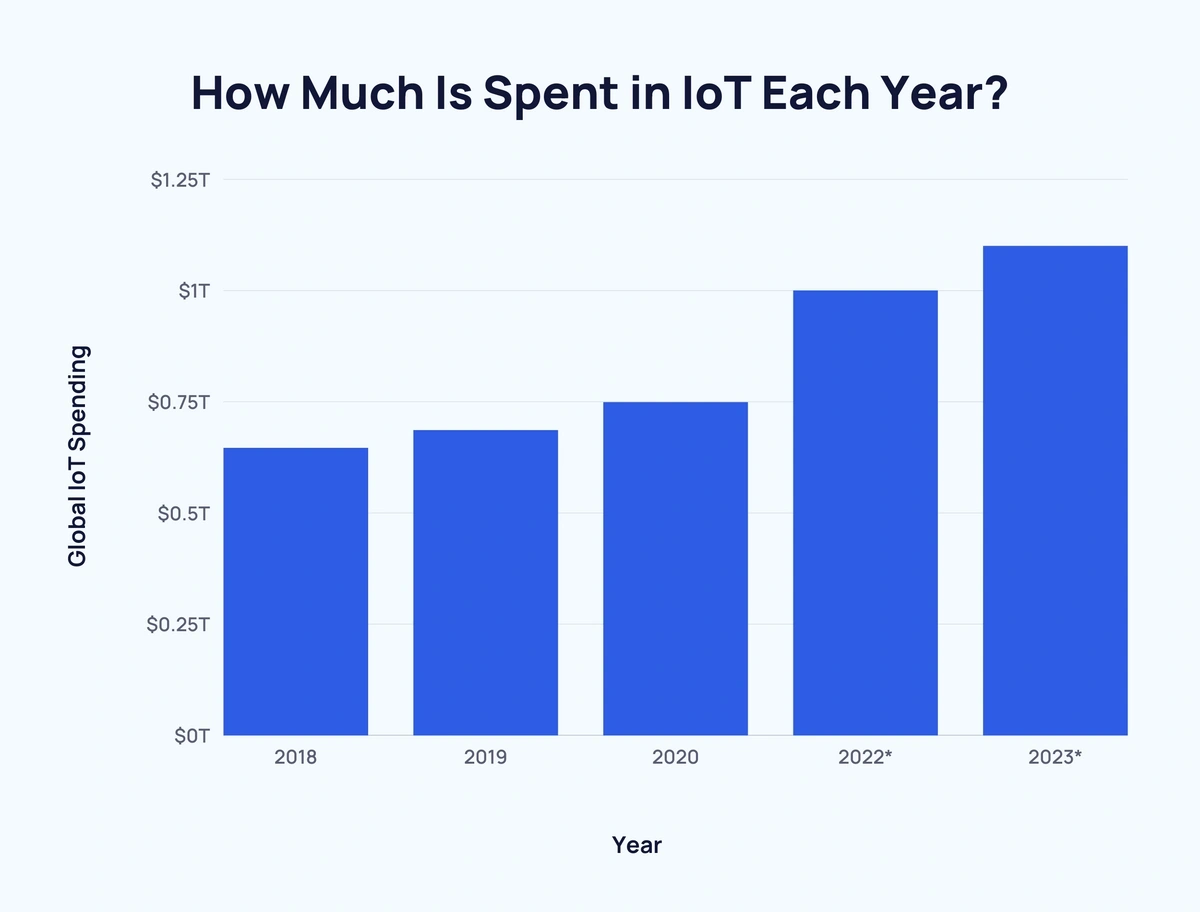
Here is a breakdown of the worldwide IoT spending forecast as of January 2021:
| Year | Global IoT Spending |
| 2018 | $646 billion |
| 2019 | $686 billion |
| 2020 | $749 billion |
| 2022 | $1 trillion* |
| 2023 | $1.1 trillion* |
*forecast spending
China has a 35% IoT market share (Transforma Insights)
China is currently the dominant force in the IoT space, raking in an estimated $157 billion in revenue in 2025.
By 2033, this figure is expected to claim to $296.8 billion.
Here's a breakdown of the IoT market by region over time:
| Region | 2023 | 2024 | 2025 | 2026 | 2027 | 2028 | 2029 | 2030 | 2031 | 2032 | 2033 |
| Greater China | $121.6B | $139.9B | $157B | $173.6B | $189.9B | $206.7B | $224.1B | $241.9B | $260B | $278.3B | $296.8B |
| North America | $68.4B | $80.1B | $91.7B | $103.7B | $116.1B | $129B | $142.5B | $156.2B | $169.9B | $183.4B | $196.6B |
| Europe | $61.9B | $72.1B | $82.4B | $93.3B | $104.4B | $115.9B | $127.9B | $140.4B | $153B | $165.6B | $178.3B |
| Japan | $25.7B | $29.4B | $33B | $36.4B | $39.7B | $43B | $46.2B | $49.4B | $52.5B | $55.4B | $58.2B |
| Latin America | $16.1B | $19.4B | $22.7B | $25.9B | $29.3B | $32.8B | $36.4B | $40.2B | $44.1B | $48B | $52B |
| South Korea | $9.4B | $10.9B | $12.2B | $13.4B | $14.6B | $15.7B | $16.8B | $17.9B | $18.9B | $19.9B | $20.8B |
| India and South Asia | $7.3B | $9.1B | $11.1B | $13.3B | $15.7B | $18.3B | $21.1B | $24.1B | $27.1B | $30.3B | $33.5B |
| South East Asia | $6.9B | $8.7B | $10.7B | $12.9B | $15.3B | $17.9B | $20.6B | $23.3B | $26B | $28.6B | $31.3B |
| MENA | $5.7B | $7B | $8.4B | $10B | $11.7B | $13.6B | $15.7B | $17.9B | $20.2B | $22.6B | $25.1B |
| Russia & Central Asia | $5.2B | $6.1B | $7B | $7.9B | $8.9B | $9.9B | $11.1B | $12.3B | $13.6B | $14.9B | $16.3B |
| Australasia | $4.4B | $5.1B | $5.9B | $6.7B | $7.6B | $8.5B | $9.5B | $10.5B | $11.6B | $12.6B | $13.7B |
| Sub-Saharan Africa | $2.1B | $2.7B | $3.3B | $3.9B | $4.7B | $5.6B | $6.6B | $7.7B | $8.9B | $10.2B | $11.6B |
The video entertainment category sees more spending than all other IoT categories combined (IDC)
Video entertainment was the largest category of smart home spending in 2017 and 2018.
Since then, other categories have occupied a larger share of IoT spending.
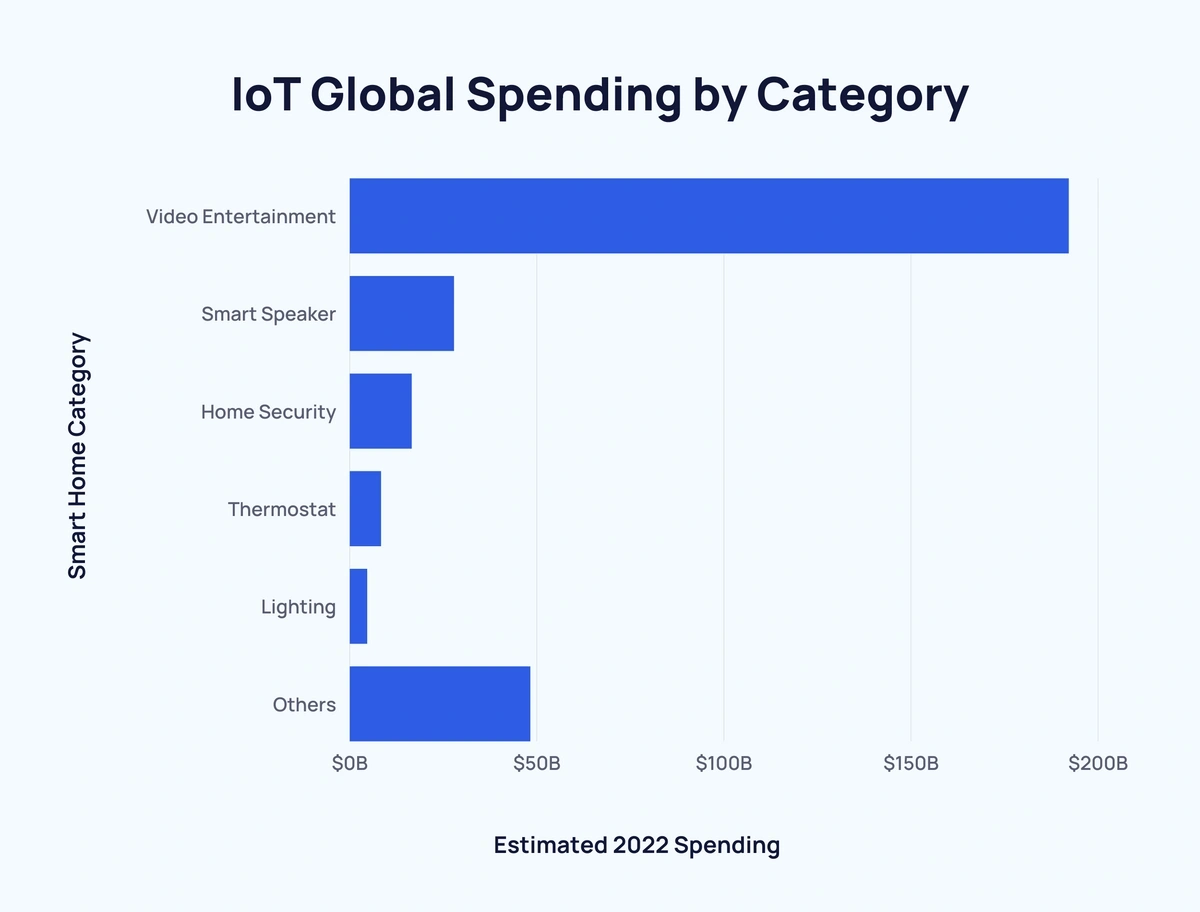
Here’s a look at the estimated smart home spending by category in 2022:
| Smart Home Category | Estimated 2022 Spending | Percentage of Total Spending |
| Video Entertainment | $192.1 billion | 64.6% |
| Smart Speaker | $27.8 billion | 9.3% |
| Home Monitoring/Security | $16.5 billion | 5.5% |
| Thermostat | $8.3 billion | 2.8% |
| Lighting | $4.6 billion | 1.5% |
| Others | $48.2 billion | 16.3% |
IoT Revenue Stats
The IoT industry is worth almost $1 trillion (Statista)
Alongside IoT investment, IoT revenue is expected to grow year-over-year between 2019 and 2030.
The IoT market is currently worth approximately $947.5 billion.
And is expected to grow to almost $1.56 trillion at a CAGR of 10.49% by 2029.
Consumer media topped $100 billion in revenue in 2022 (Tech Business News)
The single largest IoT revenue segment in 2022 was consumer media and internet devices ($101.8 billion).
Connected vehicles ($73.8 billion) and payment terminals ($39.4 billion) were the second and third-highest IoT segments by revenue. Combined, they generated just over 10% more than consumer media and internet devices alone.
Here were the largest IoT segments by revenue in 2022:
- Consumer media and internet devices – $101.8 billion
- Connected vehicles – $73.8 billion
- Payment terminals – $39.4 billion
- Asset tracking and monitoring – $17.2 billion
- Inventory management and monitoring – $11.3 billion
Enterprise IoT makes up around three-quarters of the IoT market (Global Data)
In 2020, enterprise IoT comprised 76% of total IoT market revenue.
That figure has remained relatively steady, albeit falling to 73% in 2024.
Consumer IoT Spending Stats
Smart home spending increased year-over-year at a steady rate between 2015 and 2019 (Strategy Analytics)
Consumer spending on smart home-related devices worldwide increased by at least 12% year-over-year between 2015 and 2019.
Unsurprisingly, during the height of the pandemic in 2020, smart home consumer spending dipped 9.47%.
However, spending is expected to continue its upward trajectory through 2025, increasing year-over-year and peaking at $173 billion.
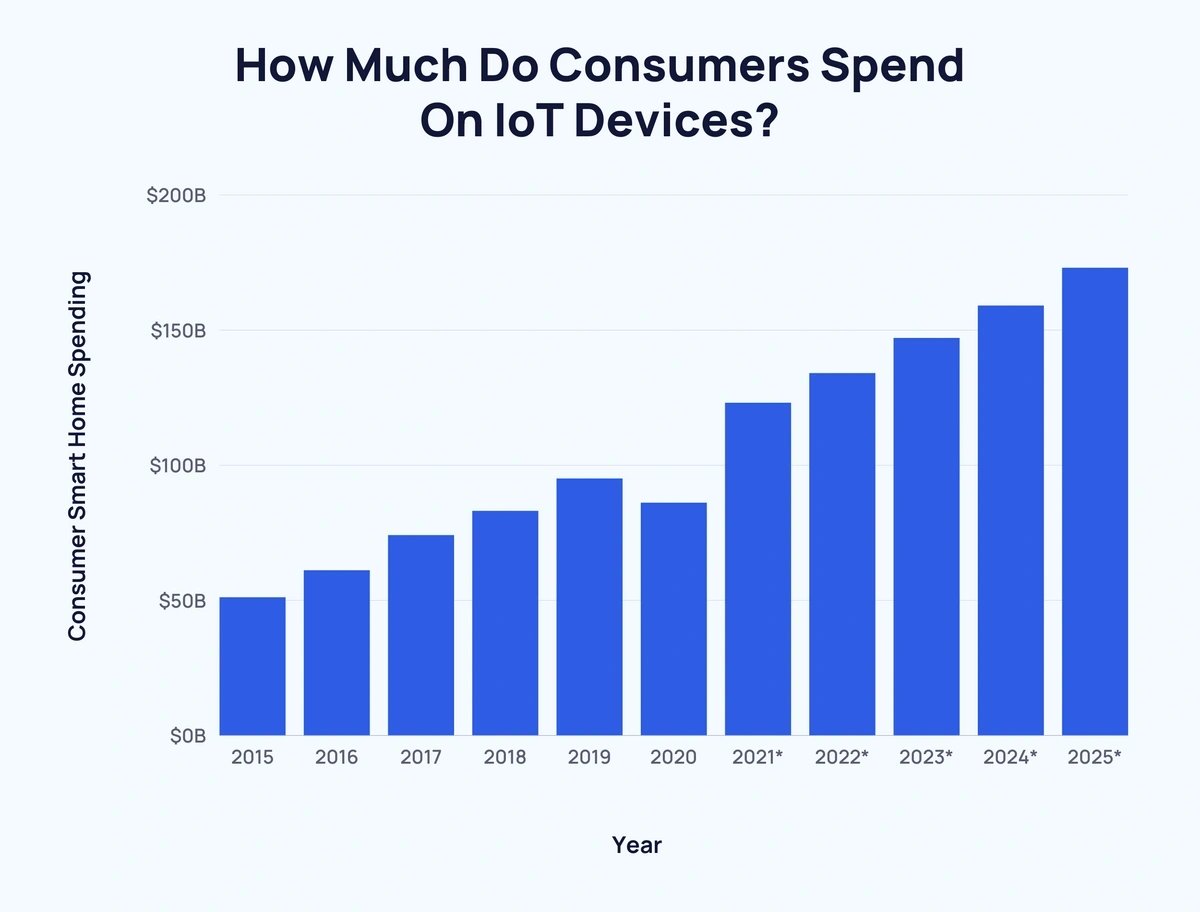
Here is a breakdown of the annual consumer spending figures for smart home products between 2015 and 2025:
| Year | Consumer Smart Home Spending | Change Over Previous Year |
| 2015 | $51 billion | - |
| 2016 | $61 billion | ↑ 19.61% |
| 2017 | $74 billion | ↑ 21.31% |
| 2018 | $83 billion | ↑ 12.16% |
| 2019 | $95 billion | ↑ 14.46% |
| 2020 | $86 billion | ↓ 9.47% |
| 2021 | $123 billion* | ↑ 43.02%* |
| 2022 | $134 billion* | ↑ 8.94%* |
| 2023 | $147 billion* | ↑ 9.70%* |
| 2024 | $159 billion* | ↑ 8.16%* |
| 2025 | $173 billion* | ↑ 8.81%* |
*Predicted figures.
Venture Capital Investment in IoT
VC IoT funding more than doubled between 2013 and 2016 (Crunchbase)
Venture capital (VC) investment in the IoT space has rapidly increased in recent years.
Between 2013 and 2016, total investment grew from around $450 million to $1.03 billion. In that same period, the number of VC deals also increased from approximately 170 to 340.
The following year saw a sharp increase in VC funding, rising 42% to $1.46 billion. The value of each investment also increased as the total number of VC investments dropped to under 300.
And this growth has continued into the present day.
The Future of IoT
Sensor processing is believed to be IoT's main focus in the near future (ARM)
IoT has come a long way in a relatively short space of time. And demand is higher than ever.
A 2021 survey on the future of IoT innovations classed sensor processing as the most important area of focus with 48% of the vote.
Computer vision received 38% of respondent votes, while voice recognition was the other major suggestion with 13%.
"Attacks on IoT devices that impact critical operations" is the number one IoT-related security concern (Thales Group)
A growing number of IoT devices raises an increasing number of security concerns.
According to one survey, here are the top security issues in IoT:
| Survey Response | Percentage of Respondents |
| Attacks on IoT devices that may impact critical operations | 33% |
| Lack of skilled personnel to implement IoT security | 32% |
| Protecting sensitive data generated by an IoT device | 31% |
| Identifying or discovering sensitive data generated by an IoT device | 27% |
| Loss or theft of IoT devices | 27% |
| Lack of security frameworks and controls within the IoT environment | 26% |
| Privacy violations related to data generated by an IoT device | 26% |
| Lack of effective access controls/device authentication | 26% |
| Lack of industry standards for security IoT devices | 25% |
4 in 5 people believe that smart cities can be created with IoT (Telecoms.com)
Outside of convenience in the home, IoT has the capability to change the world – and that isn’t hyperbole.
Another 2019 survey suggested that the greatest IoT opportunity is smart cities. In total, 81% of respondents believe that IoT can be used to create smart cities, improve traffic management, digital signage, waste management, and more.
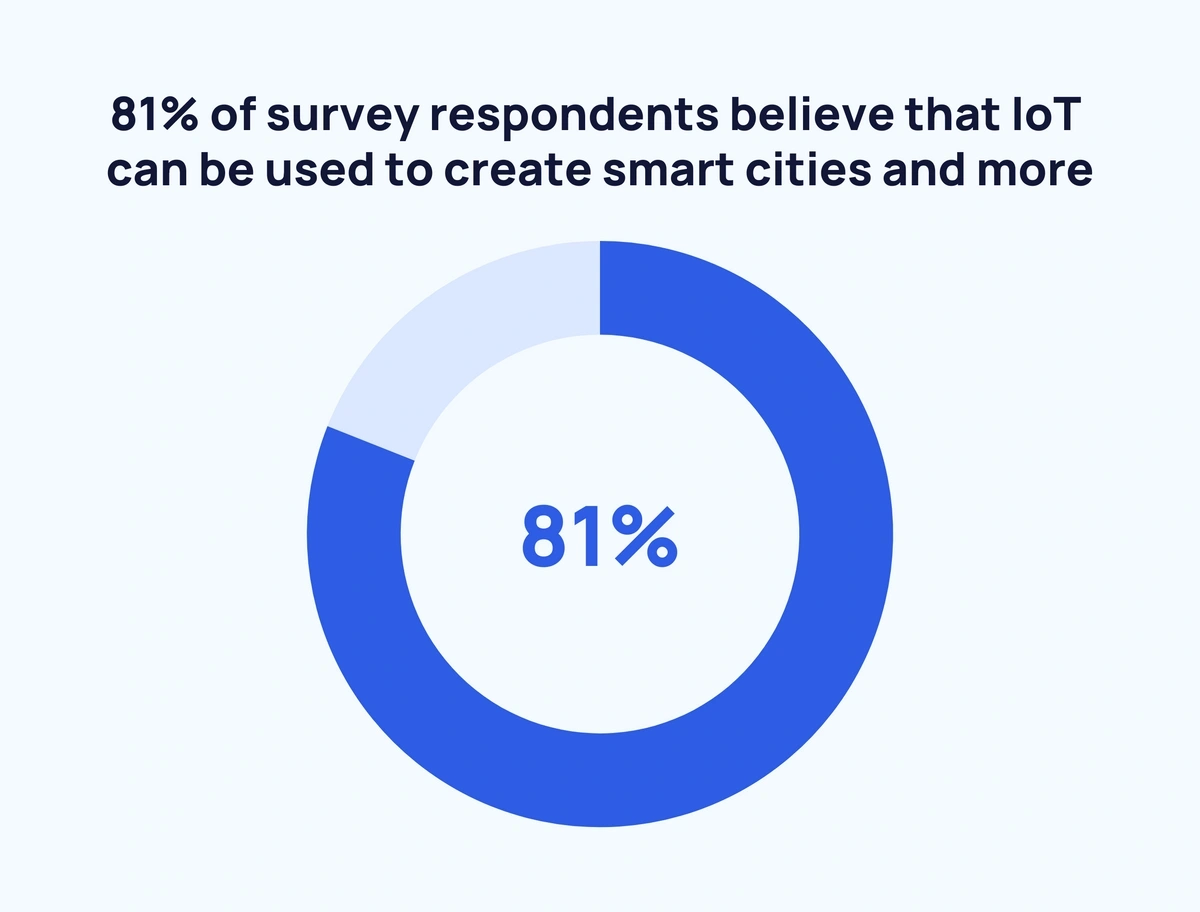
Other popular responses included:
- Utilities – 62%
- Industrial or manufacturing – 61%
- Security – 52%
- Agriculture – 49%
- Connected cars – 47%
Conclusion
That wraps up our look at the current IoT landscape.
From increasing investment to the skyrocketing number of devices, we hope these IoT stats helped you get a handle on this fast-growing space.
If you enjoyed this stats page, check out our important IoT trends and rising IoT startups.
Stop Guessing, Start Growing 🚀
Use real-time topic data to create content that resonates and brings results.

Exploding Topics is owned by Semrush. Our mission is to provide accurate data and expert insights on emerging trends. Unless otherwise noted, this page’s content was written by either an employee or a paid contractor of Semrush Inc.
Share
Newsletter Signup
By clicking “Subscribe” you agree to Semrush Privacy Policy and consent to Semrush using your contact data for newsletter purposes
Written By


Fabio is a research associate at Exploding Topics. Since 2021, Fabio has researched, written, and edited articles for the Explo... Read more