Get Advanced Insights on Any Topic
Discover Trends 12+ Months Before Everyone Else
How We Find Trends Before They Take Off
Exploding Topics’ advanced algorithm monitors millions of unstructured data points to spot trends early on.
Features
Keyword Research
Performance Tracking
Competitor Intelligence
Fix Your Site’s SEO Issues in 30 Seconds
Find technical issues blocking search visibility. Get prioritized, actionable fixes in seconds.
Powered by data from
How Many AI Companies Are There? (2025)
AI is becoming increasingly commonplace across many industries. And every year, there is a growing number of AI companies.
Below, we’ll explore how many companies currently use AI, as well as other relevant data associated with the topic.
- Top AI Company Stats
- Number of AI Companies in 2025
- How Many Companies Use AI?
- New AI Startups Acquisitions By Year
- Global AI Funding
- Global AI Revenue
- AI Companies by Region
- AI Market Key Players
Top 5 AI Companies Stats
- There are currently over 30,000 AI companies worldwide.
- Around 1 in 4 AI companies are based in the US.
- Approximately 2 in 5 (42%) companies are exploring the use of AI.
- Global AI funding has grown by over 1,000% since 2013.
- Baidu is the largest patent owner with around 19,000 patent families registered.
Number of AI Companies in 2025
As of October 2025, there are around 33,089 artificial intelligence companies.
A large percentage of AI companies and startups are based in the United States (approximately 25%).
Over the course of the last 10 years, 2,078 new companies have been launched annually.
Source: Tracxn
Build a winning strategy
Get a complete view of your competitors to anticipate trends and lead your market
How Many Companies Use AI?
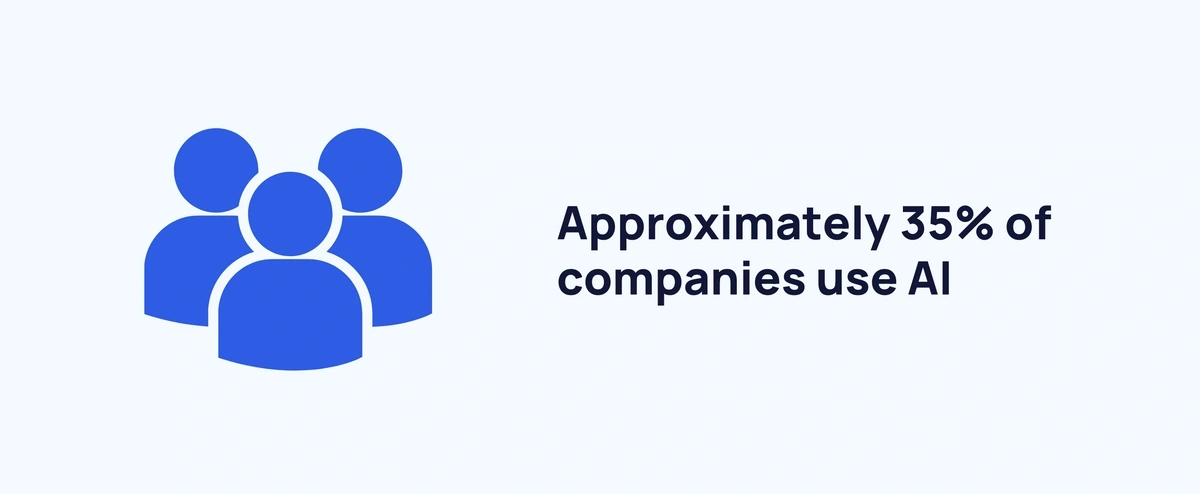
Recent data suggests that over one-third (35%) of companies use AI.
Given that there are 2.63 billion internet users as of 2025, that's as many as 920.5 million potentially using AI.
Sources: BusinessDIT, DataReportal
Countries Ranked by AI Capacity
According to the fourth iteration of the Global AI Index (published September 2024), the US has the highest AI capacity.
The US scored top marks in terms of AI talent, infrastructure, research, development, and commercial viability.
Here’s a breakdown of the top 10 countries by AI capacity scores according to the latest report:
|
Country |
Overall |
Talent |
Infra. |
Operating Environment |
Research |
Development |
Gov. Strategy |
Commercial |
|
US |
100 |
100 |
100 |
96 |
100 |
100 |
83 |
100 |
|
China |
54 |
26 |
66 |
70 |
54 |
69 |
66 |
48 |
|
Singapore |
32 |
30 |
50 |
55 |
25 |
21 |
59 |
27 |
|
UK |
30 |
32 |
27 |
90 |
23 |
12 |
65 |
25 |
|
France |
28 |
25 |
31 |
70 |
18 |
31 |
59 |
19 |
|
South Korea |
27 |
20 |
42 |
64 |
11 |
37 |
69 |
14 |
|
Germany |
27 |
35 |
32 |
83 |
16 |
14 |
59 |
17 |
|
Canada |
26 |
26 |
27 |
75 |
15 |
14 |
70 |
23 |
|
Israel |
26 |
27 |
25 |
47 |
17 |
19 |
35 |
29 |
|
India |
24 |
42 |
15 |
90 |
10 |
13 |
55 |
14 |
And here’s a look at those same countries by AI capacity rank:
|
Country |
Overall |
Talent |
Infra. |
Operating Environment |
Research |
Development |
Gov. Strategy |
Commercial |
|
US |
1 |
1 |
1 |
2 |
1 |
1 |
2 |
1 |
|
China |
2 |
9 |
2 |
21 |
2 |
2 |
5 |
2 |
|
Singapore |
3 |
6 |
3 |
48 |
3 |
5 |
10 |
4 |
|
UK |
4 |
4 |
17 |
4 |
4 |
16 |
7 |
5 |
|
France |
5 |
10 |
14 |
19 |
6 |
4 |
9 |
8 |
|
South Korea |
6 |
12 |
7 |
11 |
12 |
3 |
6 |
18 |
|
Germany |
7 |
3 |
13 |
8 |
8 |
11 |
8 |
9 |
|
Canada |
8 |
8 |
18 |
16 |
9 |
10 |
3 |
6 |
|
Israel |
9 |
7 |
26 |
65 |
7 |
6 |
32 |
3 |
|
India |
10 |
2 |
68 |
3 |
14 |
13 |
11 |
13 |
Source: Tortoise Media
New AI Startups Acquisitions By Year
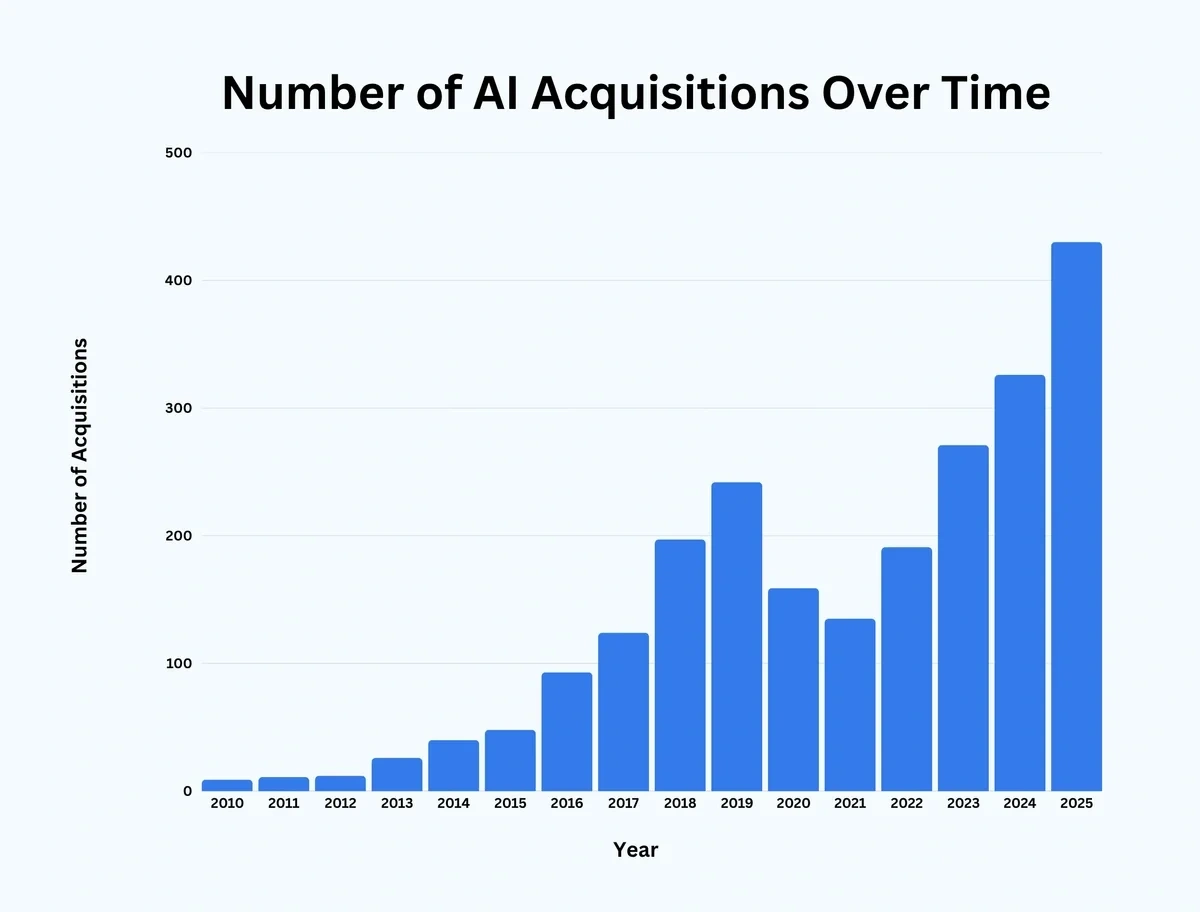
The number of AI startup acquisitions is projected to surpass 430 in 2025.
Between 2010 and 2019, AI acquisitions increased year-over-year.
Here’s a look at the number of AI startup acquisitions since 2010:
|
Year |
Number of Acquisitions |
Change Over Previous Year |
|
2010 |
9 |
- |
|
2011 |
11 |
↑ 2 |
|
2012 |
12 |
↑ 1 |
|
2013 |
26 |
↑ 14 |
|
2014 |
40 |
↑ 14 |
|
2015 |
48 |
↑ 8 |
|
2016 |
93 |
↑ 45 |
|
2017 |
124 |
↑ 31 |
|
2018 |
197 |
↑ 73 |
|
2019 |
242 |
↑ 45 |
|
2020 |
159 |
↓ 83 |
|
2021 |
135 |
↓ 24 |
|
2022 |
191 |
↑ 56 |
|
2023 |
271 |
↑ 80 |
|
2024 |
326* |
↑ 55 |
|
2025 |
430* |
↑ 104 |
Sources: CB Insights, Aventis Advisors
Global AI Funding
AI funding has grown 1,632% since 2013, reaching $252.33 billion in 2024.
This is how AI funding has progressed over recent years:
|
Year |
Investment |
|
2013 |
$14.57 billion |
|
2014 |
$19.04 billion |
|
2015 |
$25.43 billion |
|
2016 |
$33.82 billion |
|
2017 |
$53.72 billion |
|
2018 |
$79.62 billion |
|
2019 |
$103.27 billion |
|
2020 |
$221.87 billion |
|
2021 |
$360.73 billion |
|
2022 |
$253.25 billion |
|
2023 |
$201 billion |
|
2024 |
$252.33 billion |
Source: Stanford University
Global AI Revenue
It is estimated that global AI revenue has more than doubled from $95.6 billion in 2021 to approximately £207.9 billion in 2023.
By 2030, that figure is expected to exceed $1.8 trillion. That’s an increase of around 9x since 2023.
Here’s a projection of global AI revenue:
|
Year |
AI Market Value |
Change Over Previous Year |
|
2021 |
$95.6 billion |
- |
|
2022 |
$142.1 billion |
↑ $46.5 billion |
|
2023 |
$207.9 billion |
↑ $65.8 billion |
|
2024 |
$298.2 billion |
↑ $90.3 billion |
|
2025 |
$420.5 billion |
↑ $122.3 billion |
|
2026 |
$582.9 billion |
↑ $162.4 billion |
|
2027 |
$795.4 billion |
↑ $212.5 billion |
|
2028 |
$1.069 trillion |
↑ $273.6 billion |
|
2029 |
$1.415 trillion |
↑ $346 billion |
|
2030 |
$1.847 trillion |
↑ $432 billion |
Source: Next Move Strategy Consulting
AI Market Key Players
Baidu is the largest patent owner with 18,882 patent families registered. This figure has more than tripled since 2020 (5,885).
Here are the top companies by AI patents from 2013 to 2022:
|
Number of Active Patent Families | ||||||||||
|
2013 |
2014 |
2015 |
2016 |
2017 |
2018 |
2019 |
2020 |
2021 |
2022 | |
|
Baidu |
147 |
270 |
494 |
681 |
1,141 |
2,176 |
3,633 |
5,885 |
9,869 |
13,993 |
|
Tencent |
125 |
223 |
332 |
438 |
713 |
1,550 |
3,639 |
6,921 |
10,218 |
13,187 |
|
State Grid Corp |
255 |
495 |
861 |
1,255 |
1,792 |
2,442 |
3,795 |
5,667 |
8,242 |
11,555 |
|
Chinese Academy of Sciences |
695 |
977 |
1,312 |
1,648 |
2,208 |
2,886 |
4,120 |
5,660 |
7,661 |
9,909 |
|
IBM |
1,528 |
1,735 |
1,985 |
2,317 |
2,900 |
3,806 |
4,865 |
6,566 |
8,050 |
9,497 |
|
Ping An Insurance |
- |
1 |
1 |
11 |
46 |
534 |
2,531 |
4,207 |
6,714 |
9,142 |
|
Samsung |
836 |
1,035 |
1,664 |
2,476 |
3,313 |
4,322 |
4,985 |
5,879 |
6,862 |
8,690 |
|
Huawei |
205 |
284 |
398 |
524 |
673 |
924 |
1,564 |
2,512 |
4,164 |
6,510 |
|
Microsoft |
3,350 |
3,524 |
3,671 |
3,966 |
4,374 |
4,865 |
5,347 |
5,740 |
6,048 |
6,356 |
|
Alibaba Group |
90 |
130 |
170 |
304 |
652 |
1,107 |
2,287 |
3,022 |
4,060 |
5,429 |
Source: LexisNexis PatentSight
Key Takeaways
The above data paints a clear picture of the growing use of AI.
And in the coming years, the number of AI companies looks likely to increase further.
If you found this data interesting, take a look at our other AI-related content: Top AI Trends, Growing AI Companies & Startups, and AI Market Size Statistics.
Stop Guessing, Start Growing 🚀
Use real-time topic data to create content that resonates and brings results.
Exploding Topics is owned by Semrush. Our mission is to provide accurate data and expert insights on emerging trends. Unless otherwise noted, this page’s content was written by either an employee or a paid contractor of Semrush Inc.
Share
Newsletter Signup
By clicking “Subscribe” you agree to Semrush Privacy Policy and consent to Semrush using your contact data for newsletter purposes
Written By


Fabio is a research associate at Exploding Topics. Since 2021, Fabio has researched, written, and edited articles for the Explo... Read more


