


Get Advanced Insights on Any Topic
Discover Trends 12+ Months Before Everyone Else
How We Find Trends Before They Take Off
Exploding Topics’ advanced algorithm monitors millions of unstructured data points to spot trends early on.

Keyword Research
Performance Tracking
Competitor Intelligence
Fix Your Site’s SEO Issues in 30 Seconds
Find technical issues blocking search visibility. Get prioritized, actionable fixes in seconds.
Powered by data from
Latest Blog Posts
Featured Case Studies
See what's trending before everyone else
Each week, we'll send you our best Exploding Topics. Plus, expert insight and analysis.
Alarming Average Screen Time Statistics (2026)

Screen time has become part of the fabric of everyday life for most.
And many do not realize just how much time they are dedicating to phone screens, computer screens, and TV screens.
With that in mind, we’ll explore the latest screen time data.
Average Screen Time Stats 2026
- Globally, people average 4 hours and 47 minutes of screen time per day
- Short-form video (e.g. TikTok) alone is viewed every week by 86.9% of all internet users
- The average American spends 6 hours and 12 minutes looking at a screen each day
- Almost 1 in 4 Americans aged 18-29 report 9-12 hours of screen time per day
- Kenyans spend 9 hours and 5 minutes on screen per day
- 98% of 2-year-olds view screens on a typical day
- Around 7 in 10 American adults under 30 want to reduce their screen time
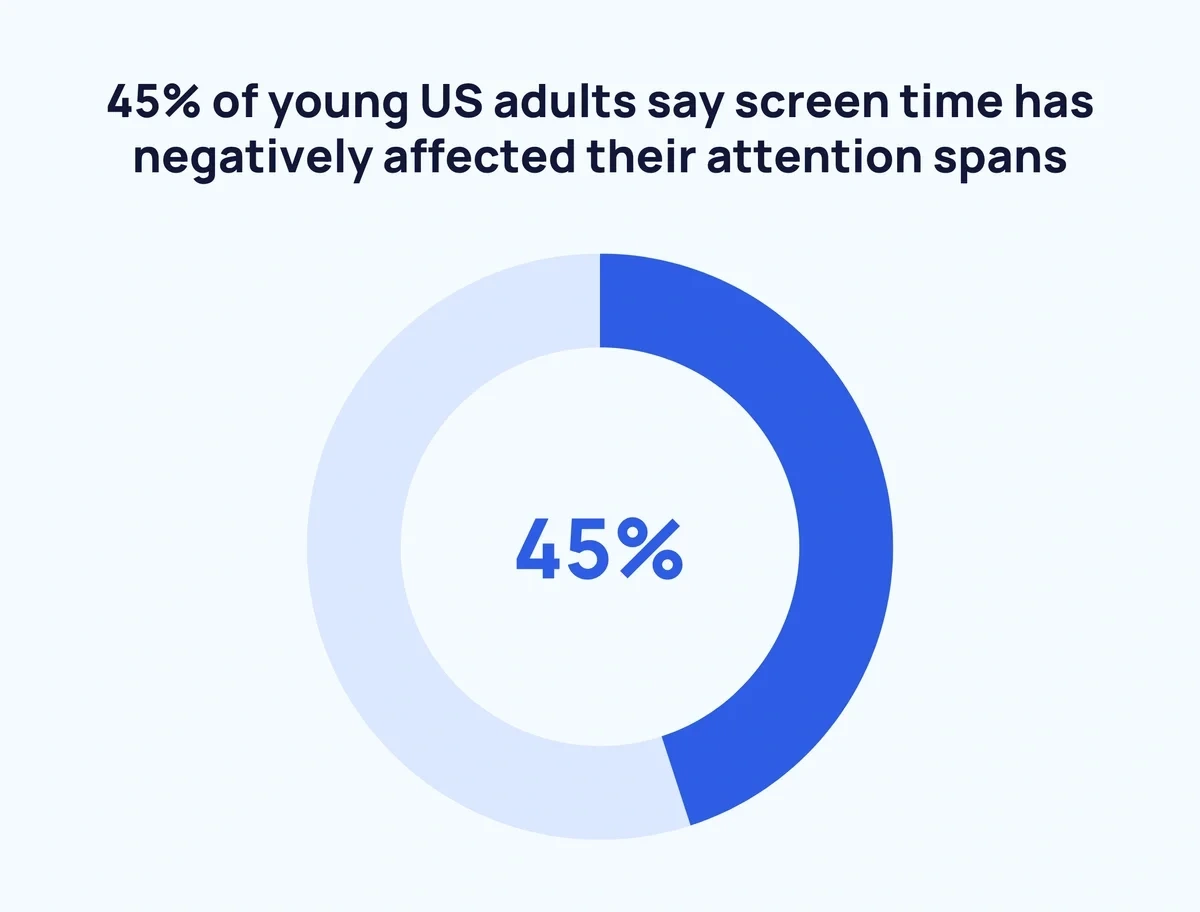
- 45% of young US adults say screen time has negatively affected their attention spans
Average Screen Time Overview
According to the latest available data, the average person spends 4 hours and 47 minutes per day on screens connected to the internet.
That figure equates to approximately 1.2 billion days when extrapolated across all global internet users.
Here’s a breakdown of the average internet-connected screen time since 2013:
| Year | Average Daily Screen Time | Change Over Previous Year |
| Q3 2013 | 6 hours 9 minutes | - |
| Q3 2014 | 6 hours 23 minutes | ↑ 3.8% |
| Q3 2015 | 6 hours 20 minutes | ↓ 0.8% |
| Q3 2016 | 6 hours 29 minutes | ↑ 2.4% |
| Q3 2017 | 6 hours 46 minutes | ↑ 4.4% |
| Q3 2018 | 6 hours 48 minutes | ↑ 0.5% |
| Q3 2019 | 6 hours 38 minutes | ↓ 2.5% |
| Q3 2020 | 6 hours 54 minutes | ↑ 4% |
| Q3 2021 | 6 hours 58 minutes | ↑ 1% |
| Q3 2022 | 6 hours 31 minutes | ↓ 6.5% |
| Q3 2023 | 6 hours 36 minutes | ↑ 1.3% |
| Q3 2024 | 6 hours 38 minutes | ↑ 0.5% |
| Q2 2025 | 4 hours 47 minutes* | N/A (see below) |
*Surveying techiques changed, so no direct comparison to previous values (i.e. there has not necessarily been a decline in screen time).
The latest figures suggest that the average person spends upwards of 25% of their waking hours on an internet-connected screen.
Online video is the most common form of screen time, with 91.1% of global internet users accessing this content every week.
Here's how screen time breaks down by media type:
| Media | % of internet users who spend screen time on this media every week | Weekly time spent with media |
| Online video (all) | 91.1% | 11:30 |
| Social media | 88.1% | 07:06 |
| Online video shorts (e.g. TikTok) | 86.9% | 06:39 |
| TV (all) | 85.5% | 09:56 |
| Online long-form video | 79.8% | 04:51 |
| Online press | 77.2% | 02:58 |
| Music streaming | 75.6% | 04:58 |
| TV (linear or broadcast) | 73.5% | 04:55 |
| Video games (all) | 72% | 06:56 |
| TV (streaming) | 69.9% | 05:00 |
| Mobile games | 67.6% | 04:19 |
| PC/console games | 49.4% | 02:37 |
Source: Data Reportal (Digital 2026)
US Average Screen Time
The average screen time in the United States is 6 hours 12 minutes per day. That's 1 hour and 25 minutes more than the global average.
It's also the 10th-highest screen time figure in the world.

When it comes to Americans aged 18-29, almost 1 in 4 report spending 9-12 hours per day looking at screens.
Here's the full breakdown of how 18-29-year-olds in the US describe their screen time:
| Daily screen time | Percentage of Americans aged 18-29 |
| Less than 1 hour | 1% |
| 1-2 hours | 3% |
| 3-4 hours | 20% |
| 5-6 hours | 19% |
| 7-8 hours | 20% |
| 9-12 hours | 23% |
| 13-16 hours | 6% |
| More than 16 hours | 2% |
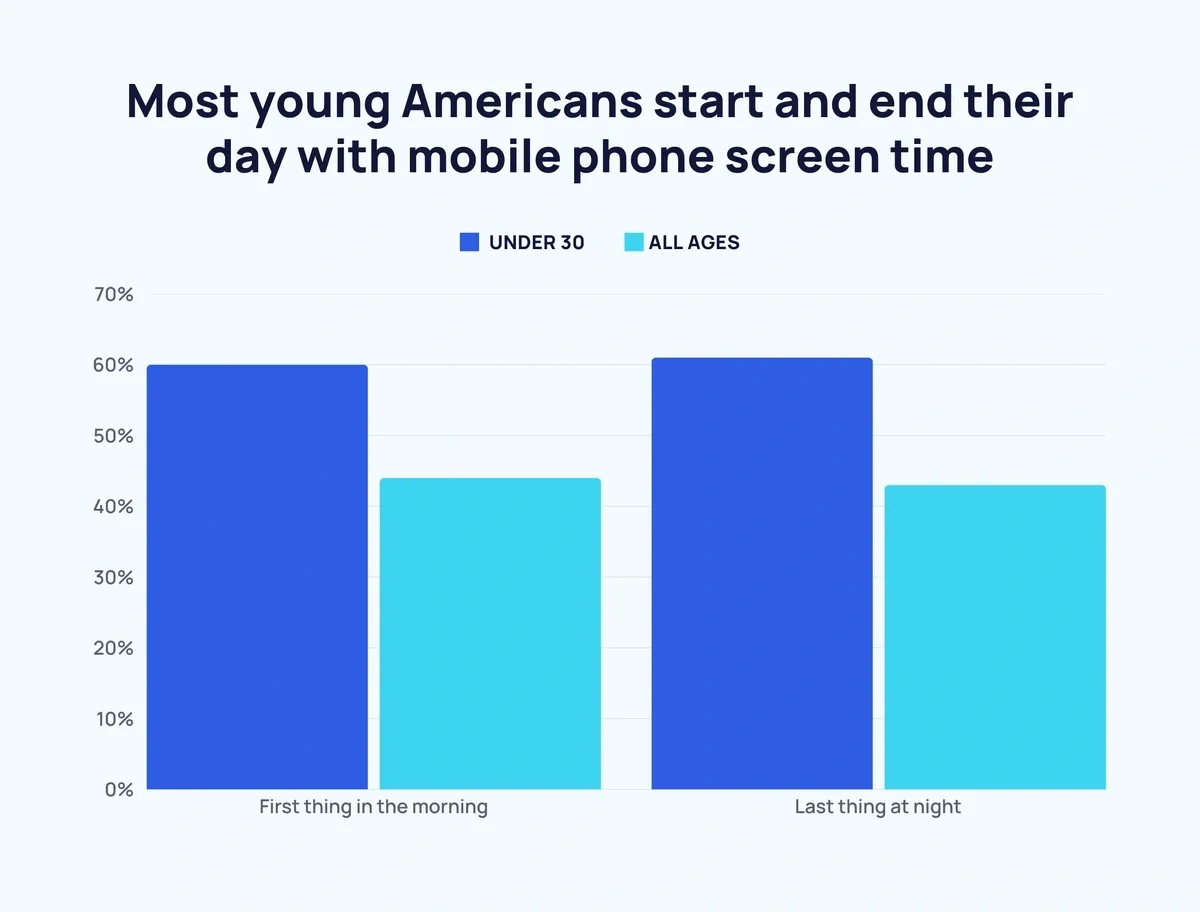
Among US adults under 30, 61% always or often use their phone immediately before falling asleep at night. 60% do the same straight after waking up.
Across all age groups, 43% view their phones right before bed, and 44% do so first thing in the morning.
The split between mobile and computer screen time is almost equal in the US. On average, 3 hours and 22 minutes are dedicated to mobile devices, while 3 hours and 18 minutes are spent on computers.
Somewhat surprisingly, the US is behind the world average in terms of the percentage of internet users who use a smartphone to access the internet. It's still a high figure, at 94.1%, but below the worldwide average of 96%.
On the other hand, the 70.1% of American internet users who use a laptop or desktop is higher than the global average of just 59.6%.
Sources: DataReportal, Comparitech, YouGov
Screen Time Changes Over Time
From phones to tablets and smartwatches to TVs, screens are everywhere.
The vast majority are connected to the internet nowadays. However, this does mean screen time has somewhat plateaued.
In fact, some data has begun to show a gradual reversal.
But this is not consistent across the globe, with screen time still on the rise in some countries.
Here is the rate of change between average screen time in 2024 and 2025 for select nations, according to Comparitech:
| Country | Change in Screen Time (1 year) |
| Russia | ↑ 17 minutes |
| Turkey | ↑ 16 minutes |
| Switzerland | ↑ 14 minutes |
| Chile | ↑ 14 minutes |
| Japan | ↑ 13 minutes |
| South Africa | ↑ 13 minutes |
| Netherlands | ↑ 11 minutes |
| Poland | ↑ 10 minutes |
| Bulgaria | ↑ 9 minutes |
| Germany | ↑ 6 minutes |
| Belgium | ↑ 5 minutes |
| India | ↑ 4 minutes |
| New Zealand | ↑ 3 minutes |
| Argentina | ↑ 3 minutes |
| Portugal | ↑ 3 minutes |
| China | ↑ 2 minutes |
| Denmark | ↑ 2 minutes |
| Colombia | ↑ 1 minute |
| France | ↑ 1 minute |
| Philippines | ↓ 1 minute |
| Spain | ↓ 2 minutes |
| Austria | ↓ 3 minutes |
| Brazil | ↓ 4 minutes |
| Mexico | ↓ 4 minutes |
| Thailand | ↓ 4 minutes |
| Sweden | ↓ 6 minutes |
| Saudi Arabia | ↓ 7 minutes |
| Norway | ↓ 8 minutes |
| Australia | ↓ 9 minutes |
| Ireland | ↓ 11 minutes |
| Vietnam | ↓ 13 minutes |
| Canada | ↓ 13 minutes |
| Indonesia | ↓ 17 minutes |
| Romania | ↓ 19 minutes |
| USA | ↓ 23 minutes |
| UK | ↓ 26 minutes |
| Greece | ↓ 27 minutes |
| Egypt | ↓ 29 minutes |
Source: Comparitech
Average Screen Time By Region
Screen time varies significantly by region. According to recent records from 50+ nations, Kenya tops the charts for average screen time consumption per day.

Want to Spy on Your Competition?
Explore competitors’ website traffic stats, discover growth points, and expand your market share.
Here’s a closer look at 10 of the most active screen time users:
|
Country |
Screen time per week |
|
Kenya |
63 hours 34 mins |
|
Philippines |
54 hours |
|
Mexico |
53 hours 41 mins |
|
Brazil |
53 hours 30 mins |
|
South Africa |
52 hours 57 mins |
|
Chile |
52 hours 49 mins |
|
Nigeria |
49 hours 14 mins |
|
Colombia |
49 hours 08 mins |
|
Argentina |
47 hours 23 mins |
|
USA |
43 hours 23 mins |
|
Global Average |
33 hours 27 mins |
Brazil leads the way when it comes to penetration of mobile internet use, with 98% accessing the internet via smartphones.
The US (94.1%) and UK (93.2%) both trail the global average.
Here are the top 10 countries for prominence of mobile internet browsing as a part of screen time:
| Country | % of internet users who browse (non-exclusively) via mobile |
|
Brazil | 98.4% |
|
Indonesia | 98% |
|
South Africa | 98% |
|
Malaysia | 97.9% |
|
Philippines | 97.8% |
|
Saudi Arabia | 97.6% |
|
Serbia | 97.6% |
|
Turkey | 97.1% |
|
Thailand | 97% |
|
Vietnam | 96.9% |
| Global Average | 96% |
When it comes to screen time via desktop and laptop, Czechia is the most-connected. 85.2% of the online population access the internet via computers.
Here's the global top 10 for penetration of internet-connected screen time via desktops and laptops:
| Country | % of internet users who browse (non-exclusively) via desktop/laptop |
| Czechia | 85.2% |
| Russia | 81.4% |
| Canada | 80.6% |
| Portugal | 79.9% |
| Poland | 79% |
| Switzerland | 79% |
| Belgium | 78.3% |
| Austria | 77.8% |
| Germany | 77.8% |
| Croatia | 77.4% |
| Global average | 59.6% |
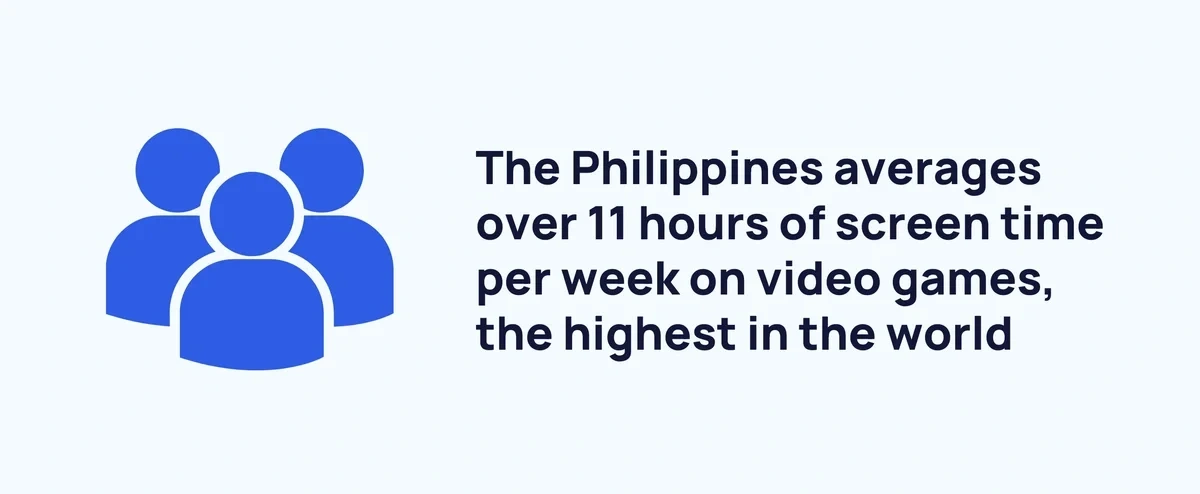
Types of screen time also vary by region. In terms of video games (including mobile games), the Philippines has the highest weekly screen time.
The United States is fifth for video game screen time, with an average of a little over 9 hours per week. China (5.12 hours) is in the bottom 5, in part due to state-sanctioned limits for minors.
Sources: DataReportal, Statista, South China Morning Post
Screen Time by Age
Age is an important factor in screen time.
98% of 2-year-olds view screens on a typical day.
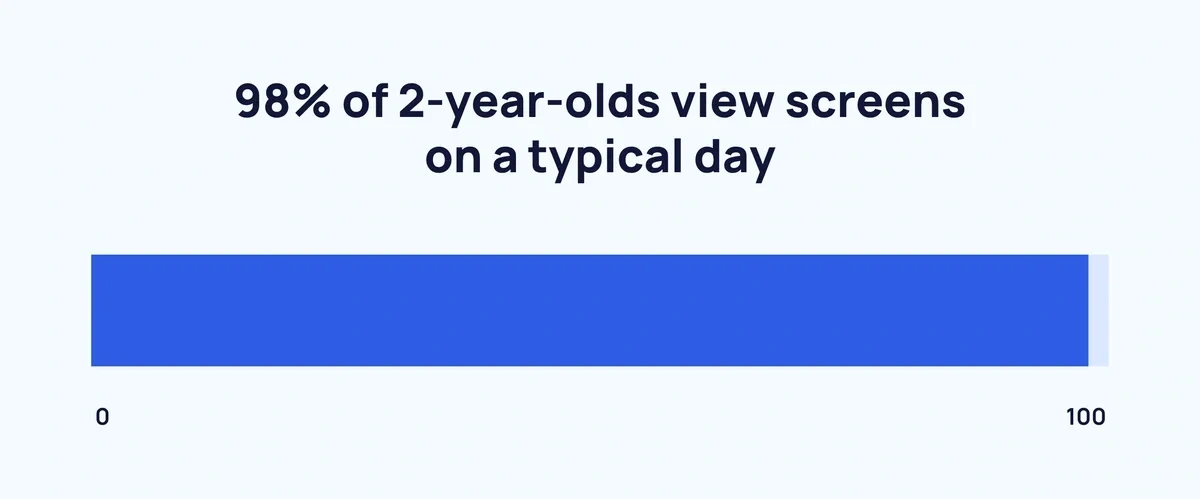
Among those children, the average daily screen time is 129 minutes, more than double the WHO recommended maximum (60 minutes).
Screen time tends to increase among older children. Statistics for teen screen time indicate an average of 7 hours and 22 minutes per day.
Sources: UCL
Impact of Screen Time
Research has linked screen time to stunted language development among young children.
In one study, 2-year-olds with the most regular screen users could say 53% of test words. Those with the lowest screen use could say 65%.
Moreover, those with the highest screen time were more than twice as likely to develop emotional and behavioral difficulties.
Adults feel the effects of high screen time as well. 45% of young US adults say screen time has negatively affected their attention spans.
Meanwhile, more than half (51%) of young adults say screen time has harmed their sleep habits.
As a result, 69% of Americans aged 18-29 want to spend less time looking at screens. Across the whole population, 53% want to cut down on screen time.
On a more positive note, tens of studies have indicated that there is no significant correlation between screen time and academic performance.
Americans also generally feel that screen time is a net positive in their lives. 37% say screen time is an overall positive compared to 23% that view it as a negative, with the remaining 36% considering it neutral.
Positivity around screen time in the US increases with age:
| Age | Very/somewhat positive stance on screen time | Neutral stance on screen time | Very/somewhat negative stance on screen time |
| 18-29 | 32% | 34% | 28% |
| 30-44 | 33% | 32% | 30% |
| 45-64 | 35% | 43% | 21% |
| 65+ | 51% | 33% | 12% |
However, a whole host of damaging side effects are linked with too much screen time, including:
- Sleep deprivation – Blue light interferes with melatonin production and disrupts the body’s circadian rhythm.
- Obesity – Data shows a strong association between screen time and obesity in children aged 5 to 17, most likely due to the sedentary nature of viewing a screen.
- Susceptibility to Type 2 Diabetes – In the UK, children aged between 9 and 10 who spend 3+ hours on the screen each day were more likely to show resistance to insulin
- Delayed learning – Young children who watch excessive amounts of TV can experience difficulties in picking up the language.
In the wider population, limiting social media use to a maximum of 30 minutes each day has been linked with reduced depression and improved well-being.
Sources: UCL, People, AIFS, Mayo Clinical Health System, The Journalist’s Resource, Active Health, Quartz, YouGov
Key Takeaways
Screens are inextricably linked with modern life. And the ways in which people spend their screen time are always evolving.
There is a growing dissatisfaction with the amount of screen time modern life involves, especially among younger generations. But whether that leads to any significant reversal remains to be seen.
If you enjoyed these stats, check out some of our other related content: Startling Social Media Addiction Statistics, Trending Social Media Startups, and Worldwide Daily Social Media Usage.
Stop Guessing, Start Growing 🚀
Use real-time topic data to create content that resonates and brings results.

Exploding Topics is owned by Semrush. Our mission is to provide accurate data and expert insights on emerging trends. Unless otherwise noted, this page’s content was written by either an employee or a paid contractor of Semrush Inc.
Share
Newsletter Signup
By clicking “Subscribe” you agree to Semrush Privacy Policy and consent to Semrush using your contact data for newsletter purposes
Written By


Fabio is a research associate at Exploding Topics. Since 2021, Fabio has researched, written, and edited articles for the Explo... Read more