


Get Advanced Insights on Any Topic
Discover Trends 12+ Months Before Everyone Else
How We Find Trends Before They Take Off
Exploding Topics’ advanced algorithm monitors millions of unstructured data points to spot trends early on.

Keyword Research
Performance Tracking
Competitor Intelligence
Fix Your Site’s SEO Issues in 30 Seconds
Find technical issues blocking search visibility. Get prioritized, actionable fixes in seconds.
Powered by data from
Latest Blog Posts
Featured Case Studies
See what's trending before everyone else
Each week, we'll send you our best Exploding Topics. Plus, expert insight and analysis.
Worldwide Daily Social Media Usage (New 2025 Data)

People are spending more time on their favorite social media platforms than ever before.
While the impact of social media usage is still debatable, it makes sense to track the amount of time people spend scrolling, posting, and commenting on these platforms.
In this regularly updated report, you’ll see exactly how much time people spend on social media per day.
Contents
- Top Highlights
- Daily Time Spent On Social Media
- Which Social Networks Do People Spend The Most Time On?
- Who Is Spending Time On Facebook?
- People Are Spending More Time On X (Formerly Twitter)
- Daily Time Spent On All Leisure And Sports Activities
- Daily Time Spent On All Media
- Time Spent On Mobile Gaming Apps
- Mental Health Effects From Spending Too Much Time On Social Media
Top Highlights
Here's our selection of key social media usage statistics:
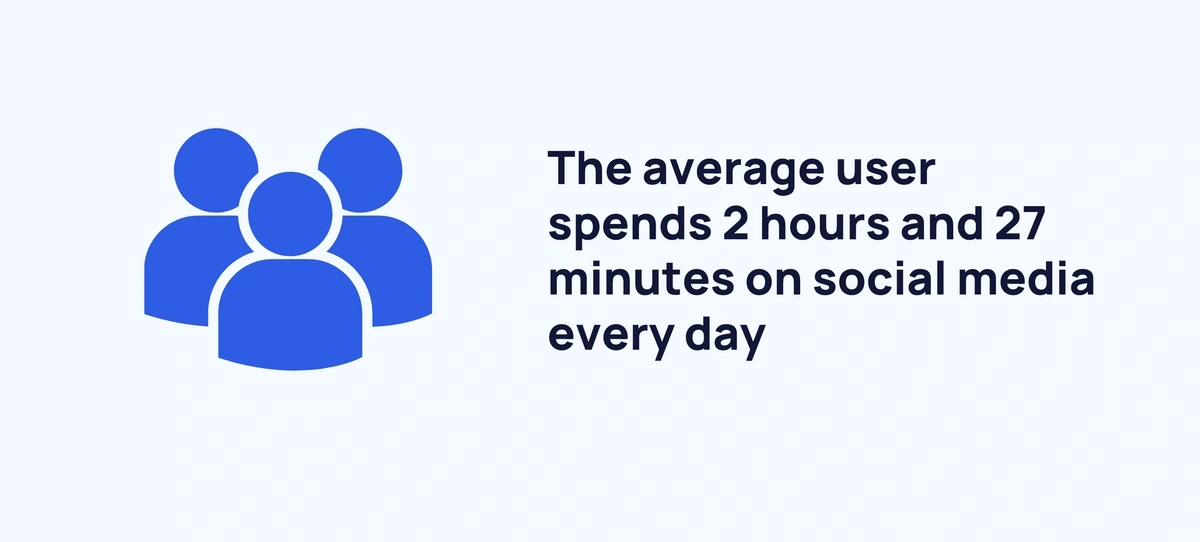
- The average person spends 2 hours and 24 minutes on social media every day.
- The average American checks their mobile device 159 times a day.
- Users will spend 4 trillion hours on social media this year.
- 46% of Americans say they watch more user-generated content on social media than they watch movies and television on streaming services.
- Americans spend 36% more time watching TV than they spend visiting social media sites.
- Americans spend an average of 31 minutes per day on Facebook.
- Users spent 20% less time on Facebook than they did five years ago.
- 93% of marketers use Facebook for advertising.
- Americans spend 4.2 hours per day on mobile gaming.
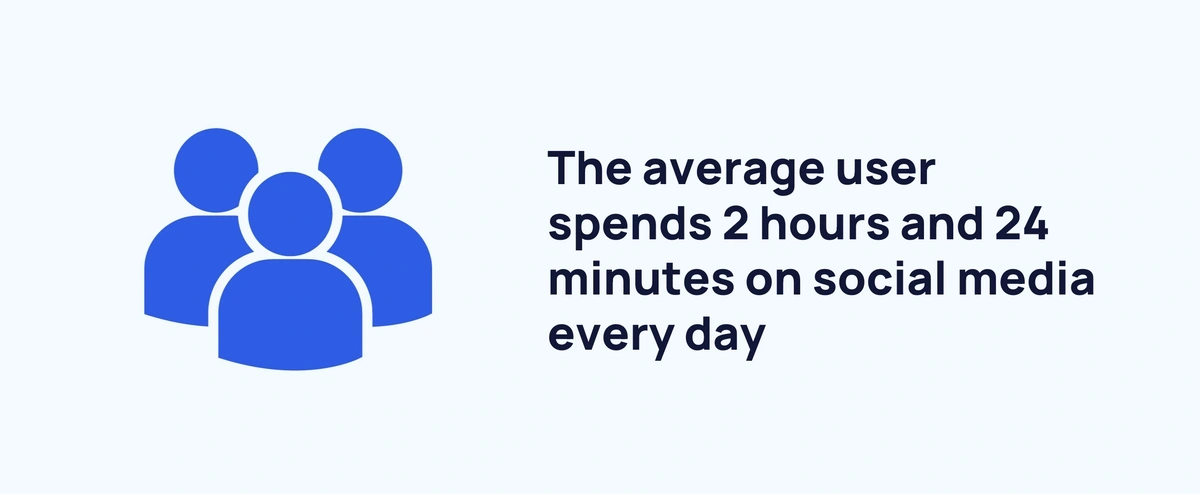
How Much Time Do People Spend on Social Media Per Day?
According to the latest available data, people spend an average of 2 hours and 24 minutes on social media every day.
Americans clocked in about 2 hours and 14 minutes per day, or 10 minutes less per day than the average global user. At just 105 minutes per day, Canadians spend less time on social media than Americans.
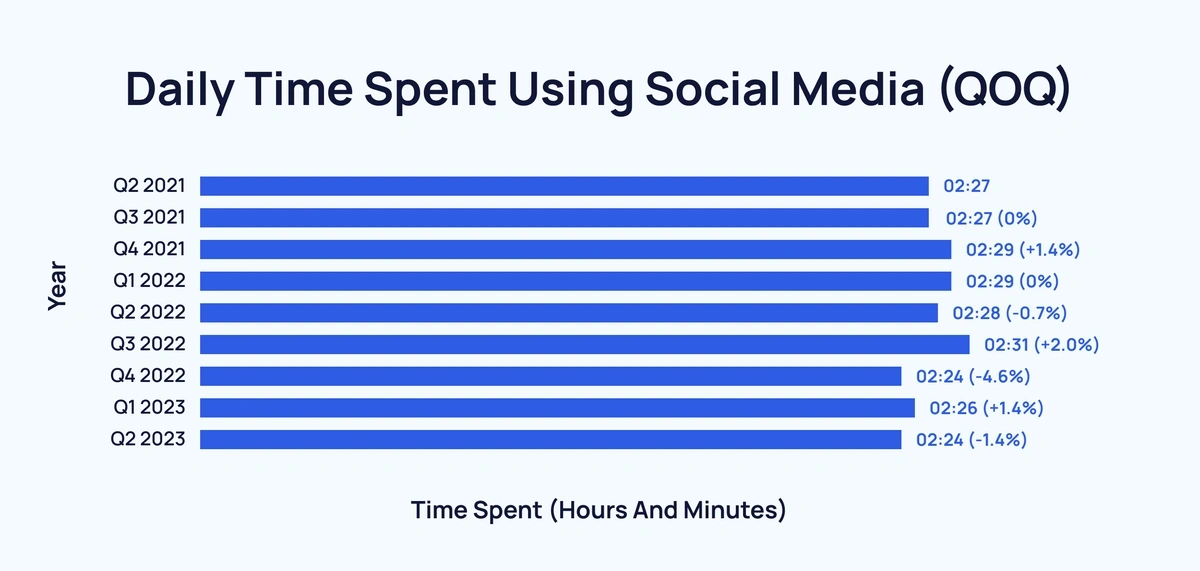
Time spent on social media has remained relatively steady quarter-over-quarter (Data Reportal)
Recent data shows that time spent using social media hasn't changed too drastically over the past couple of years.
In Q2 2021, the average person spent 2 hours and 27 minutes per day on social media. Over the next eight quarters, that figure has not changed by more than five minutes, peaking at 2 hours and 31 minutes and not dropping lower than 2 hours and 24 minutes.
The average American checks their mobile device 159 times a day (Psychology Today)
Americans check their mobile devices 9 times an hour per waking hour. Seven in ten people surveyed said they would feel depressed, panicked, or helpless if their mobile device was lost or stolen. A recent Psychology Today report stated that constant use of cell phones “satisfies your hungry neurons with positive feedback of constant connectivity”.
Global users are expected to spend 4 trillion hours on social media (Hootsuite)
With more than half (58.4%) of the world’s population now using social media, social network users are now estimated to spend more than 4 trillion hours on social media. That number is just one-third of the 12 trillion total hours the world spent online last year.
Nigerians spend almost 4 hours per day on social media (Data Reportal)
People living in Nigeria spend the most time on social media. The average Nigerian spends 3 hours and 49 minutes a day on social media - 70% more than the global average.
Want to Spy on Your Competition?
Explore competitors’ website traffic stats, discover growth points, and expand your market share.
At the other end of the spectrum, residents of Japan spend just 49 minutes per day on social media.
Almost half of Americans say they watch more user-generated content on social media than they watch movies and television on streaming services (Deloitte)
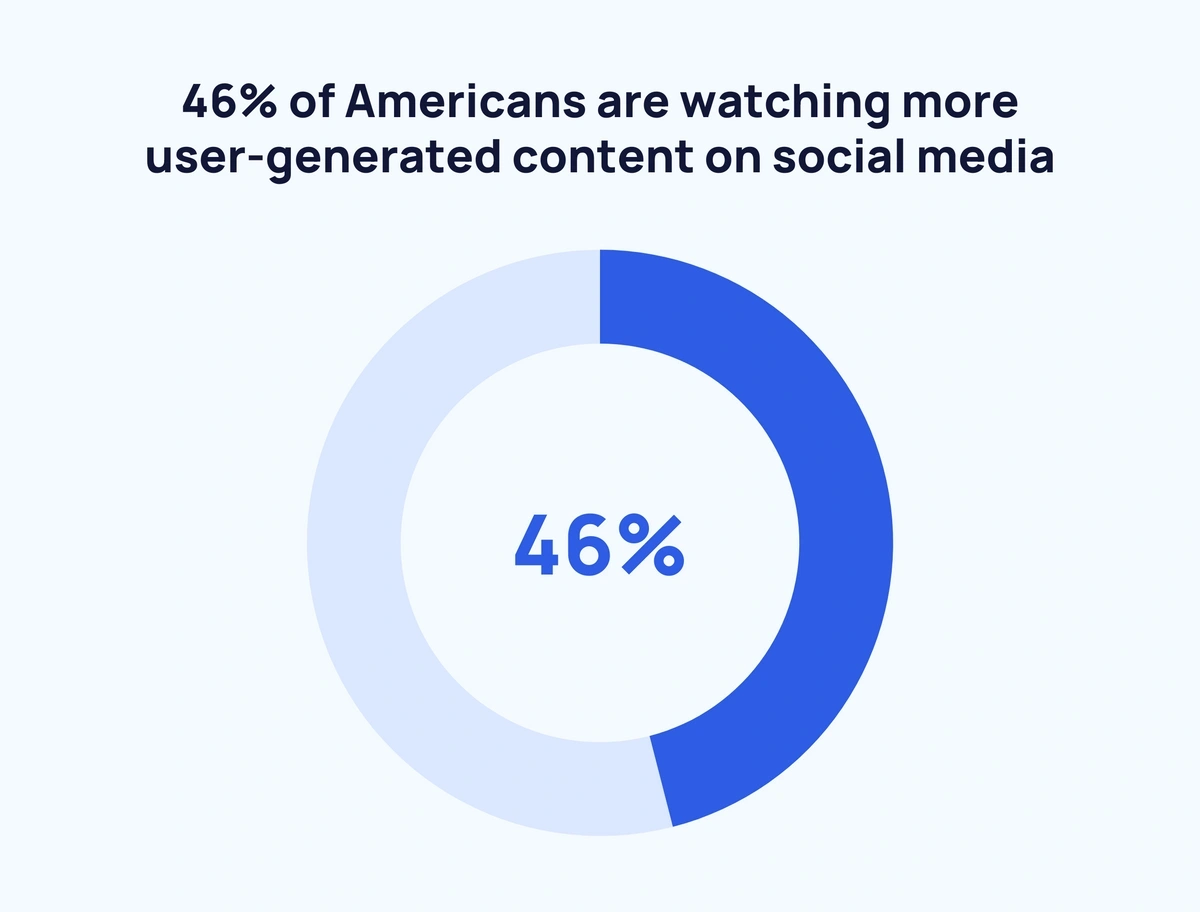
Nearly half (46%) of Americans are watching more user-generated content than they did in the last half of 2021. According to Deloitte’s annual “Digital Media Trends” survey, users prefer watching user-generated content because social media sites make it easier than streaming services to find content they like.
Social media takes up less than one-third of Americans’ total time spent online (Data Reportal)
While spending more than two hours a day posting, tweeting, and watching videos may seem like a lot of time, it is just a fraction of the total time users spend online every day. Americans spend more than 6 ½ hours a day online, which means social media makes up less than a third of their total online time.
Which Social Networks Do People Spend the Most Time On?
While Facebook is the oldest and biggest social media site in terms of users, it is no longer the most popular in terms of average daily time. People are spending less time on the social media giant as they visit other social media sites. These stats explore which social media sites Americans spend the most time on.
American social media users spend an average of 31 minutes per day on Facebook (emarketer.com)
When it comes to time spent on social media, Facebook content is no longer king. Adult users spent an average of 31 minutes per day on Facebook, placing it fourth behind YouTube, TikTok, and X. Americans now spend nearly 50% more time per day on YouTube (46 minutes per day) than they do on Facebook.
Social media users spent nearly 20% less time on Facebook than they did five years ago (Statista, Hootsuite)
Time spent on Facebook varies by study. According to a Statista study, Americans spent an average of 33 minutes on Facebook per day. This time has decreased by nearly 20% since 2017 when Americans spent 39 minutes on Facebook every day.
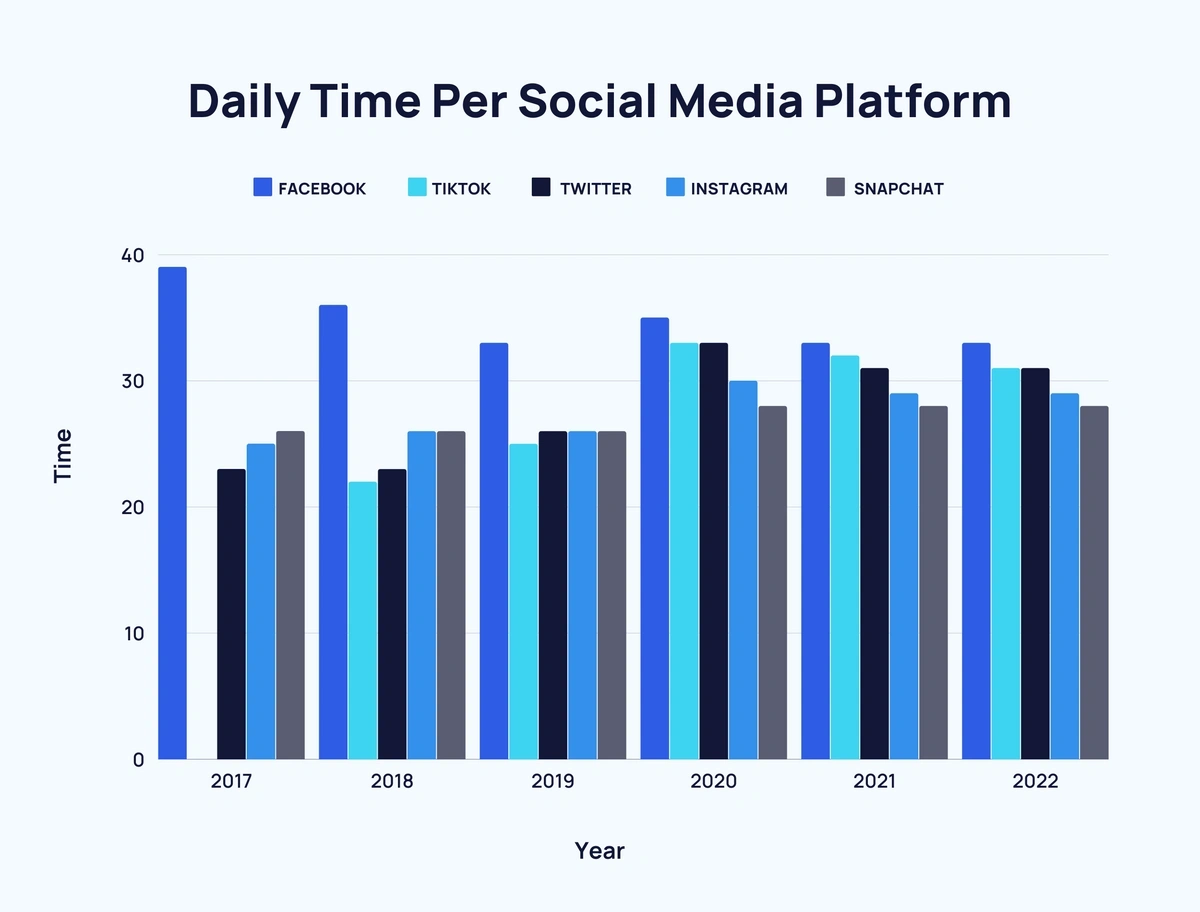
Daily Time Per Social Media Platform
| Platform |
2017 |
2018 |
2019 |
2020 |
2021 |
2022 |
|
39 |
36 |
33 |
35 |
33 |
33 | |
| TikTok |
22 |
25 |
33 |
32 |
31 | |
| X |
23 |
23 |
26 |
33 |
31 |
31 |
|
25 |
26 |
26 |
30 |
29 |
29 | |
| Snapchat |
26 |
26 |
26 |
28 |
28 |
28 |
No social media platform averages a longer visit duration than WhatsApp (Semrush)
On average, people spend 29 minutes and 16 seconds per visit on WhatsApp. YouTube (23 minutes and 19 seconds) is the only other social media platform to average over 20 minutes per visit duration.
Other than YouTube, many of the top social media platforms based on visit duration are messaging apps.
| Platform | Average Visit Duration | Pages Per Visit | Bounce Rate |
| 29 minutes 16 seconds | 3.58 | 65.03% | |
| YouTube | 23 minutes 19 seconds | 8.41 | 31.03% |
| Messenger | 17 minutes 39 seconds | 8.62 | 27.93% |
| Telegram | 17 minutes 37 seconds | 16.42 | 30.99% |
| Discord | 16 minutes 1 second | 7.61 | 40.55% |
| X (Twitter) | 15 minutes 25 seconds | 8.01 | 47.55% |
| Snapchat | 13 minutes 44 seconds | 6.77 | 36.91% |
| 13 minutes 43 seconds | 7.96 | 46.55% | |
| 12 minutes 10 seconds | 9.82 | 50.34% | |
| 12 minutes 1 second | 2.88 | 63.06% | |
| 11 minutes 51 seconds | 6.43 | 44.70% | |
| 10 minutes 40 seconds | 7.91 | 30.92% | |
| TikTok | 10 minutes 30 seconds | 7.31 | 53.12% |
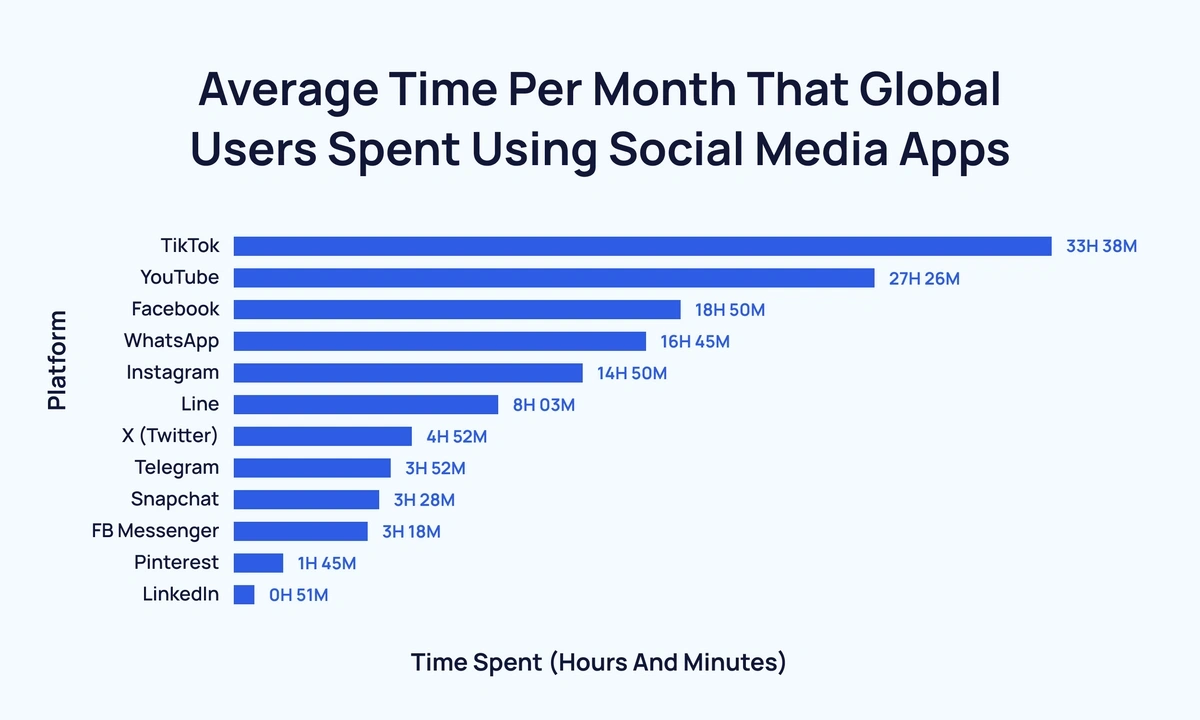
TikTok tops the charts for average time spent on per month (Data Reportal)
Build a winning strategy
Get a complete view of your competitors to anticipate trends and lead your market
On average, users spend 33 hours and 38 minutes on TikTok each month. That's over 6 hours more than second-placed YouTube. And almost 15 hours more than third-placed Facebook.
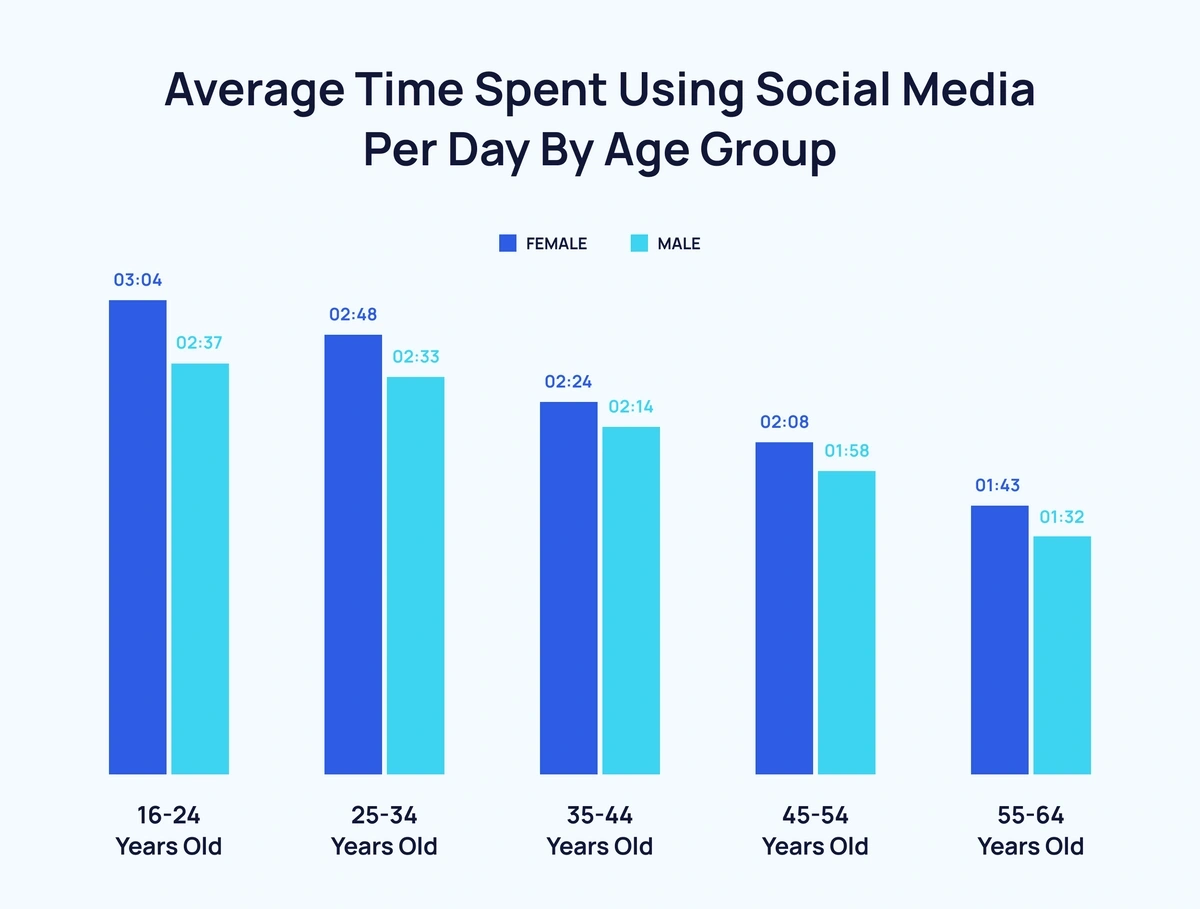
Females spend more time on social media than males across all age brackets (Data Reportal)
Females are more likely to spend time on social media than males.
There is a correlation between youth and time spent on social media with 16 to 24-year-old females spending on average 3 hours and 4 minutes per day. By comparison, 55 to 64-year-old men spend just 1 hour and 32 minutes per day on social media.
Americans spend an average of 46 minutes per day on YouTube (emarketer.com)
Adult users spent an average of 46 minutes per day on YouTube. This is nearly 20% more than on the second-favorite social media site, TikTok (38 minutes per day).
Who is Spending Time on Facebook?
While people might be spending less time on Facebook, the site attracts the most average daily users and average monthly users in the world. Just how many people are using Facebook? Explore these statistics to find out.
Almost 40% of the world's population uses Facebook (Statista), (Hootsuite)
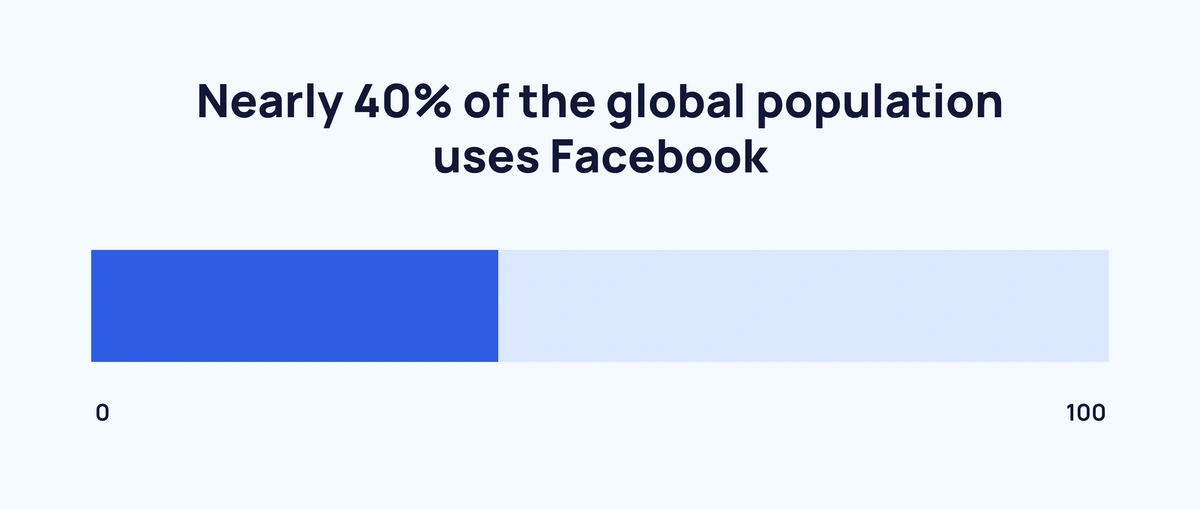
As of October 2021, Facebook reported having 2.91 billion users, or 36.8% of the world’s entire 7.9 billion population. The only other social media sites to surpass 2 billion users are YouTube (2.562 billion users) and WhatsApp (2 billion users). Instagram (1.478 billion), WeChat (1.283 billion), and TikTok (1 billion) all have one billion or more users.
In May 2025, Facebook received 10.5 billion visits. It remains the #3 site in the US and worldwide.
Facebook was the first social media platform to pass one billion users (CNN.com)
In 2012, Facebook became the first social media site to pass one billion users. That same year, the site experienced a growth rate of more than 30%, but that pace has slowed significantly since then. In fact, emarketer reports that Facebook saw a growth rate of less than one percent (0.8%) last year.
As many as 93% of marketers use Facebook for advertising (Statista)
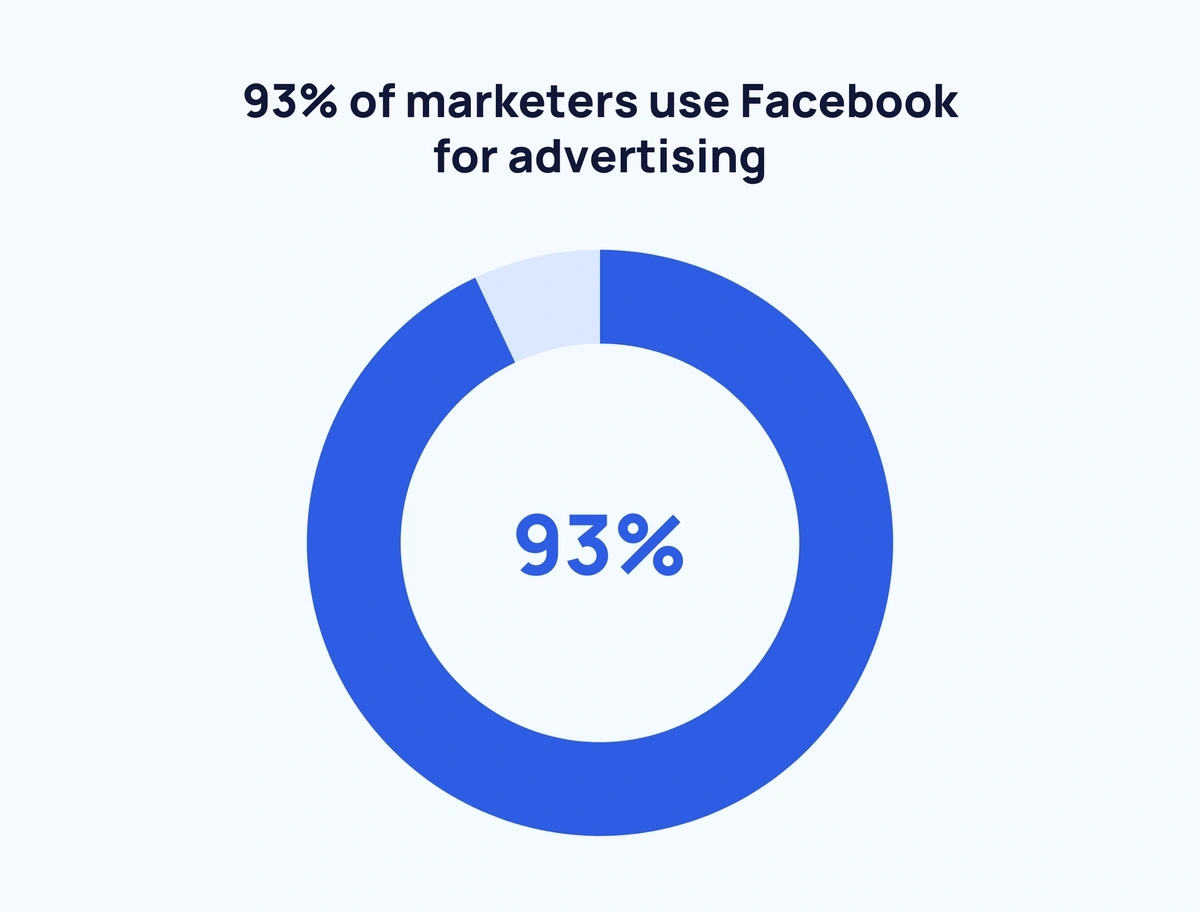
Facebook remains the most popular platform for advertisers with 93% of all social media marketers placing paid advertising on the site. 78% of respondents said they use Instagram to market their business.
Brands post an average of 5.87 times per week on Facebook (Rival IQ)
Across all industries, brands post an average of less than one post per day on Facebook. Media outlets are the clear exception, as they post approximately 12 posts per day (87.2 per week). Additional top categories are Sports Teams (21.4 per week), Nonprofits (7.6 posts per week), Higher Education (6.9 posts per week), Retail (6.8 posts per week), and Health and Beauty (6.2 posts per week).
People Are Spending More Time on X
While Facebook has seen a decrease in average time spent on the site, X users actually spend more time on the site than ever before. These stats explore just how people are using X in 2025.
Americans spend 35 minutes per day on X (Oberlo)
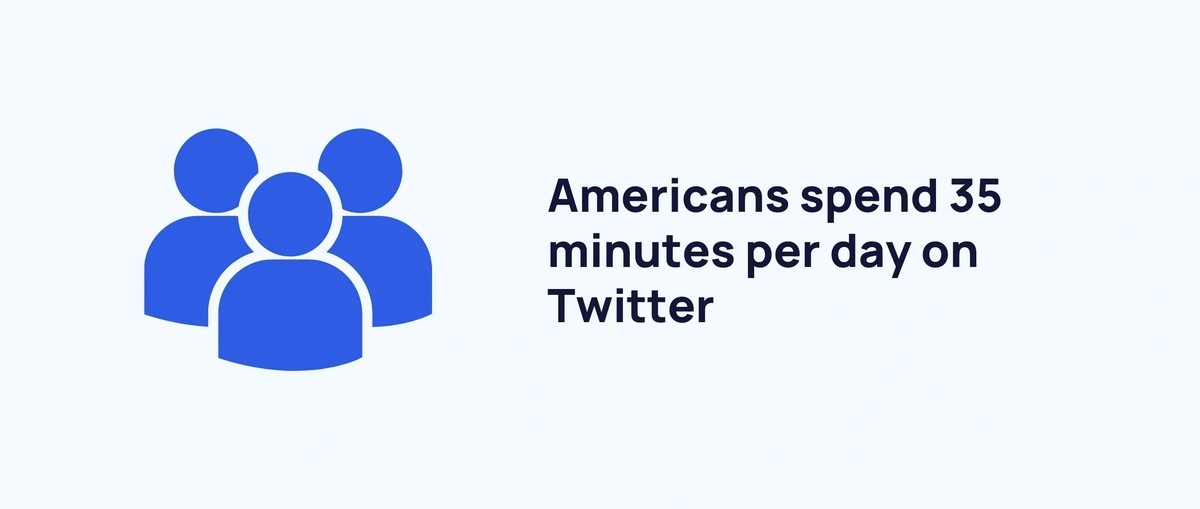
After TikTok (38 minutes per day), X is the second-most popular social media site, with respect to daily time spent on the site.
In 2025, X receives 4.5 billion visits from 851.7 million unique visitors. 44.41% of X users visit the site on desktop, while 55.59% visit the site on a mobile device (Semrush).
Less than half of X users post daily (Pew Research)
Half (49%) of X users are classified as “lurkers” meaning they post less than five times a week. 60% of lurkers fall in the 30-49 age range. The most active age group on X are people in the 18-29 demographic.
Daily Time Spent on all Leisure and Sports Activities
The Bureau of Labor Statistics (BLS), which tracks data about the labor market, also measures the time Americans spend on leisure activities. Although the agency doesn’t measure social media specifically, it does track time spent on “playing games and computer use”. See how Americans are spending their leisure time below.
Americans spend 5x more watching television than they do on games and computer use (Time Use Survey)
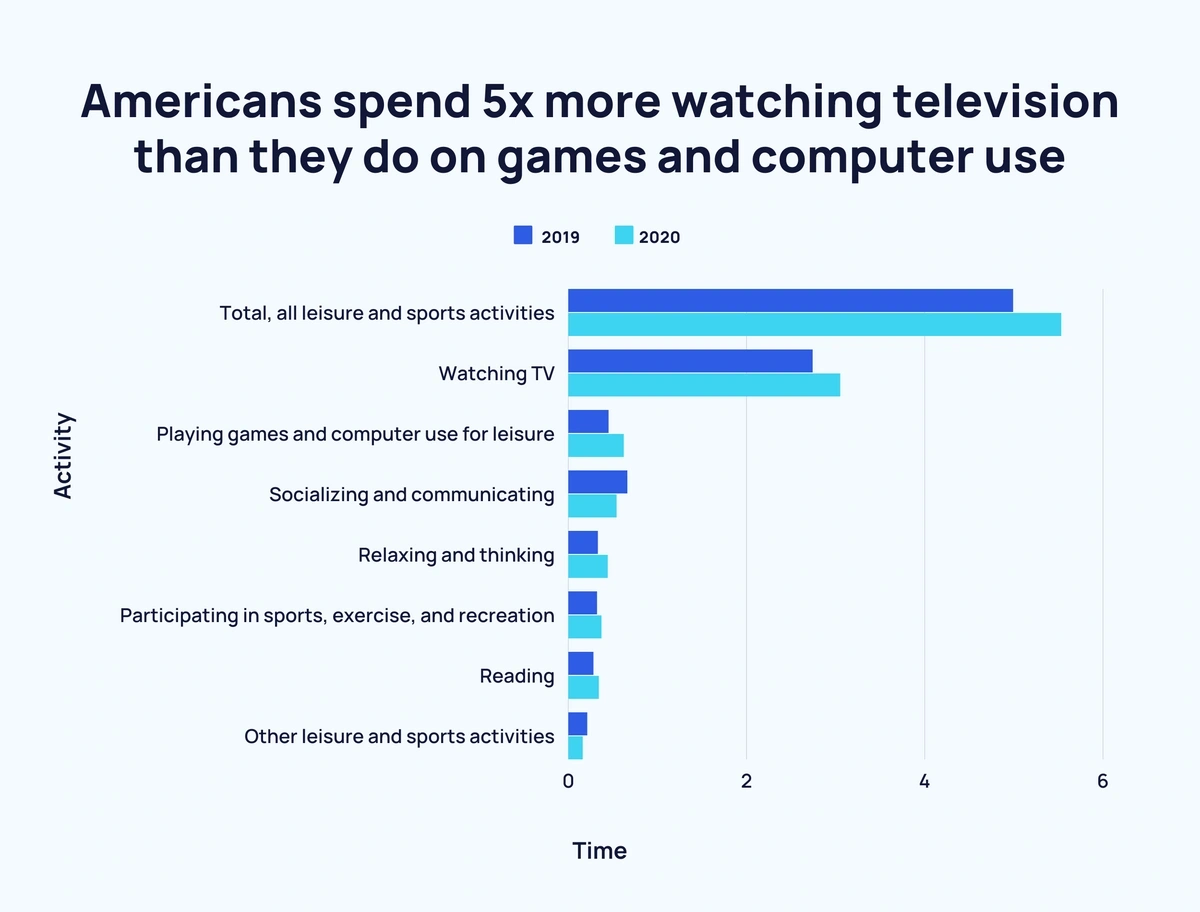
In the leisure category, television watching remained the most popular activity, with Americans watching television for almost 3.05 hours per day. They watched TV nearly five times longer than they spent on the next most popular activity, socializing and communicating. The time spent on socializing decreased by 18% in 2020.
| Activity |
2019 |
2020 |
% diff |
| Total, all leisure and sports activities |
4.99 |
5.53 |
10.82 |
| Watching TV |
2.74 |
3.05 |
11.31 |
| Playing games and computer use for leisure |
0.45 |
0.62 |
37.78 |
| Socializing and communicating |
0.66 |
0.54 |
-18.18 |
| Relaxing and thinking |
0.33 |
0.44 |
33.33 |
| Participating in sports, exercise, and recreation |
0.32 |
0.37 |
15.63 |
| Reading |
0.28 |
0.34 |
21.43 |
| Other leisure and sports activities |
0.21 |
0.16 |
-23.81 |
The BLS does not track statistics specific to social media usage.
Daily Time Spent on All Media
While Americans are spending more time on social media, they are increasing their time on other media as well. See how social media compares to watching TV, listening to streaming music, playing video games, and other digital media activities.
Americans spend 36% more time watching TV than they do on social media sites (Data Reportal)
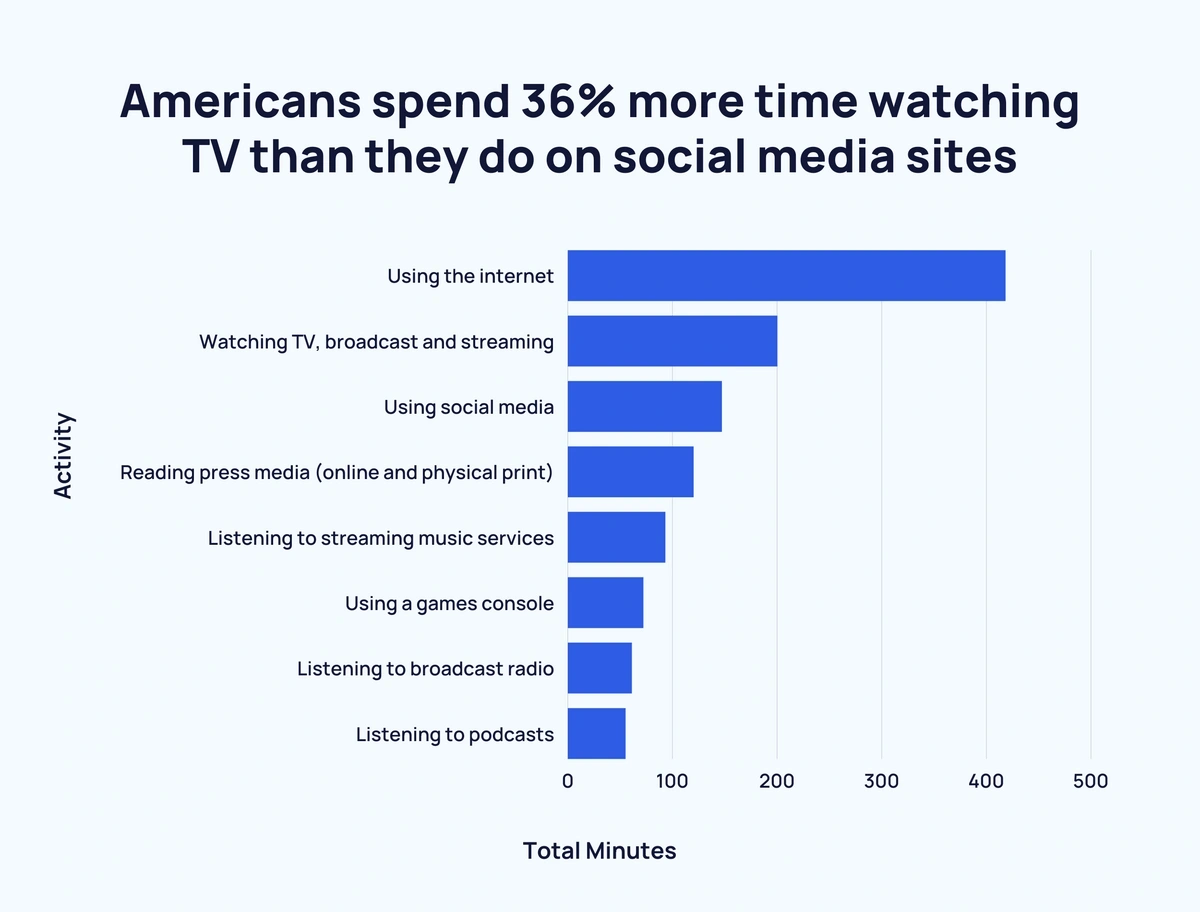
Americans spend approximately 3 hours and 20 minutes watching broadcast TV and streaming every day, or 36% more time than they spend on social media.
| Activity |
Hours |
Minutes |
Total Minutes | +/- social media |
| Using the internet |
6 |
58 |
418 | |
| Watching TV, broadcast, and streaming |
3 |
20 |
200 |
36.05% |
| Using social media |
2 |
27 |
147 |
0.00% |
| Reading press media (online and physical print) |
2 |
0 |
120 |
-18.37% |
| Listening to streaming music services |
1 |
33 |
93 |
-36.73% |
| Using a games console |
1 |
12 |
72 |
-51.02% |
| Listening to broadcast radio |
1 |
1 |
61 |
-58.50% |
| Listening to podcasts |
0 |
55 |
55 |
-62.59% |
Nearly nine in ten American adults go online daily (Pew Research)
Americans love the internet, with 85% reporting they go online daily. One in three Americans say they go online “almost constantly”, and half say they go online a couple of times a day. Only 7% of Americans say they don’t go online at all.
Multitasking is making the American day 50% “longer” (Activate)
The average American now spends approximately 8 hours a day doing two things at once, leading to an “average day” of 32 hours. Messaging and social media account for 1.29 hours per day, while video takes up 5.28 hours.
Time Spent on Mobile Gaming Apps
On average, Americans spend 4.2 hours per day on mobile gaming (Venture Beat)

Americans are spending 4.2 hours per day on mobile gaming, which is just less than the global average of 4.8 hours per day. Globally, 68% of all consumer spending in mobile apps was attributed to mobile gamers.
19% of mobile gamers say they play video games to play and socialize with people they already know (Activate)
When it comes to social gaming, 19% of mobile gamers say they play for social purposes. This is nearly twice as high as non-mobile gamers. Mobile gamers also make up nearly 56% of all consumer video game revenue.
Nearly half of all US gamers say they spend less time on other leisure activities and spend more time playing video games (Deloitte)
Americans aren’t the only ones playing more video games. More than half of respondents in the UK (55%) and nearly half in Brazil (45%) and Japan (44%) are bypassing other leisure activities to spend more time playing video games.
Mental Health Effects of Spending Too Much Time on Social Media
Spending more time on social media is leading to more mental health issues such as anxiety and depression, as well as social issues such as cyberbullying and online harassment. Below are some statistics about the mental health issues caused by too much time on social media.
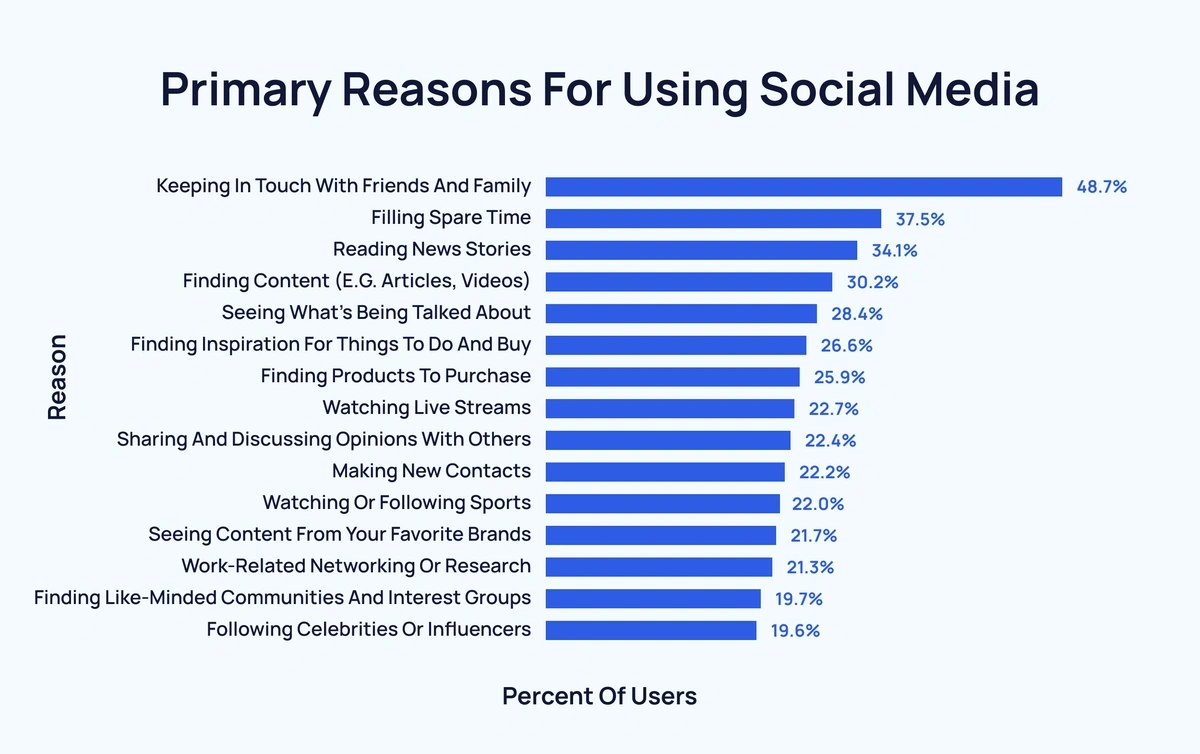
Keeping in touch with friends and family is the main reason people use social media (Data Reportal)
For most people, the primary reason for using social media is to keep in touch with friends and family (48.7%).
As many as 1 in 10 Americans may be “addicted” to social media (Addiction Center)
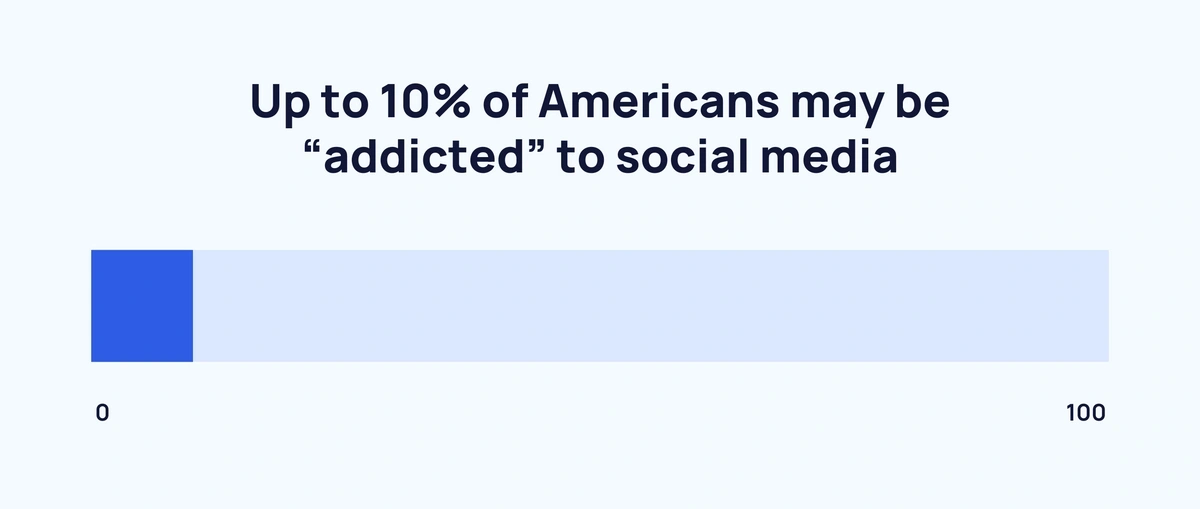
Depending on the definition of “addicted”, 5 and 10% of Americans could be addicted to social media. Social media addiction is defined by the Addition Center as “being overly concerned about social media, driven by an uncontrollable urge to log on to or use social media, and devoting so much time and effort to social media that it impairs other important life areas”. Another study reports that more than 210 million people around the world are over-dependent on social media.
Spending more than three hours per day on social media increases the risk of mental health problems in adolescents (JAMA Network)
A 2019 study found that adolescents who spend more than three hours per day on social media are more likely to “internalize problems,” which could lead to anxiety and depression. One in four people said they felt social media has a negative effect on people their age and also that social media could be a cause of increased rumor spreading, peer pressure, unrealistic expectations, and other related issues.
3 in 4 people who have suffered from cyberbullying say their experience happened on social media (Pew Research)
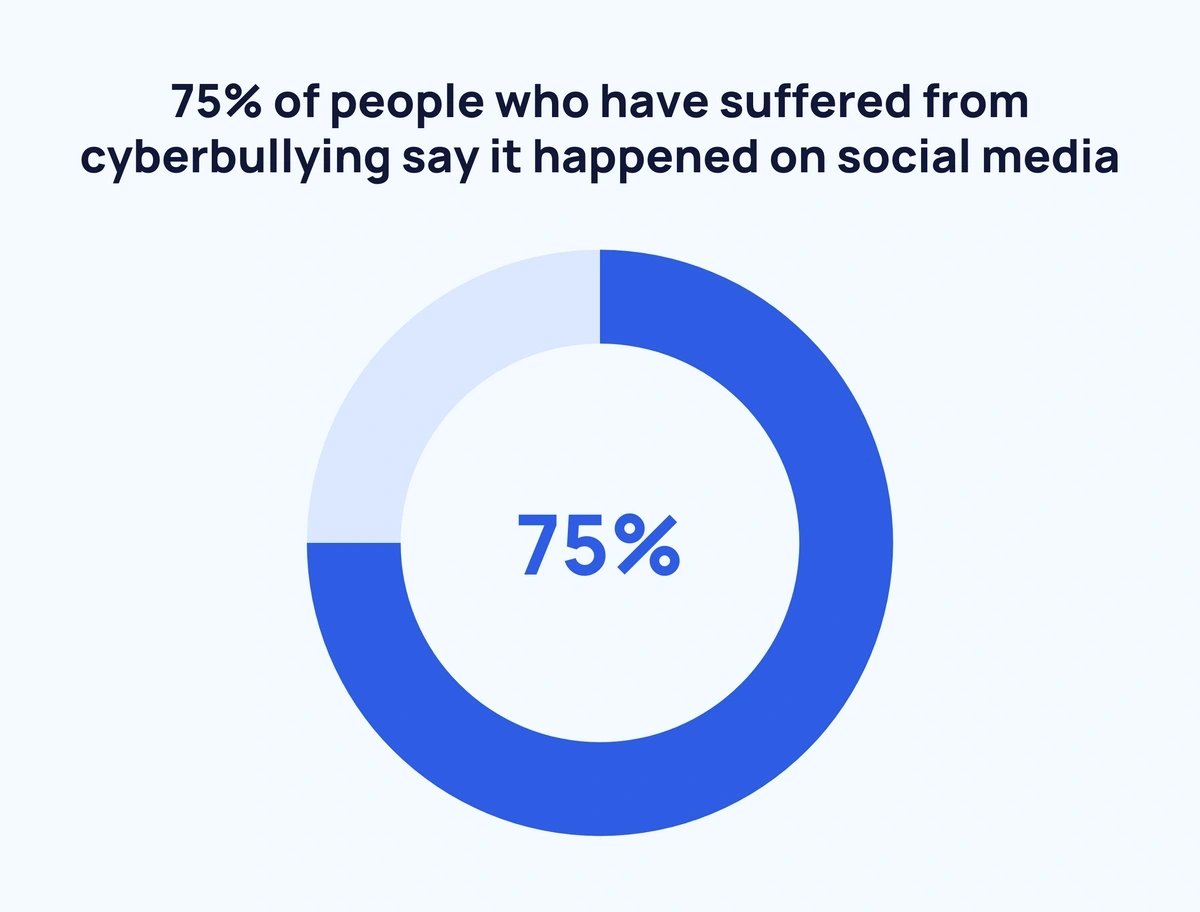
Some 41% of Americans have been a target of online abuse or cyberbullying, with 25% saying that they experienced “severe harassment”. This number has increased greatly since 2014 when just 15% of users reported being subject to severe harassment. Three out of four people reporting harassment said their most recent experience happened through social media channels. 20% of adults say they have been harassed for their political views.
Wrap Up
As you can see from the statistics, people are spending more time on social media than ever before.
Although they might be splitting their time across an increasing number of different platforms, their overall daily use of social media is growing. People are also increasing their time spent on other social activities, both online and off. In particular, people are also watching more TV and streaming on social media sites and on traditional devices.
The growth in time spent on social media has led to new opportunities for digital marketers, but it is also causing concern over social issues. In particular, youth heavily engaged in social media could be at higher risk for mental health issues.
If you enjoyed reading these stats, check out our related pages 14 Important Social Media Trends and 20 Trending Social Media Startups.
Stop Guessing, Start Growing 🚀
Use real-time topic data to create content that resonates and brings results.

Exploding Topics is owned by Semrush. Our mission is to provide accurate data and expert insights on emerging trends. Unless otherwise noted, this page’s content was written by either an employee or a paid contractor of Semrush Inc.
Share
Newsletter Signup
By clicking “Subscribe” you agree to Semrush Privacy Policy and consent to Semrush using your contact data for newsletter purposes
Written By


Josh is the Co-Founder and CTO of Exploding Topics. Josh has led Exploding Topics product development from the first line of co... Read more