Get Advanced Insights on Any Topic
Discover Trends 12+ Months Before Everyone Else
How We Find Trends Before They Take Off
Exploding Topics’ advanced algorithm monitors millions of unstructured data points to spot trends early on.
Features
Keyword Research
Performance Tracking
Competitor Intelligence
Fix Your Site’s SEO Issues in 30 Seconds
Find technical issues blocking search visibility. Get prioritized, actionable fixes in seconds.
Powered by data from
Smart Home Market Value & Industry Growth (2025-2032)
Smart homes are on the rise. And the global adoption of smart connected devices is increasing at a rapid rate.
There are several reasons behind the increased adoption – from new technology to affordable prices, and an abundance of user benefits.
Below we’ll dive into these smart home market stats:
- Smart Home Industry Highlights
- Smart Home Market Size
- Smart Home Market Growth Projections
- Growth Drivers In The Smart Home Space
- Key Players In The Smart Home Market
- Smart Home Market Geographic Breakdown
- Smart Home Industry Growth By Segment
Smart Home Industry Highlights
- The global smart home market is valued at almost $150 billion
- As of 2032, the smart home market is projected to surpass $630 billion
- The global smart home market is growing at a CAGR of 22.9%
- As a region, the Far East and China have the largest smart home market share
- Home security’s market share is set to increase by 6% in a seven-year period
Smart Home Market Size
According to the latest data, the global smart home market is worth an estimated $149.43 billion.
Improving technology, more affordable prices, and a desire for a connected home are some key reasons behind the market’s rapid growth.
Data shows that smart home consumer spending has grown from $86 billion in 2020 to approximately $150 billion in 2025.
And according to Strategy Analytics, market spending is likely to increase to $173 billion worldwide in 2025 – around double 2020’s figure.
Sources: Fortune Business Insights, Strategy Analytics
Smart Home Market Growth Projections
The worldwide smart home market is valued at $149.43 billion in 2025.
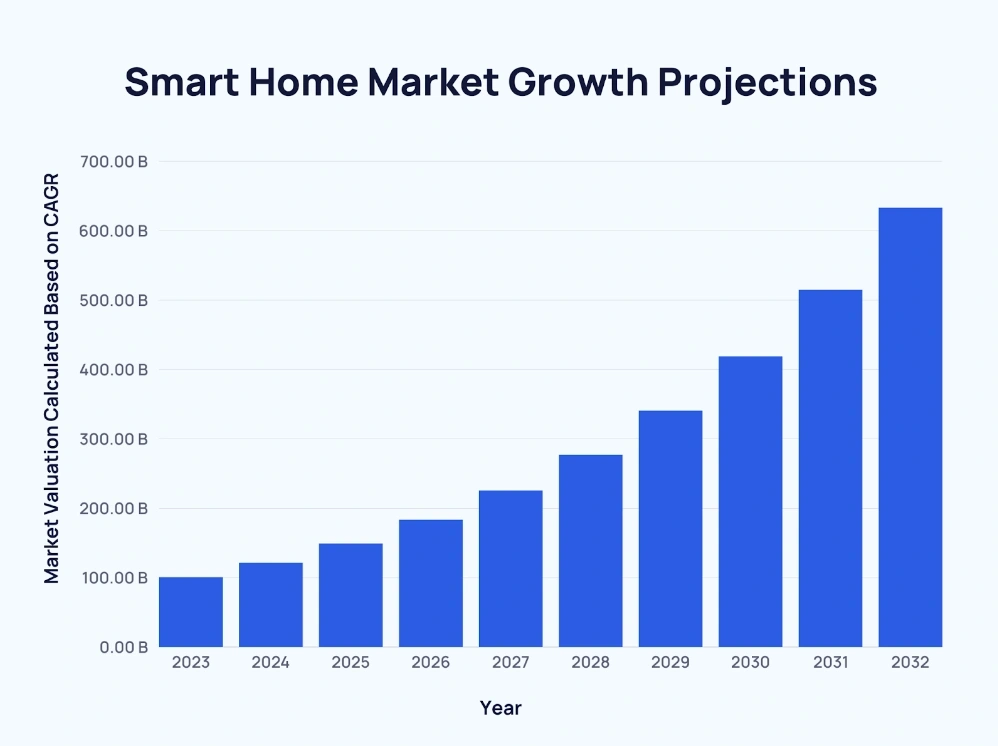
The smart home space is expected to climb to $633.2 billion by 2032 at a compound annual growth rate (CAGR) of 22.9%.
Here’s a look at predicted smart home market growth over the next decade:
|
Year |
Market Valuation Calculated Based on CAGR |
|
2023 |
$101.07 billion |
|
2024 |
$121.59 billion |
|
2025 |
$149.43 billion |
|
2026 |
$183.65 billion |
|
2027 |
$225.71 billion |
|
2028 |
$277.4 billion |
|
2029 |
$340.92 billion |
|
2030 |
$419 billion |
|
2031 |
$514.95 billion |
|
2032 |
$633.2 billion |
Source: FutureMarketInsights
Growth Drivers in the Smart Home Space
Advancements in security technology are a primary driver within the smart home market.
Additionally, the increase of Internet of Things (IoT) devices has lent itself to greater connectivity within the home. And in recent years, smart devices have become more affordable, accelerating adoption further.
Refinements in safety, interconnectivity, and customization as well as less prohibitive prices are likely to continue to drive the market to new heights.
Source: FutureMarketInsights
Key Players in the Smart Home Market
- Samsung (South Korea)
- Huawei (China)
- Qualcomm (US)
- Alphabet (US)
- LG Electronics (South Korea)
- Microsoft (US)
- Beijing Didi Technology (China)
- Xiaomi (China)
- eBay (US)
- Midea (China)
- Intel (US)
- ZTE (China)
- Gree Electric Appliances (China)
- Snap Inc. (US)
- Alibaba (China)
- Amazon (US)
- Philipps (US)
- Google (US)
- Apple (US)
- IKEA (Sweden)
- Siemens (Germany)
- Bosch (Germany)
- Belkin (US)
Source: iplytics, The Buddy Company
Smart Home Market Geographic Breakdown
Broken down by region, the Far East and China have the largest current smart home market share. The region ships around 521.8 million smart home units – almost twice as many as Europe (283.1 million) and North America (250 million).
Here’s a closer look at the data:
| Year | The Far East and China | Europe | North America | Latin America | Rest of World |
| 2020 | 140.5 million | 81.2 million | 75.7 million | 9.5 million | 42.2 million |
| 2021* | 220.9 million | 119.6 million | 118.6 million | 14.3 million | 63.7 million |
| 2022* | 289.8 million | 165.6 million | 151.6 million | 21.3 million | 89.1 million |
| 2023* | 375 million | 219.6 million | 192.5 million | 31 million | 121.8 million |
| 2024* | 521.8 million | 283.1 million | 250 million | 45 million | 175.8 million |
| 2025* | 726.7 million | 384.9 million | 329.2 million | 68.8 million | 260.9 million |
Source: Juniper Research
Smart Home Industry Growth by Segment
Consumer spending on smart home-related devices is on the rise.
Here is a more detailed look at the figures:
| Year | Consumer Spending |
| 2019 | $95 billion |
| 2020 | $86 billion |
| 2021* | $123 billion |
| 2022* | $134 billion |
| 2023* | $147 billion |
| 2024* | $159 billion |
| 2025* | $173 billion |
Broken down by segment, video entertainment holds the single largest share of the market.
Although, this figure is dropping:
| Year | Video Entertainment | Home Security | Smart Speaker | Others |
| 2018 | 48.2% | 15.2% | 15.5% | 21.1% |
| 2019 | 41.7% | 19.2% | 16.5% | 22.5% |
| 2020 | 37% | 20.5% | 16.3% | 26.2% |
| 2023* | 29.9% | 22.1% | 14.3% | 33.7% |
| 2024* | 31.3% | 21.1% | 14.1% | 33.5% |
| 2025* | 27.6% | 21.2% | 14.4% | 36.9% |
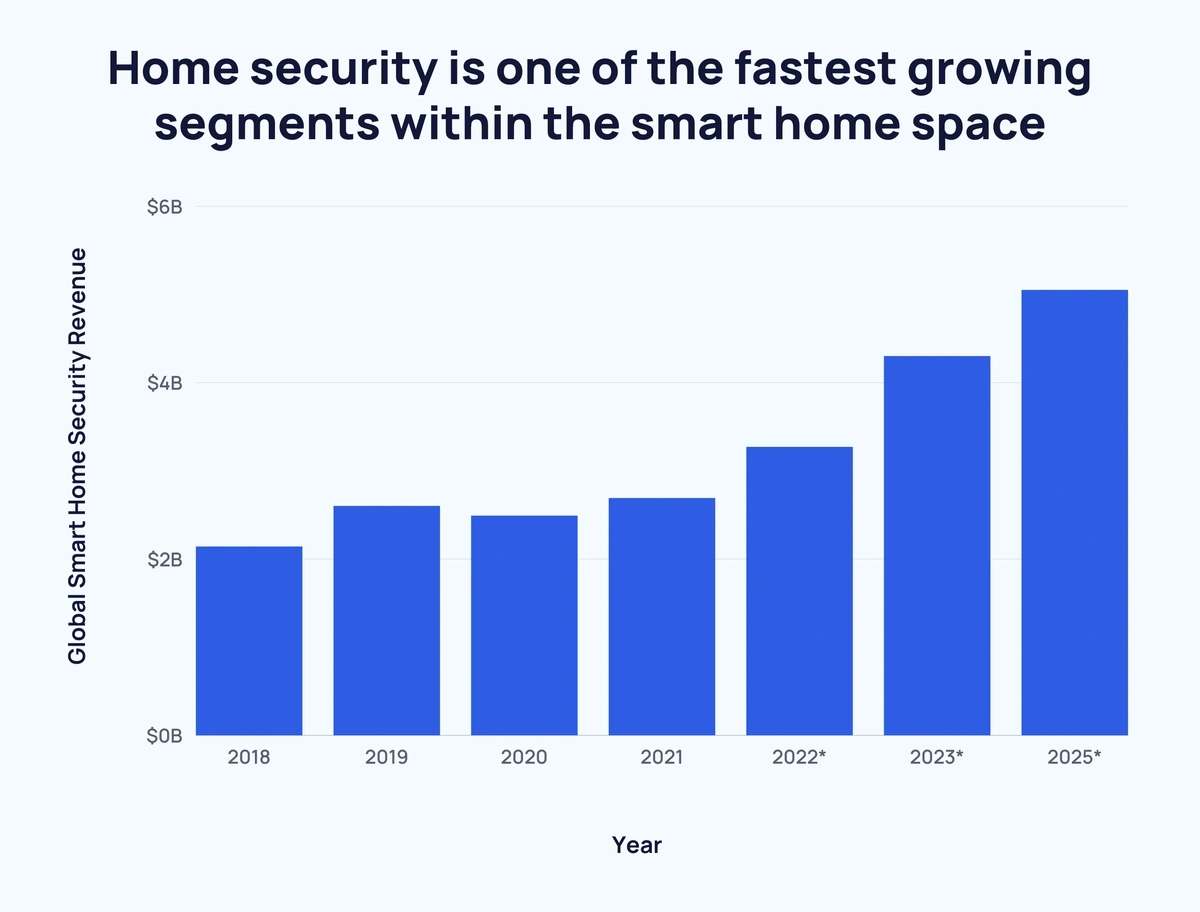
Home security is one of the fastest-growing segments within the smart home space.
Here are the numbers:
| Year | Global Smart Home Security Revenue |
| 2018 | $2.14 billion |
| 2019 | $2.6 billion |
| 2020 | $2.49 billion |
| 2021 | $2.69 billion |
| 2022* | $3.27 billion |
| 2023* | $4.3 billion |
| 2025* | $5.05 billion |
*Predicted figures
While digital voice assistants were predicted to double from around 4.2 billion in 2020 to 8.4 billion in 2024.
Sources: Strategy Analytics, BRC, Juniper Research
Key Takeaways
The smart home market is growing quickly in value year over year.
And an increased adoption of smart home products only facilitates the ability to acquire a truly connected home, further elevating the market.
For more content related to smart homes, take a look at our Smart Home Statistics post.
Stop Guessing, Start Growing 🚀
Use real-time topic data to create content that resonates and brings results.
Exploding Topics is owned by Semrush. Our mission is to provide accurate data and expert insights on emerging trends. Unless otherwise noted, this page’s content was written by either an employee or a paid contractor of Semrush Inc.
Share
Newsletter Signup
By clicking “Subscribe” you agree to Semrush Privacy Policy and consent to Semrush using your contact data for newsletter purposes
Written By


Fabio is a research associate at Exploding Topics. Since 2021, Fabio has researched, written, and edited articles for the Explo... Read more


