


Get Advanced Insights on Any Topic
Discover Trends 12+ Months Before Everyone Else
How We Find Trends Before They Take Off
Exploding Topics’ advanced algorithm monitors millions of unstructured data points to spot trends early on.

Keyword Research
Performance Tracking
Competitor Intelligence
Fix Your Site’s SEO Issues in 30 Seconds
Find technical issues blocking search visibility. Get prioritized, actionable fixes in seconds.
Powered by data from
Latest Blog Posts
Featured Case Studies
See what's trending before everyone else
Each week, we'll send you our best Exploding Topics. Plus, expert insight and analysis.
50+ Smart Home Statistics (New 2024 Data)

This is a list of up-to-date smart home statistics.
Largely thanks to advancements in Internet of Things (IoT) technology, demand for smart home products is at an all-time high.
But how big is the smart home industry? And what do consumers think about smart homes?
Our up-to-date smart home stats provide insights into the current state of smart homes.
Contents
- Top Smart Home Stats - Editor’s Picks
- Smart Home Market Stats
- Smart Home Demand Stats
- Smart Home Benefit Stats
- Smart Home Concern Stats
- Smart Home Device Stats
Top Smart Home Stats - Editor’s Picks
- The global smart home market is expected to exceed $170 billion by 2025
- 78% of potential home buyers would pay extra for a smart home
- Approximately 75% of smart home consumers are younger than 55
- 97% of smart home device owners are at least somewhat satisfied with their devices
- Almost two-thirds of smart home consumers are concerned about their data security
- Smart homes in the U.S. have an average of 8 smart devices
Smart Home Market Stats
The market for smart homes and smart home technology has steadily increased since 2020. The next set of stats outline the current state of the smart home market.
Global consumer spending on smart home systems is expected to exceed $170 billion by 2025 (Strategy Analytics)
Consumer spending on smart home technology is steadily increasing. In 2022, it’s estimated that global consumers will have spent $135 billion on smart home systems. By 2025, that number is estimated to rise to $170 billion (that’s a 26% growth rate.)
Around 3 in 5 US consumers are projected to adopt smart home technology by 2025 (Statista)
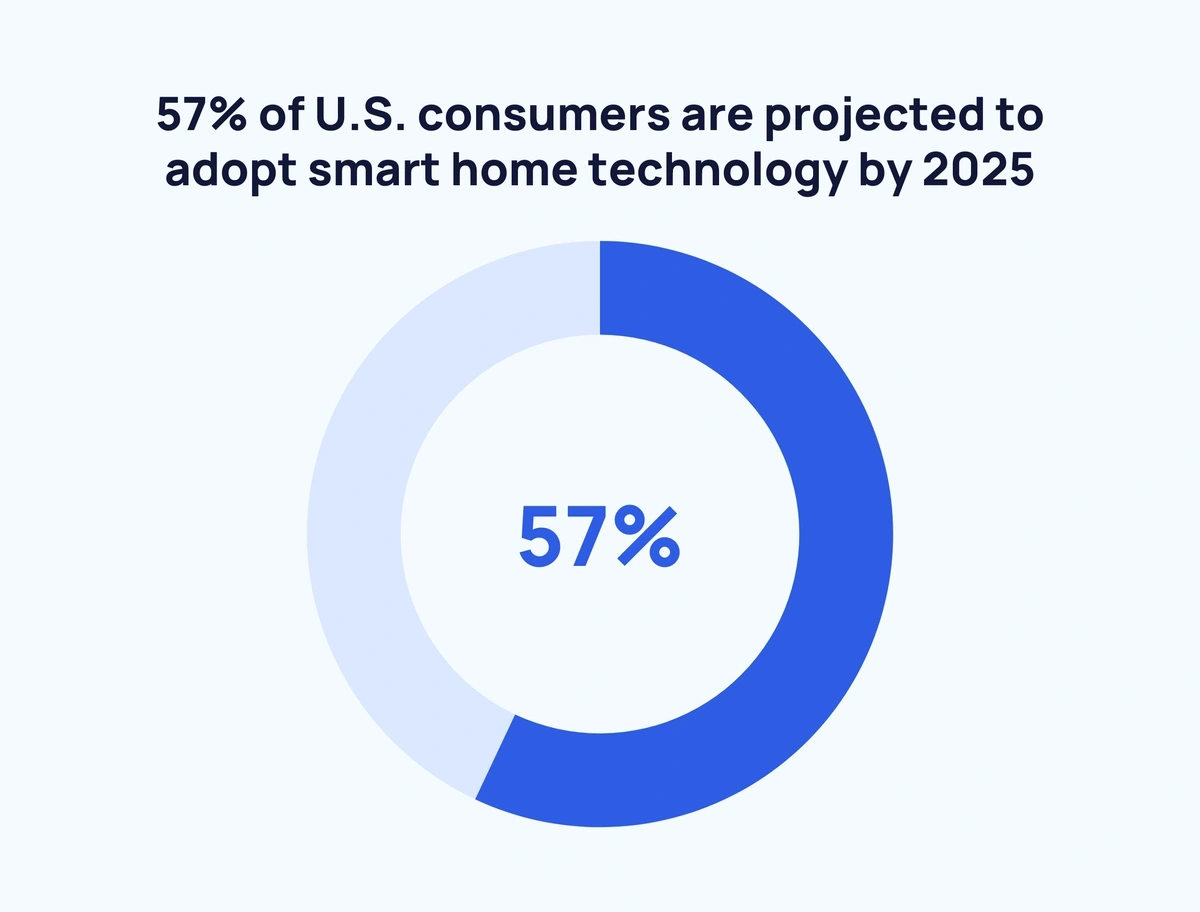
Over half of US consumers are projected to adopt smart home technology by 2025. Compare that to 2021, where only approximately 40% of US households were using smart home technology. That amounts to a 42% growth in smart home adoption rate in just four years.
North America accounts for 40% of all smart home consumer spending (Strategy Analytics)
North America is the largest market for smart homes, followed by Asia-Pacific (29%) and Western Europe (18%). Smart home security systems, in particular, are driving growth in the U.S. market.
Asia-Pacific will become the largest smart home market by 2023 (Strategy Analytics)
The Asia-Pacific region is a massively growing market for smart homes. Given the approximately one billion homes in the Asia-Pacific region and increasing adoption by consumers, Asia-Pacific is predicted to be the largest smart home market by 2030.
Around 3 in 4 smart home users are under 55 years old (Smart Energy Consumer Collaborative)
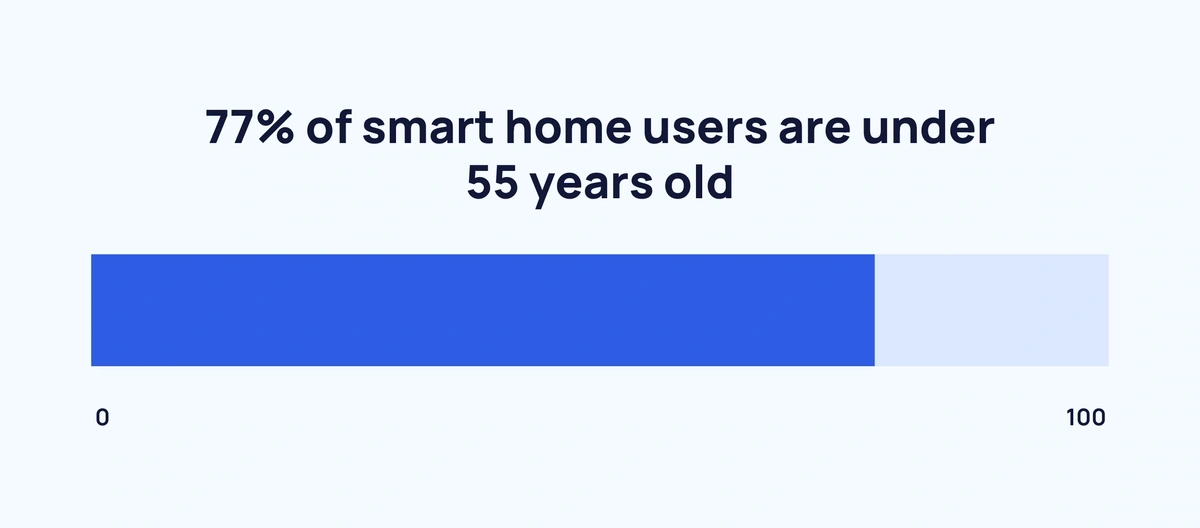
The vast majority of smart home users are Gen X and younger. In fact, 40% of smart home devices are owned by 18-34 year olds, despite making up only about 30% of the population. Generally, younger consumers see the value of energy savings and reducing their environmental impact.
Smart Home Demand Stats
The demand, along with improved technology, is largely driving the smart home market upwards. This set of statistics will focus on consumer demand for smart homes.
Around 3 in 4 potential home buyers are willing to pay more for a smart home (Security.org)
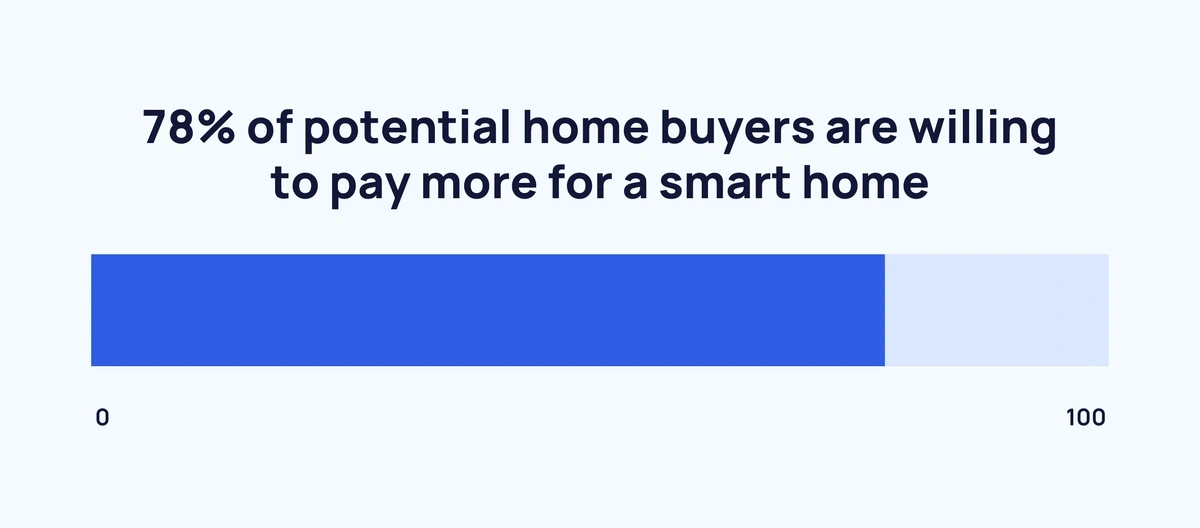
The vast majority of home buyers say they would pay more money for a smart home. And 70% of home buyers are actively looking to buy smart homes. Convenience, time savings, and security were some of the top reasons for wanting a smart home.
82% of renters want at least one smart device or system in their home (Rent.com)
Smart homes aren’t only for homeowners. A large majority (82%) of renters want a smart device or system in their homes. Among them, 35% said having a smart home device was either “important” or “extremely important.” The top three most popular smart home technologies among renters were:
1. Voice control (50%)
2. Smart appliances (41%)
3. Smart lights (36%)
46% of consumers adopt smart home technology for convenience (Hippo)
Convenience is, by far, the main reason why consumers adopt smart home technology in the first place. The second most popular reason for using smart home technology was to monitor the house when away (17%).
57% of non-adopters of smart homes don’t see the need for them (Smart Energy Consumer Collaborative)
Over half of consumers who haven’t adopted any smart home technology don’t see a need for them. A big barrier is the price tag of most smart home devices. Notably, these consumers tend to skew older (55+ years old).
Smart Home Benefit Stats
The high demand and rapid adoption of smart homes show that they’re highly valued by consumers. We provide smart home statistics showing benefits to consumers.
The vast majority of smart home device owners are at least somewhat satisfied with their devices (Smart Energy Consumer Collaborative)
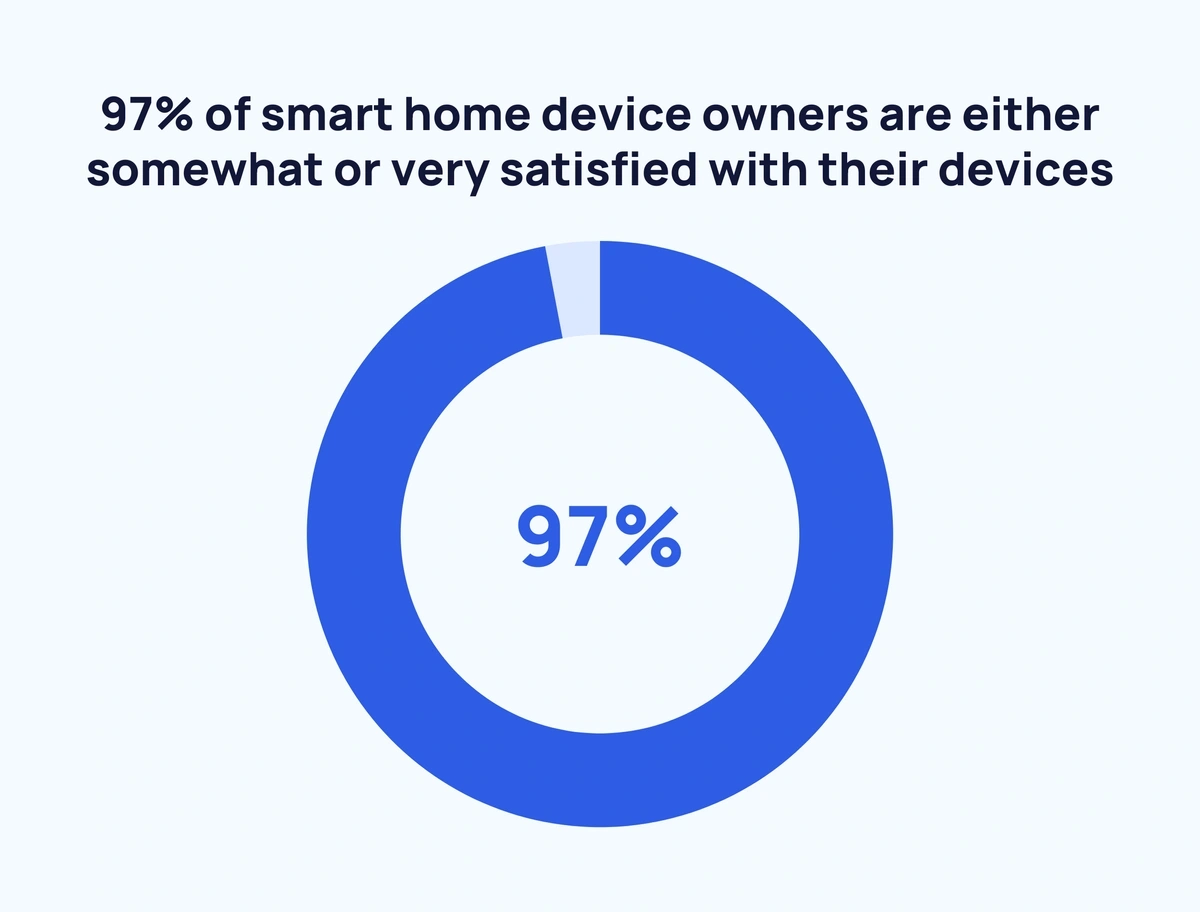
Smart home consumers are overwhelmingly satisfied with them. Almost all owners of smart speakers, smart thermostats, smart plugs, smart lights, and smart appliances were at least somewhat satisfied with their devices. Most owners (58%-64%) are very satisfied with their smart devices across the board.
79% of consumers say their smart home devices positively impacted their lives (Frontier)
Most consumers found that smart home devices positively impacted their lives. Happiness at home (57%), safety and security (45%), and productivity (44%) were the most common positive impacts. These sentiments were consistent across different smart home device types.
71% of consumers found smart home devices to be more beneficial than expected (Frontier)
Most consumers found smart homes to be more beneficial than expected. Convenience was the most cited benefit (75%), followed by usefulness (62%) and time savings (49%). Trial and error, as well as recommendations from friends and family, likely explain the delayed realization.
Smart Home Concern Stats
Despite the continued growth of smart homes, the next set of data illustrates that both adopters and non-adopters of smart home technology still have concerns.
Around 4 in 5 US consumers have at least one concern about smart home devices (YouGov)
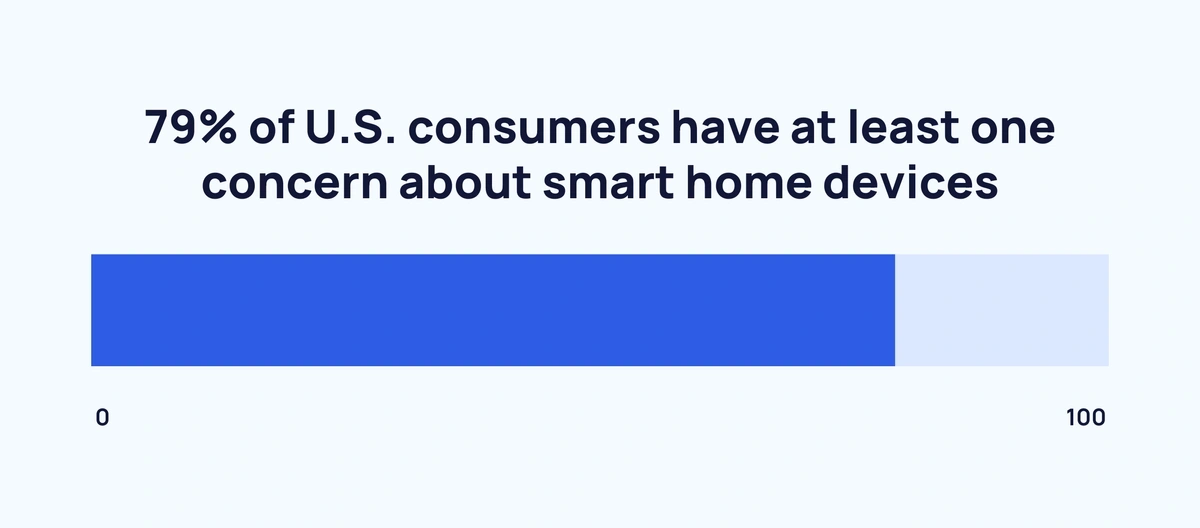
Only 21% of US consumers have no concerns about smart home devices. In addition to data security and privacy (the largest concern), 33% say they’re overpriced, 29% say they’re uneasy about usability if their internet is down, 23% say they’re anxious about remembering passwords, and 22% are worried about getting locked out.
63% of smart home consumers are concerned about data leaks (Smart Energy Consumer Collaborative)
Almost two-thirds of smart home consumers are concerned about their data being leaked. Consumers who don’t own any smart home devices are considerably more concerned about data leaks, especially from third-party vendors and utility providers.
Around 3 in 4 broadband households are concerned about their personal data security (Parks Associates)
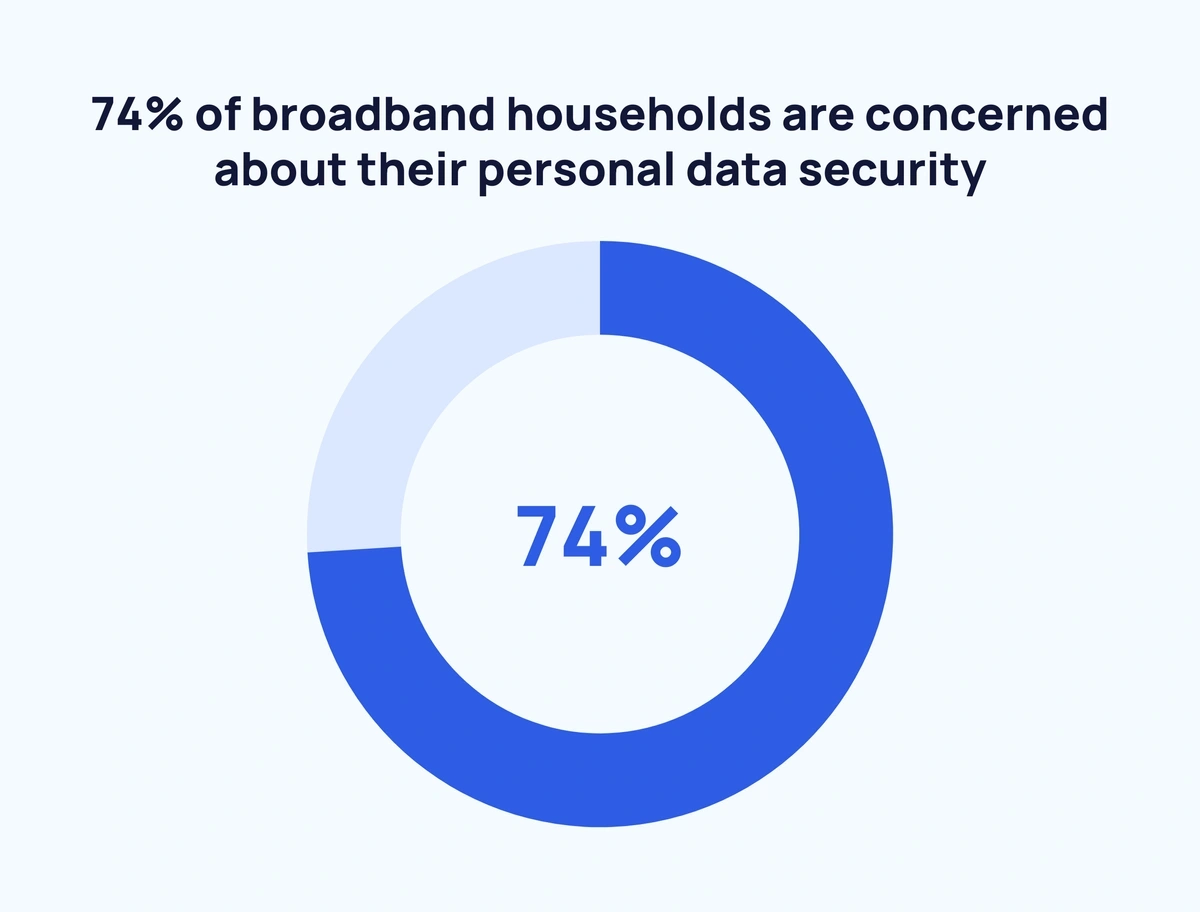
The vast majority of households who use broadband internet are concerned about their privacy and data security. The more smart home devices a household has, the higher that concern.
65% of Americans would not install smart-home devices that collect personal data for an insurance discount (PolicyGenius)
Most Americans would refuse to install a smart-home device, even if they were offered a discount on insurance. Americans are mainly concerned about their privacy and third-party use of their personal information.
Smart Home Device Stats
There are many different types of smart home devices in the market. Our stats highlight the most popular ones.
On average, US households with smart home devices own 8 devices (Parks Associates)
If a household has a smart home device, they tend to have several. From 2018 to 2021, the average number of smart home devices increased from 6 to 8.
Smart home camera adoption grew 55% from 2021 to 2022 (Plume)
Based on smart home data from one manufacturer, smart home camera adoption by clients grew 55% in one year. Smart doorbells and smart hubs also saw considerable increases (43% and 38%, respectively). Data suggests the main drivers for increased adoption were making the home more comfortable and secure.
Over 70% of smart home appliance owners also have a smart speaker (Smart Energy Consumer Collaborative)
Owning certain smart home technologies opens the door to having other technologies. For example, 79% of smart light owners have a smart speaker and 63% of smart appliance owners have a smart thermostat. However, only 45% of smart speaker owners have smart lights — suggesting potential growth in the smart speaker sector.
The average cost of installing a smart home device is $927 (HomeAdvisor)
Consumers who install smart home devices in their homes spend between $175 and $1,424 (a $927 average). Custom installations for large or luxury homes can cost anywhere from $2,000 to $150,000.
Installing smart home security systems costs $2,850 on average (HomeAdvisor)
Consumers who install smart home security devices in their homes spend between $700 and $5,000 (a $2,850 average). Setups range from an intruder alarm and doorbell camera to whole-home security systems with automated sensors and locks.
Conclusion
That sums up the most relevant smart home statistics.
Revenue, demand, and adoption of smart homes are expected to grow steadily in the next few years. And owners of smart home devices are overwhelmingly satisfied with them. However, data privacy and security remain a prominent concern for both smart home adopters and non-adopters.
From a trends perspective, the data shows that:
(1) smart home security is currently driving a good chunk of the smart home-focused IoT industry
(2) once a consumer adopts a smart home device, they tend to quickly adopt or purchase more devices.
Stop Guessing, Start Growing 🚀
Use real-time topic data to create content that resonates and brings results.

Exploding Topics is owned by Semrush. Our mission is to provide accurate data and expert insights on emerging trends. Unless otherwise noted, this page’s content was written by either an employee or a paid contractor of Semrush Inc.
Share
Newsletter Signup
By clicking “Subscribe” you agree to Semrush Privacy Policy and consent to Semrush using your contact data for newsletter purposes
Written By


Josh is the Co-Founder and CTO of Exploding Topics. Josh has led Exploding Topics product development from the first line of co... Read more