Get Advanced Insights on Any Topic
Discover Trends 12+ Months Before Everyone Else
How We Find Trends Before They Take Off
Exploding Topics’ advanced algorithm monitors millions of unstructured data points to spot trends early on.

Features
Keyword Research
Performance Tracking
Competitor Intelligence
Fix Your Site’s SEO Issues in 30 Seconds
Find technical issues blocking search visibility. Get prioritized, actionable fixes in seconds.
Powered by data from
How Many People Own Smartphones? (2025-2029)
Smartphones have become nearly ubiquitous in developed nations across the world. In fact, nearly three-quarters of the top 10 developed countries’ populations own a smartphone.
Globally, almost 90% of cellular phones are smartphones. And the majority of the world’s population currently owns one.
There are currently over 8 billion smartphones worldwide — a number that’s projected to increase overall in the coming years.
While the smartphone market grew in 2025, a combination of factors including a global memory shortage and Apple's decision to release its next base model in early 2027 has led experts to revise projections for 2026.
Original projections for 2026 showed a 1.2% increase. That number has been revised to predict a 0.9% decline in 2026.
Smartphone Ownership Statistics (Top Picks)
- There are more than 7 billion smartphones in the world.
- Worldwide smartphone users have increased year-over-year by at least 5% between 2020-2025.
- There are upwards of 19.8 billion IoT connections worldwide
- Smartphones make up more than 94% of all devices used to access the internet
- China has the most smartphone users in the world
- College graduates are most likely to own a smartphone
- Android is the leading mobile operating system worldwide
How Many Smartphones Are There?
Worldwide, there are more than 7 billion smartphones. To put that into perspective, that figure accounts for more than 1 phone for every person in the global population.
Compare that to a 2025 figure from ElectroIQ that there are 5.28 billion smartphone users globally. That's more phones than people using them.
This is because many people own more than one smartphone. And certain businesses own thousands of phones. To highlight this fact, it is estimated that approximately 10 billion mobile-connected devices are currently in use.
Sources: Statista, Statista (2), Newzoo, OuterBoxDesign, IDC, ElectroIQ
Smartphone Ownership Demographics
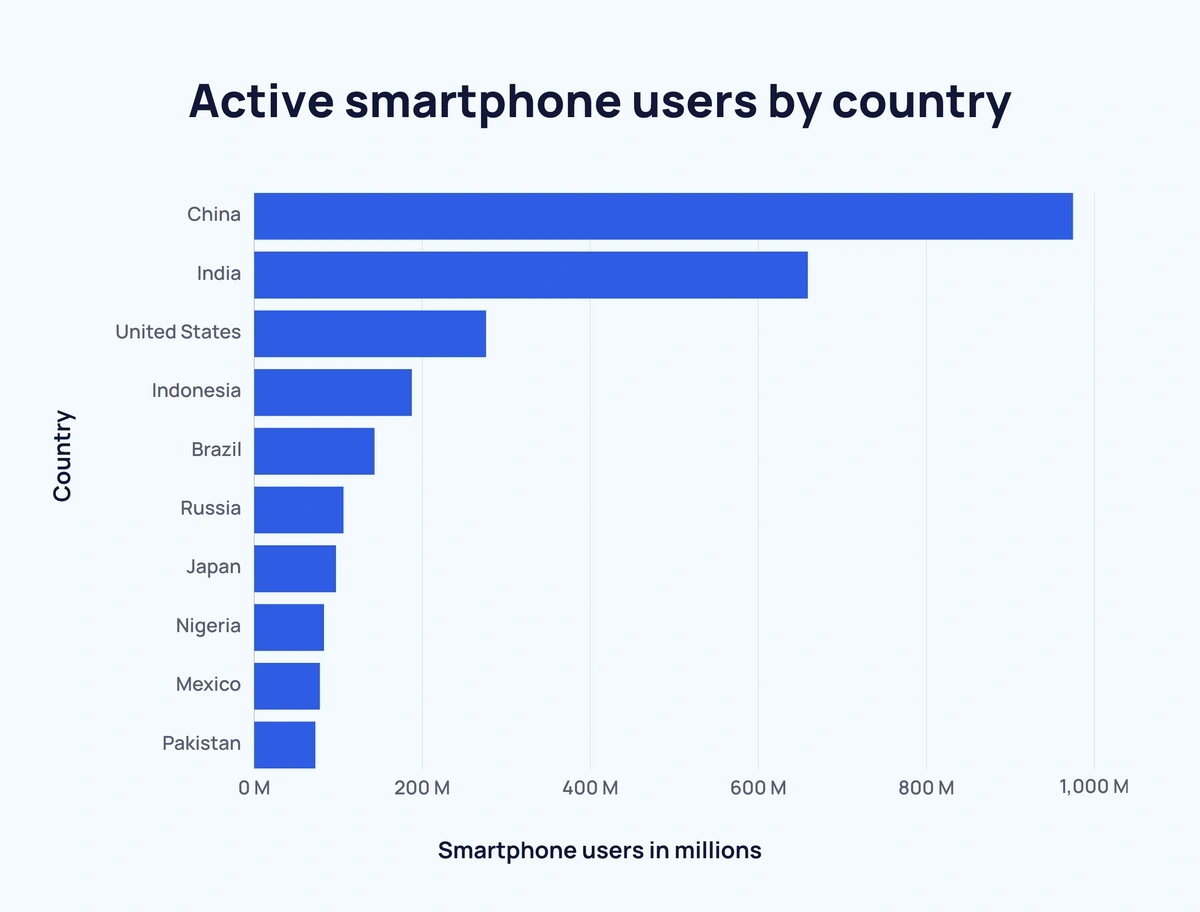
The top 10 countries by smartphone users each have at least 70 million active smartphone users.
China has the most smartphone users worldwide – almost 1.5x more than any other country.
Of the countries listed, the US has the largest proportion of its population actively using smartphones (81.6%).
Here is a full breakdown of New Zoo’s active smartphone users by country as of 2024:
| Rank | Country | Smartphone Users | Total Population | Smartphone Penetration |
| 1 | China | 974.69 million | 1.43 billion | 68.4% |
| 2 | India | 659 million | 1.42 billion | 46.5% |
| 3 | United States | 276.14 million | 338.29 million | 81.6% |
| 4 | Indonesia | 187.7 million | 275.5 million | 68.1% |
| 5 | Brazil | 143.43 million | 215.31 million | 66.6% |
| 6 | Russia | 106.44 million | 144.71 million | 73.6% |
| 7 | Japan | 97.44 million | 123.95 million | 78.6% |
| 8 | Nigeria | 83.34 million | 218.54 million | 38.1% |
| 9 | Mexico | 78.37 million | 127.5 million | 61.5% |
| 10 | Pakistan | 72.99 million | 235.82 million | 31% |
Despite these staggering figures, many people do not (and cannot) have access to a smartphone. This is because, according to the World Health Organization, more than 8% of the global population does not have electricity.
Semrush's Traffic Analytics tool allows you to check the demographics of website users. You can create detailed reports that shows users by age group, gender, location, and device.
Want to Spy on Your Competition?
Explore competitors’ website traffic stats, discover growth points, and expand your market share.
US Smartphone User Breakdown
As of late 2025, the US had more than 317 million smartphone users, boasting a 97% penetration rate. According to Pew, 98% of Americans own some kind of cell phone, with 91% of those being smartphones.
According to PewResearch data, the average smartphone user in the US:
Is female
In total, 91% of females own a smartphone compared to 90% of males in the US. Previously, more men owned smartphones. There is also a 1% difference in favor of females when it comes to owning a non-smartphone cell phone.
Is 18 to 29 years old
Perhaps unsurprisingly, the youngest adult age group features the highest proportion of smartphone users (97%).
The next highest proportion of smartphone users are 30 to 49-year-olds (96%), followed by 50 to 64-year-olds (90%), and rounded off by the 65+ age group (78%). These figures are up quite a bit, indicating wider smartphone adoption in recent years, as well as earlier adopters maintaining their smartphone use as they age.
Lives in an suburban area
US citizens living in suburban areas are more likely to use smartphones (93%) compared to urban residents (91%) and rural citizens (87%). This is a change from previous years where urban use was higher.
Is Asian
Data used to show that ethnicity made very little difference in terms of smartphone users. That's changed, however. The Asian population topped smartphone use at 96%. Other ethnic figures on smartphone use included Hispanic (93%), White (91%), and Black (85%).
Those numbers even out considerably when looking at cellphone ownership in general—not just smartphone ownership. Each ethnicity shows a 98% ownership rate.
Graduated college
Meanwhile, the level of education showed a positive correlation to smartphone ownership. And a negative correlation to non-smartphone ownership.
Here are the details:
| Education Level | Cell Phone Ownership | Smartphone Only Ownership | Non-Smartphone Only Ownership |
| High-school graduate | 97% | 84% | 13% |
| Some College | 98% | 93% | 5% |
| College graduate | 99% | 96% | 2% |
Earned upwards of $70,000
Lastly, there was also a positive correlation between smartphone ownership and annual salary.
Americans earning over $100,000 are most likely to own a smartphone (97%), followed by the $70,000-$99,9999 bracket (96%). After that, there is a considerable drop, with those in the $30,000-$69,999 bracket at 89%, and those making less than $30,000 at 82%.
Sources: Newzoo, Quartz, PewResearch, PewResearch (2)
Smartphone Ownership Over Time
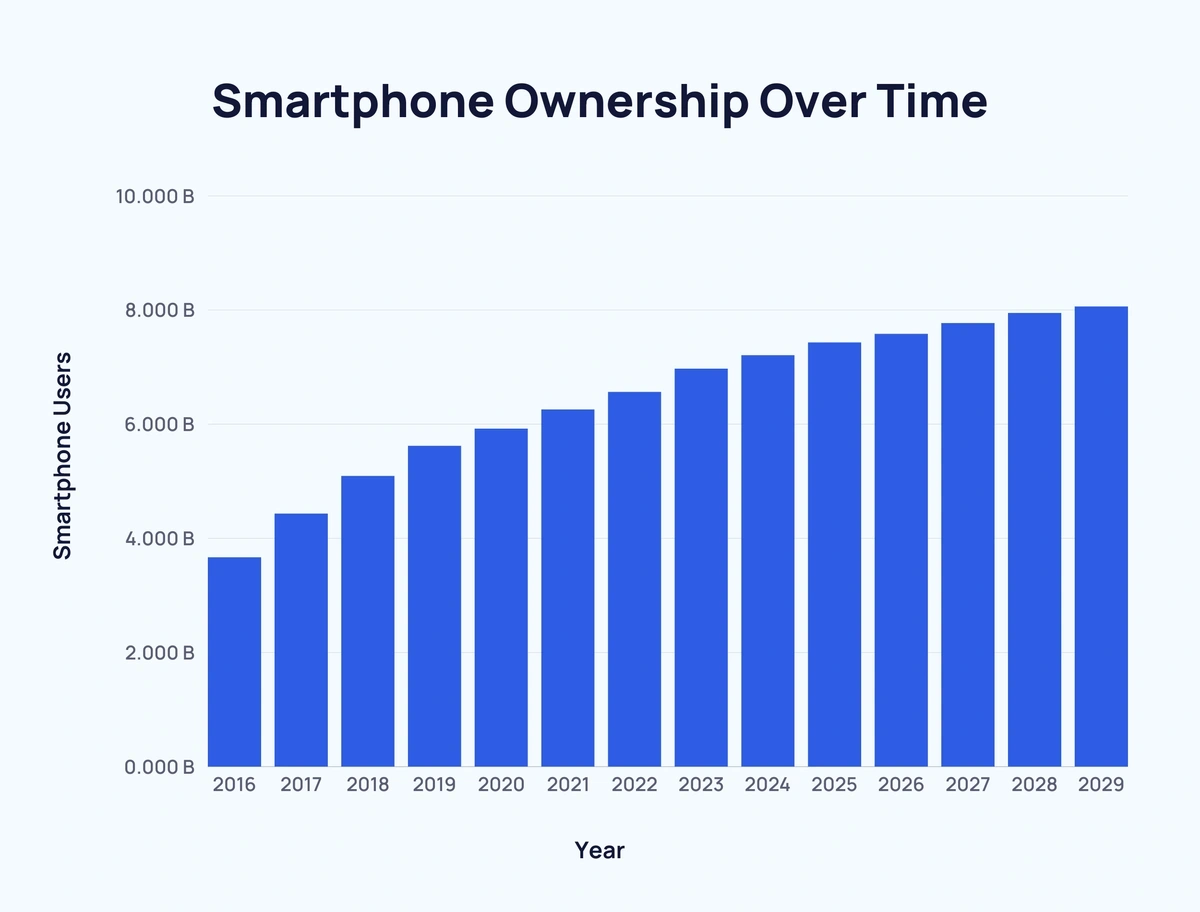
In the space of half a decade, smartphone users worldwide have increased significantly.
Back in 2016, there were approximately 3.67 billion smartphone users. Since then, this figure has increased year-over-year, now showing numbers in excess of 7 billion.
Between 2016-2025, the number of smartphone owners has increased by around 96%.
The following table shows smartphone usage growth since 2016:
| Year | Smartphone Users | Growth Over Previous Year | Percentage Growth Over Previous Year |
| 2016 | 3.668 billion | - | - |
| 2017 | 4.435 billion | + 767 million | + 20.91% |
| 2018 | 5.095 billion | + 660 million | + 14.88% |
| 2019 | 5.623 billion | + 528 million | + 10.36% |
| 2020 | 5.924 billion | + 301 million | + 5.35% |
| 2021 | 6.259 billion | + 335 million | + 5.65% |
| 2022 | 6.567 billion | + 308 million | + 4.92% |
| 2023* | 6.974 billion | + 407 million | + 6.2% |
| 2024* | 7.211 billion | + 247 million | + 3.4% |
| 2025* | 7.434 billion | + 223 million | + 3.09% |
| 2026* | 7.584 billion | + 150 million | + 2% |
| 2027* | 7.772 billion | + 188 million | + 2.48% |
| 2028* | 7.949 billion | + 177 million | + 2.28% |
| 2029* | 8.064 billion | + 115 million | + 1.45% |
*estimated
Smartphone ownership is expected to continue to grow over the next 3-4 years.
In 2024, the number of smartphones worldwide exceeded 7 billion. And the proportion of smartphones to cell phones grows every year.
As of June 2025, smartphones account for 94.2% of all devices used by people aged 16+ to access the internet.
This has only led to an increase in average screen time per day, too. Mobile users spend, on average, 4 hours and 37 minutes on their phones daily.
Here is a look at the forecasted data for smartphones worldwide between 2021 and 2027:
| Year | Number of Smartphones | Number of Mobile Devices | Proportion of Smartphones |
| 2021 | 6.37 billion | 14.91 billion | 42.7% |
| 2022 | 6.57 billion* | 15.96 billion* | 41.17% |
| 2023 | 6.84 billion* | 16.8 billion* | 40.71% |
| 2024 | 7.07 billion* | 17.72 billion* | 39.9% |
| 2025 | 7.30 billion* | 18.22 billion* | 40.07%% |
| 2026 | 7.51 billion* | - | - |
| 2027 | 7.69 billion* | - | - |
*estimated
Source: Ericsson, The Radicati Group
Smartphone Market Share
The smartphone market split has diversified over the last decade.
In 2012, Samsung claimed almost one-third of the smartphone market – the largest single share that year. Besides Apple, (who claimed an 18.7% market share) no other brand claimed more than 4% of the market.
IDC figures from Q3 2025 show that Samsung had the highest market share (18.8%), followed closely by Apple (18.2%). After that was Xiaomi (13.3%), Transsion (9%), and vivo (8.6%).
Build a winning strategy
Get a complete view of your competitors to anticipate trends and lead your market
The two major mobile operating systems (OS) used in smartphones are Android and iOS.
As of late 2025 and early 2026, the global mobile OS market share is distributed like this:
- Android has a 79% OS market share
- iOS has a 17% OS market share
However, in the US market, iOS leads the way. As of the end of December 2025, iOS boasted a 27.64% market share, while Android claimed a 18.85% market share.
Sources: IDC, StatCounter
Conclusion
That concludes our roundup of smartphone ownership statistics.
Smartphone adoption continues to grow and is increasingly becoming more widespread across the globe.
There is still some way to go in developing countries, but in the most developed nations, smartphones are becoming near-omnipresent.
If you enjoyed these smartphone statistics, we have pages for in-demand mobile apps and mobile app development trends.
Stop Guessing, Start Growing 🚀
Use real-time topic data to create content that resonates and brings results.
Exploding Topics is owned by Semrush. Our mission is to provide accurate data and expert insights on emerging trends. Unless otherwise noted, this page’s content was written by either an employee or a paid contractor of Semrush Inc.
Share
Newsletter Signup
By clicking “Subscribe” you agree to Semrush Privacy Policy and consent to Semrush using your contact data for newsletter purposes
Written By


Josh is the Co-Founder and CTO of Exploding Topics. Josh has led Exploding Topics product development from the first line of co... Read more


