


Get Advanced Insights on Any Topic
Discover Trends 12+ Months Before Everyone Else
How We Find Trends Before They Take Off
Exploding Topics’ advanced algorithm monitors millions of unstructured data points to spot trends early on.

Keyword Research
Performance Tracking
Competitor Intelligence
Fix Your Site’s SEO Issues in 30 Seconds
Find technical issues blocking search visibility. Get prioritized, actionable fixes in seconds.
Powered by data from
Latest Blog Posts
Featured Case Studies
See what's trending before everyone else
Each week, we'll send you our best Exploding Topics. Plus, expert insight and analysis.
The Latest Data on Confidence in Institutions (2024)

Institutional confidence is an intangible concept that can be difficult to measure.
However, ever-increasing quantitative data is making it easier to track and compare on a worldwide scale.
We’ll explore the statistics surrounding trust in various institutions, from both a US-centric and global viewpoint:
- Government Trust Over Time
- Confidence In Governments
- Trust In American Institutions
- International Trust In Institutions Over Time
- Determinants Of Trust In Institutions
Stats for Confidence in Institutions (Top Picks)
Here are five curated statistics for confidence in institutions:
- Just over half (52.5%) of Americans trust their government.
- US citizens have the most confidence in the military.
- Globally, the media is the least trusted institution.
- Of 107 countries surveyed, Uzbekistanis are the most trusting of their government.
- Lebanese citizens are the least trusting of their government.
Government Trust Over Time
Pew Research has gathered data on US government trust dating back to 1958. Looking closer at this data, public confidence in the government has largely been on the decline over the past 20 years. In fact, current figures are among the lowest in 70 years.
During that period, government trust was at its highest during Lyndon B. Johnson’s presidency.

The following is a deep dive into America's confidence in the government “to do what is right” at least “most of the time” since 1958.*
|
Month, Year |
Government Trust |
President |
|
December, 1958 |
73% |
Dwight D. Eisenhower |
|
October, 1964 |
77% |
Lyndon B. Johnson |
|
December, 1966 |
65% |
Lyndon B. Johnson |
|
October, 1968 |
62% |
Lyndon B. Johnson |
|
November, 1970 |
54% |
Richard Nixon |
|
October, 1972 |
53% |
Richard Nixon |
|
December, 1974 |
36% |
Gerald Ford |
|
October, 1976 |
33% |
Gerald Ford |
|
December, 1978 |
29% |
Jimmy Carter |
|
October, 1980 |
25% |
Jimmy Carter |
|
December, 1982 |
33% |
Ronald Reagan |
|
October, 1984 |
44% |
Ronald Reagan |
|
November, 1986 |
49% |
Ronald Reagan |
|
October, 1988 |
41% |
Ronald Reagan |
|
September, 1990 |
42% |
George H. W. Bush |
|
October, 1992 |
22% |
George H. W. Bush |
|
October, 1994 |
22% |
Bill Clinton |
|
October, 1996 |
33% |
Bill Clinton |
|
October, 1998 |
26% |
Bill Clinton |
|
October, 2000 |
44% |
Bill Clinton |
|
October, 2002 |
55% |
George W. Bush |
|
October, 2004 |
46% |
George W. Bush |
|
October, 2006 |
29% |
George W. Bush |
|
October, 2008 |
17% |
George W. Bush |
|
October, 2010 |
22% |
Barack Obama |
|
October, 2012 |
22% |
Barack Obama |
|
July, 2014 |
14% |
Barack Obama |
|
October, 2015 |
19% |
Barack Obama |
|
April, 2017 |
20% |
Donald Trump |
|
March, 2019 |
17% |
Donald Trump |
|
April, 2021 |
24% |
Joe Biden |
*Data presented in 2-year intervals where possible.
The Organisation for Economic Co-operation and Development (OECD) is an intergovernmental economic organization consisting of 38 nations.
Data from the OECD shows the combined government trust from those member countries has fluctuated by 9.14% between 2010 and 2020.
The lowest trust figures (34.6%) came in 2013. While the highest was 45.74% in 2020.
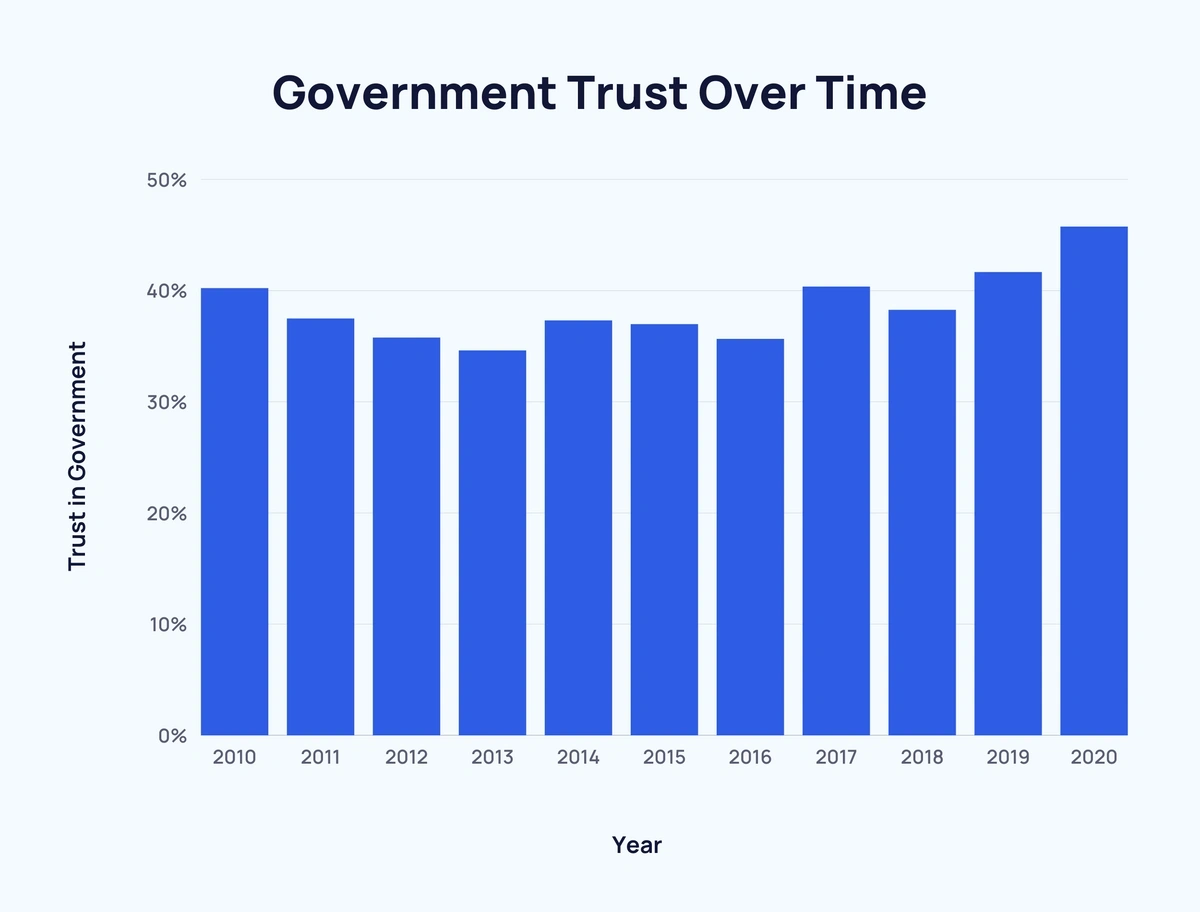
Here’s a closer look at how government confidence changed with each year during the 2010s:
|
Year |
Trust in Government |
Change Over Previous Year |
|
2010 |
40.2% |
- |
|
2011 |
37.47% |
↓ 2.55% |
|
2012 |
35.76% |
↓ 1.71% |
|
2013 |
34.6% |
↓ 1.16% |
|
2014 |
37.3% |
↑ 2.6% |
|
2015 |
36.97% |
↓ 0.33% |
|
2016 |
35.64% |
↓ 1.33% |
|
2017 |
40.34% |
↑ 4.7% |
|
2018 |
38.25% |
↓ 2.09% |
|
2019 |
41.65% |
↑ 3.4% |
|
2020 |
45.74% |
↑ 4.09% |
And here’s a nation-by-nation comparison of government trust for selected OECD countries over the same period:
|
Year |
Canada |
France |
Germany |
Italy |
Japan |
Russia |
UK |
US |
|
2010 |
55.1% |
40.1% |
39.5% |
33.4% |
27% |
51.4% |
50.4% |
41.8% |
|
2011 |
55.3% |
37.5% |
42.5% |
26% |
23.1% |
48% |
46.8% |
38.3% |
|
2012 |
52.3% |
44.1% |
51.7% |
28.1% |
16.9% |
45.2% |
42.1% |
34.9% |
|
2013 |
50.6% |
39.5% |
55.8% |
14.6% |
35.8% |
38.8% |
37.9% |
28.9% |
|
2014 |
51.7% |
26.4% |
60.1% |
30.9% |
38% |
64% |
42.3% |
34.9% |
|
2015 |
64.4% |
32.8% |
62.8% |
26.1% |
35.3% |
64.9% |
45.7% |
34.7% |
|
2016 |
61.8% |
28.4% |
55.3% |
23.8% |
36.2% |
58.4% |
40.9% |
29.7% |
|
2017 |
65.3% |
37.5% |
62.3% |
23% |
41.2% |
55.7% |
44% |
38.7% |
|
2018 |
61% |
38.1% |
59.3% |
20.7% |
38.5% |
45.6% |
42.1% |
31.4% |
|
2019 |
54.9% |
38.2% |
56.8% |
22.2% |
41.1% |
43.7% |
34.1% |
36.3% |
|
2020 |
60% |
41% |
65.4% |
37.5% |
42.3% |
47.8% |
34.7% |
46.5% |
|
10-Year Low |
50.6% |
26.4% |
39.5% |
14.6% |
16.9% |
38.8% |
34.1% |
28.9% |
|
10-Year High |
65.3% |
44.1% |
65.4% |
37.5% |
42.3% |
64.9% |
50.4% |
41.8% |
|
Fluctuation |
14.7% |
17.7% |
25.9% |
22.9% |
25.4% |
26.1% |
16.3% |
12.9% |
The data shows an average fluctuation of 16.19% between 10-year lows and 10-year highs for confidence in respective governments.
Source: Pew Research, Data.OECD
Confidence in Governments
Given the vast geopolitical differences from nation to nation, it is no surprise that confidence in the people who run a country varies enormously around the world.
Our World is Data provides stats from 2020 of 107 countries and gathered data from over 140,000 respondents.
Participants were asked “How much do you trust your national government?” and given four options: a lot, some, not much, and not at all. The following data shows the percentage who responded either “a lot” or “some”.
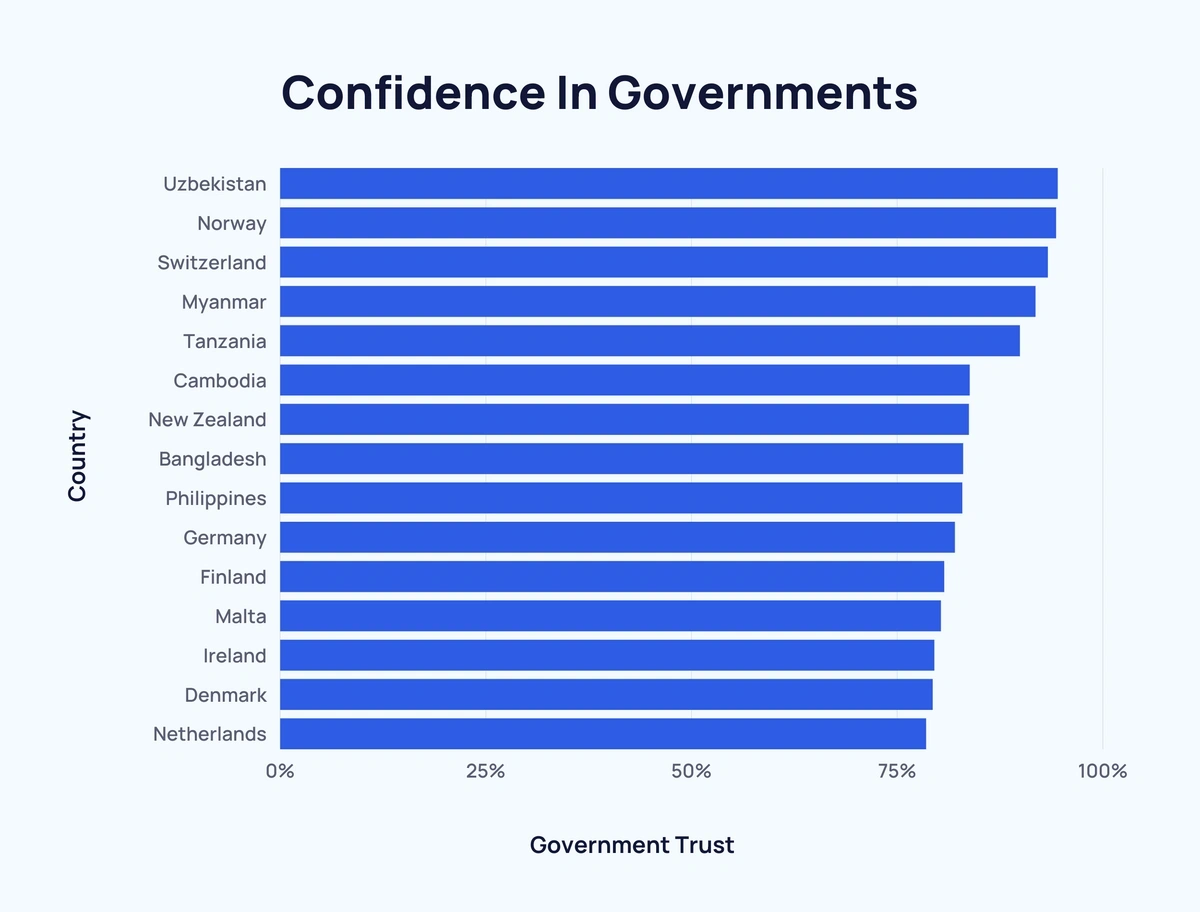
Here are the top 20 nations by the proportion of respondents who trust their respective governments:
| Global Rank* | Country | Government Trust | Region | Regional Rank* |
| 1 | Uzbekistan | 94.5% | Asia | 1 |
| 2 | Norway | 94.3% | Europe | 1 |
| 3 | Switzerland | 93.3% | Europe | 2 |
| 4 | Myanmar | 91.8% | Asia | 2 |
| 5 | Tanzania | 89.9% | Africa | 1 |
| 6 | Cambodia | 83.8% | Asia | 3 |
| 7 | New Zealand | 83.7% | Oceania | 1 |
| 8 | Bangladesh | 83% | Asia | 4 |
| 9 | Philippines | 82.9% | Asia | 5 |
| 10 | Germany | 82% | Europe | 3 |
| 11 | Finland | 80.7% | Europe | 4 |
| 12 | Malta | 80.3% | Europe | 5 |
| 13 | Ireland | 79.5% | Europe | 6 |
| 14 | Denmark | 79.3% | Europe | 7 |
| =15 | Netherlands | 78.5% | Europe | 8 |
| =15 | El Salvador | 78.5% | North America | 1 |
| 17 | Ethiopia | 78.1% | Africa | 2 |
| 18 | Laos | 76.4% | Asia | 6 |
| 19 | Sri Lanka | 76.3% | Asia | 7 |
| 20 | Austria | 73.4% | Europe | 9 |
A selection of other noteworthy international government trust statistics:
| Global Rank* | Country | Government Trust | Region | Regional Rank* |
| 22 | Canada | 72.6% | North America | 3 |
| 23 | Egypt | 72.2% | Africa | 3 |
| 27 | Australia | 69.5% | Oceania | 2 |
| 29 | India | 66% | Asia | 10 |
| 32 | Indonesia | 60.9% | Asia | 12 |
| 40 | France | 56.3% | Europe | 12 |
| 46 | Turkey | 54.9% | Europe/Asia | 16/17 |
| 49 | Mexico | 54.1% | North America | 5 |
| 52 | South Korea | 52.8% | Asia | 19 |
| 53 | United States | 52.5% | North America | 6 |
| 54 | Italy | 52.3% | Europe | 18 |
| 57 | South Africa | 50.9% | Africa | 11 |
| 60 | Japan | 49.5% | Asia | 21 |
| 63 | Spain | 48.2% | Europe | 20 |
| 66 | United Kingdom | 47.7% | Europe | 22 |
| 69 | Russia | 47% | Europe/Asia | 24/22 |
| 71 | Iran | 45.8% | Asia | 23 |
| 85 | Brazil | 40.6% | South America | 6 |
And here are the bottom 20:
| Global Rank* | Country | Government Trust | Region | Regional Rank* |
| 88 | Hong Kong | 40% | Asia | 24 |
| 89 | Latvia | 39.6% | Europe | 32 |
| 90 | North Macedonia | 37.2% | Europe | 33 |
| 91 | Paraguay | 34.4% | South America | 7 |
| 92 | Iraq | 34.3% | Asia | 25 |
| 93 | Poland | 33.6% | Europe | 34 |
| 94 | Gabon | 33.5% | Africa | 20 |
| 95 | Venezuela | 30.9% | South America | 8 |
| 96 | Guinea | 30.8% | Africa | 21 |
| 97 | Ukraine | 28% | Europe | 35 |
| 98 | Chile | 27.7% | South America | 9 |
| 99 | Kosovo | 26.3% | Europe | 36 |
| 100 | Tunisia | 26.1% | Africa | 22 |
| 101 | Ecuador | 25.8% | South America | 10 |
| 102 | Cameroon | 25.5% | Africa | 23 |
| 103 | Bosnia and Herzegovina | 24.8% | Europe | 37 |
| 104 | Romania | 24.3% | Europe | 38 |
| 105 | Nigeria | 23.1% | Africa | 24 |
| 106 | Moldova | 17.8% | Europe | 39 |
| 107 | Lebanon | 15.8% | Asia | 26 |
* Of 107 countries with available data
A smaller (36,000 respondents), but more recent Statista study from November 2021, highlighted several countries and their changing government trust:
| Country | Our World is Data 2020 Trust | Statista 2020 Trust | Statista 2021 Trust | Change in Trust (Statista) |
| China | - | 82% | 91% | ↑ 9% |
| Saudi Arabia | - | 82% | 82% | - |
| India | 66% | 79% | 74% | ↓ 5% |
| Germany | 82% | 59% | 47% | ↓ 12% |
| United Kingdom | 47.7% | 45% | 42% | ↓ 3% |
| United States | 52.5% | 42% | 39% | ↓ 3% |
| Russia | 47% | 34% | 37% | ↑ 3% |
| Argentina | 43.9% | 30% | 22% | ↓ 8% |
The discrepancies between two relatively large samples highlight how difficult it is to collect data of this nature. This is further emphasized during a tumultuous and fast-changing socio-economic landscape with the backdrop of a global pandemic.
Source: Our World in Data, Statista
Trust in American Institutions
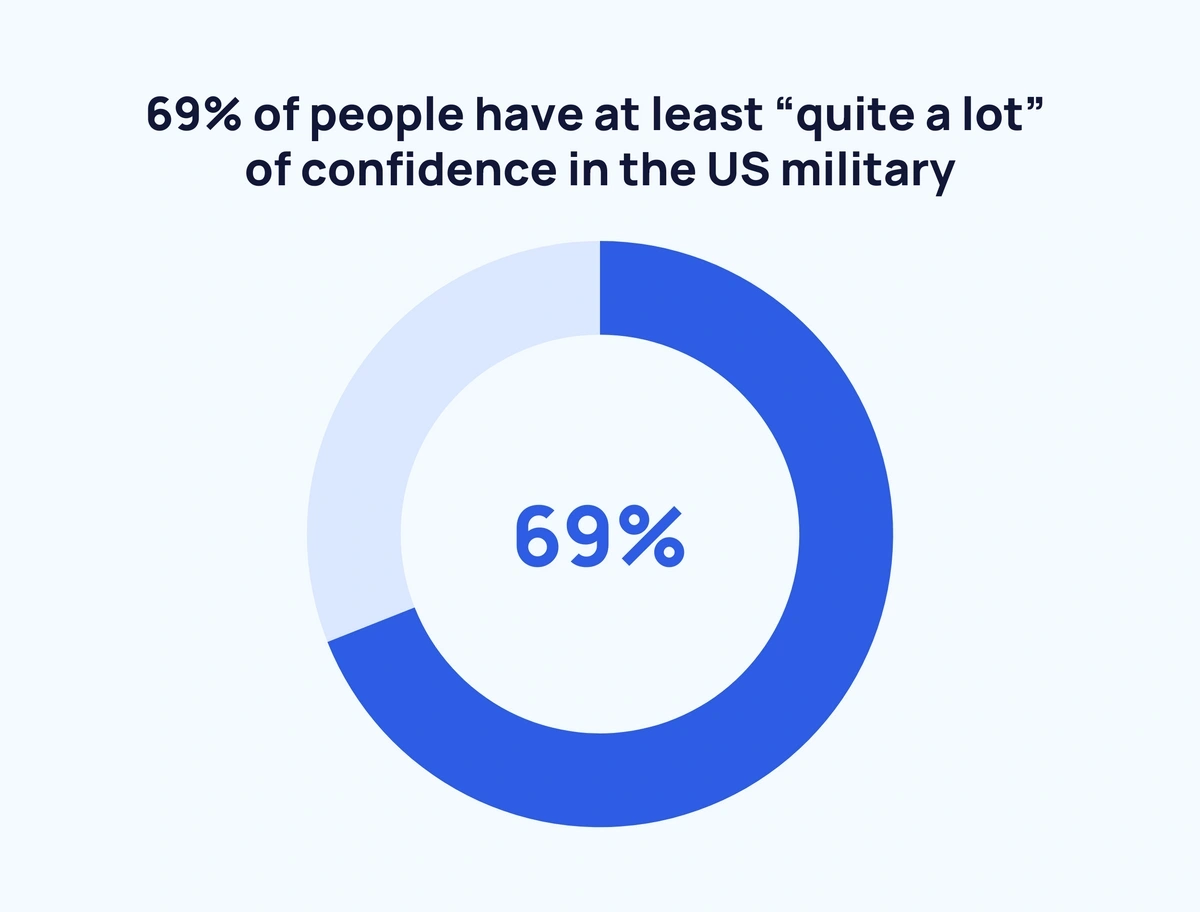
Looking further afield, the military achieved the highest public confidence of 17 different US institutions with 69% having at least “quite a lot” of confidence in 2021.
On the other end of the spectrum, Congress received a figure of just 12%. And over half of Americans (51%) claim to have “very little” to “no” confidence.
Here’s how each US institution compared in terms of public confidence in 2021:
| Institution | Great Deal | Quite a Lot | Some | Very Little | None | No Opinion |
| Military | 37% | 32% | 22% | 9% | - | 1% |
| Science | 35% | 29% | 24% | 11% | 1% | - |
| Small Business | 35% | 35% | 24% | 7% | - | - |
| Police | 26% | 25% | 32% | 16% | 1% | - |
| Medical System | 20% | 24% | 33% | 21% | 1% | - |
| Organized Religion | 19% | 18% | 34% | 26% | 3% | 1% |
| Presidency | 16% | 22% | 29% | 29% | 4% | 1% |
| Supreme Court | 13% | 23% | 42% | 21% | 1% | - |
| Public Schools | 13% | 19% | 39% | 28% | 1% | - |
| Large Tech Companies | 12% | 17% | 38% | 30% | 2% | 1% |
| Organized Labor | 12% | 16% | 46% | 22% | 1% | 2% |
| Banks | 12% | 21% | 42% | 23% | 1% | 1% |
| Big Business | 9% | 9% | 41% | 38% | 3% | 1% |
| Newspapers | 8% | 13% | 35% | 39% | 4% | 1% |
| Criminal Justice | 7% | 13% | 38% | 39% | 3% | - |
| Television News | 6% | 10% | 30% | 48% | 5% | - |
| Congress | 5% | 7% | 37% | 47% | 4% | - |
Split into demographics, it’s clear that background has an influence on institutional confidence.
Democrat voters and Republican voters often have opposing views and this is particularly true when it comes to confidence in the media. Over half of Democrats (55%) trust the US media, compared to around 1 in 4 (24%) of Republicans.
In fact, across the board, Republicans are less trusting of US institutions than Democrats.
The table below compares democrat voters’ and republican voters’ trust in US institutions in 2021:
| Institution | Democrat Trust | Republican Trust | Difference |
| Media | 55% | 24% | 31% |
| Business | 55% | 48% | 7% |
| Non-Governmental Organisations (NGOs) | 57% | 38% | 19% |
| Government | 53% | 29% | 24% |
| Average | 55% | 35% | 20% |
Overall, confidence in US institutions has remained relatively stable over the last 30 years, although there has been a steady recent decline.
As of 2021, 33% of US citizens have “quite a lot” or “a great deal” of confidence in US institutions. That’s a fall of 10% from a 28-year high in 2003. And represents the 3rd lowest recorded result in that time.
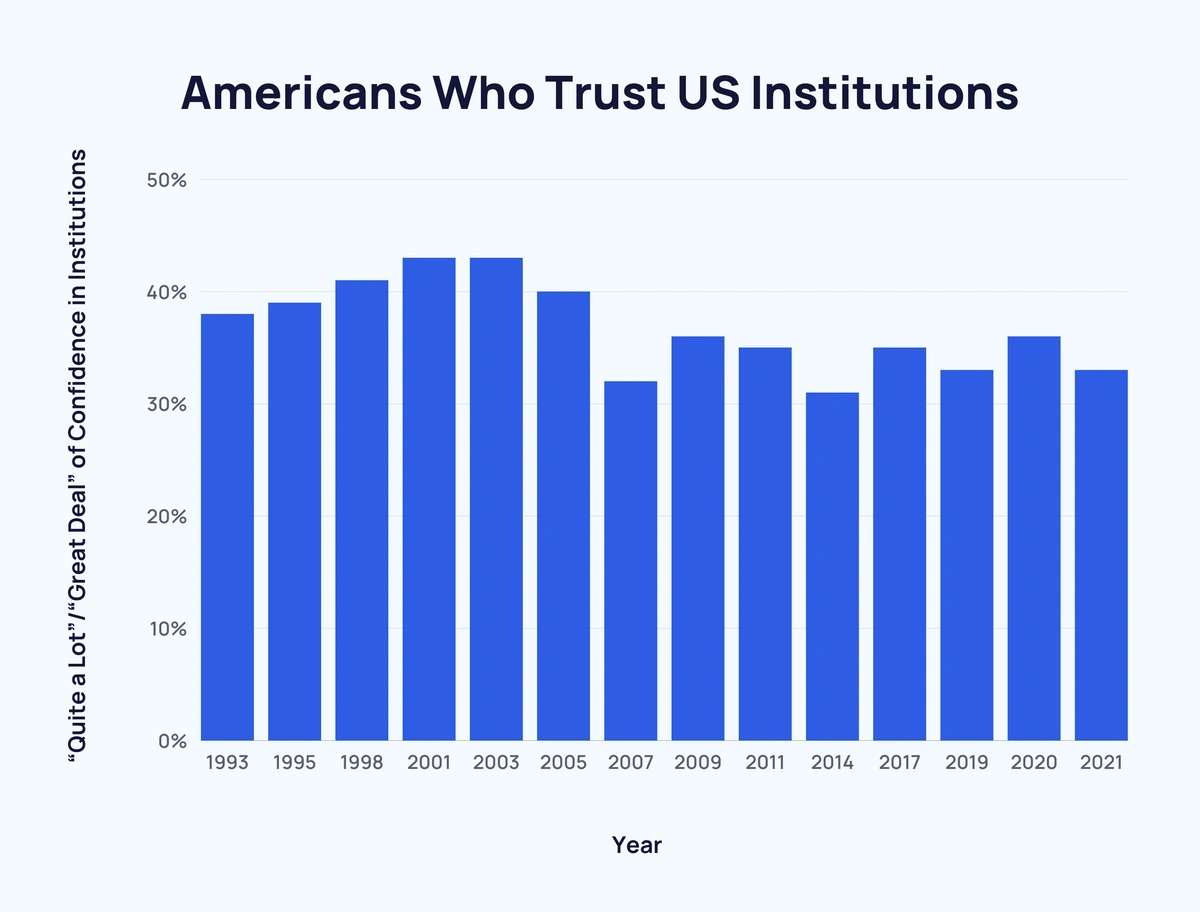
Here is the proportion of Americans who trust US institutions over time since 1993:
| Year | “Quite a Lot”/“Great Deal” of Confidence in Institutions | Change Over Last Survey |
| 1993 | 38% | - |
| 1995 | 39% | ↑ 1% |
| 1998 | 41% | ↑ 2% |
| 2001 | 43% | ↑ 2% |
| 2003 | 43% | - 0% |
| 2005 | 40% | ↓ 3% |
| 2007 | 32% | ↓ 8% |
| 2009 | 36% | ↑ 4% |
| 2011 | 35% | ↓ 1% |
| 2014 | 31% | ↓ 4% |
| 2017 | 35% | ↑ 4% |
| 2019 | 33% | ↓ 2% |
| 2020 | 36% | ↑ 3% |
| 2021 | 33% | ↓ 3% |
International Trust in Institutions Over Time
As seen in US data, trust in key institutions can at times be volatile. In just a matter of months, public opinion can shift dramatically.
To explore this further, here is a comparison between pre-pandemic 2017 and 2019 data on institutional trust collected for several European countries:
| Trust in the Military* | Trust in Parliament | Trust in Media** | |||||||
| Country | 2017 | 2019 | Change | 2017 | 2019 | Change | 2017 | 2019 | Change |
| Sweden | 77% | 75% | ↓ 2% | 71% | 72% | ↑ 1% | 64% | 56% | ↓ 8% |
| Netherlands | 71% | 78% | ↑ 7% | 68% | 64% | ↓ 4% | 67% | 60% | ↓ 7% |
| Germany | 70% | 69% | ↓ 1% | 55% | 48% | ↓ 7% | 64% | 47% | ↓ 17% |
| UK | 82% | 80% | ↓ 2% | 54% | 19% | ↓ 35% | 32% | 21% | ↓ 11% |
| France | 84% | 82% | ↓ 2% | 33% | 27% | ↓ 6% | 35% | 28% | ↓ 7% |
| Italy | 82% | 65% | ↓ 17% | 16% | 31% | ↑ 15% | 29% | 37% | ↑ 8% |
| Spain | 66% | 72% | ↑ 6% | 16% | 24% | ↑ 8% | 31% | 33% | ↑ 2% |
*2017 data for “military”, 2019 data for the “army”.
**2017 data for the “news media”, 2019 data for “media”.
Of the seven nations compared, three (Germany, the UK, and France) saw confidence drop across the board.
While Spain was the only nation to see trust in each measured institution increase.
Media saw the largest change in public trust between 2017 (an average of 46%) and 2019 (an average of 40.3%), dropping 5.7%.
This was closely followed by trust in parliament, which fell from an average of 44.7% in 2017 to 40.7% in 2019 - a decline of 4%.
Trust in the military also declined but not as severely, from a 2017 average of 76% to 74.4% - a fall of 1.6%.
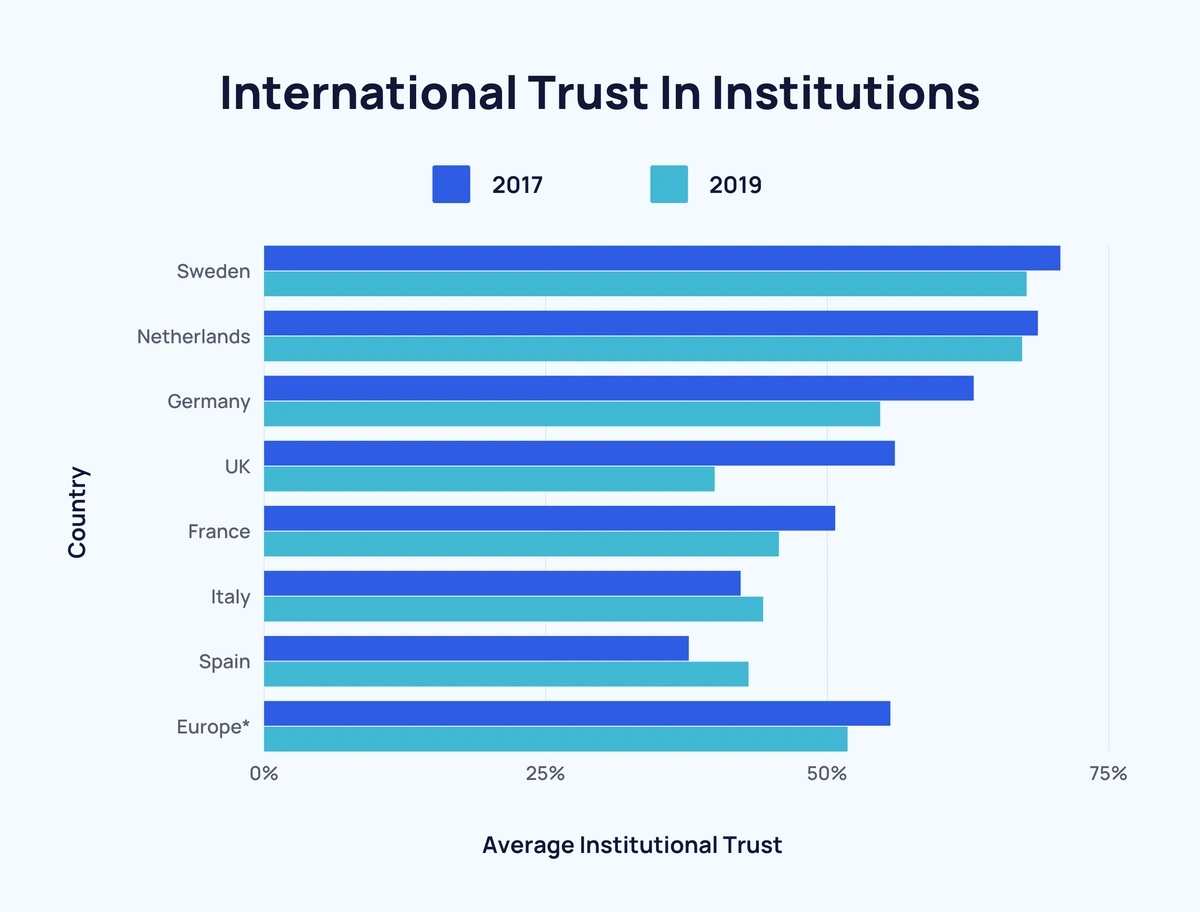
Here’s how averages from the data above compare:
| Country | Average Institutional Trust 2017 | Average Institutional Trust 2019 | Average Trust Change |
| Sweden | 70.7% | 67.7% | ↓ 3% |
| Netherlands | 68.7% | 67.3% | ↓ 1.4% |
| Germany | 63% | 54.7% | ↓ 8.3% |
| UK | 56% | 40% | ↓ 16% |
| France | 50.7% | 45.7% | ↓ 5% |
| Italy | 42.3% | 44.3% | ↑ 2% |
| Spain | 37.7% | 43% | ↑ 5.3% |
| Europe* | 55.6% | 51.8% | ↓ 3.8% |
*Includes only listed countries.
Looking specifically at trust in individual institutions, 2020 statistics corroborate the data above with the media and governments ranking among the least trusted institutions.
In fact, “press/media” was the only one of 10 institutions that scored a negative average trust score of -3.
On the opposite end of the spectrum, the “medical profession” scored the highest average trust score of 80.
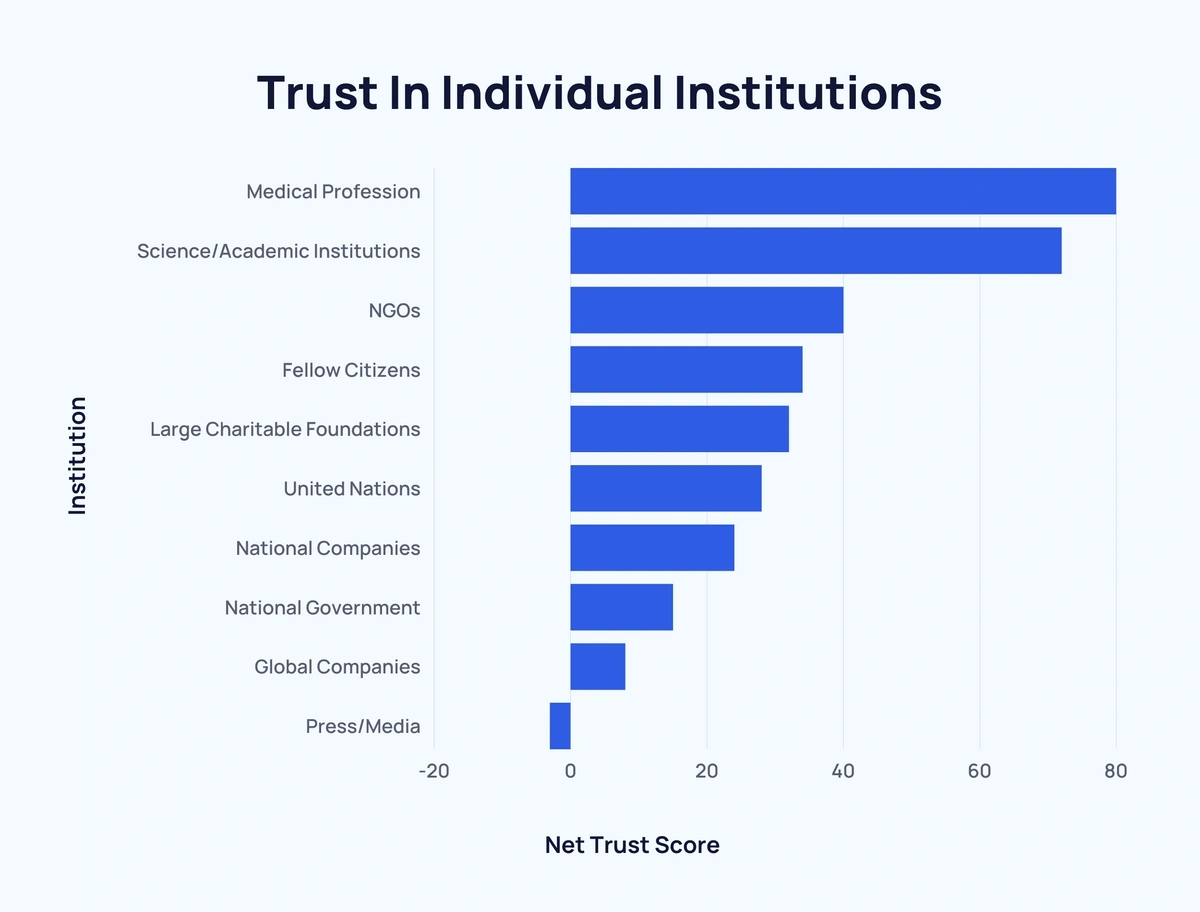
Here is the full list of institutions ranked by trust score based on data from 17 countries:
| Institution | Net Trust Score |
| Medical Profession | 80 |
| Science/Academic Institutions | 72 |
| NGOs | 40 |
| Fellow Citizens | 34 |
| Large Charitable Foundations | 32 |
| United Nations | 28 |
| National Companies | 24 |
| National Government | 15 |
| Global Companies | 8 |
| Press/Media | -3 |
According to Edelman’s 2022 report, almost half of 36,000+ respondents view the government (48%) and media (46%) as “divisive forces in society”.
The report also shines a light on the mistrust of news outlets. Trust in search engines sits at 59%, ahead of traditional media at 57%. Owned media is trusted by just 43% of the public. While social media is a trusted news outlet for 37% of people.
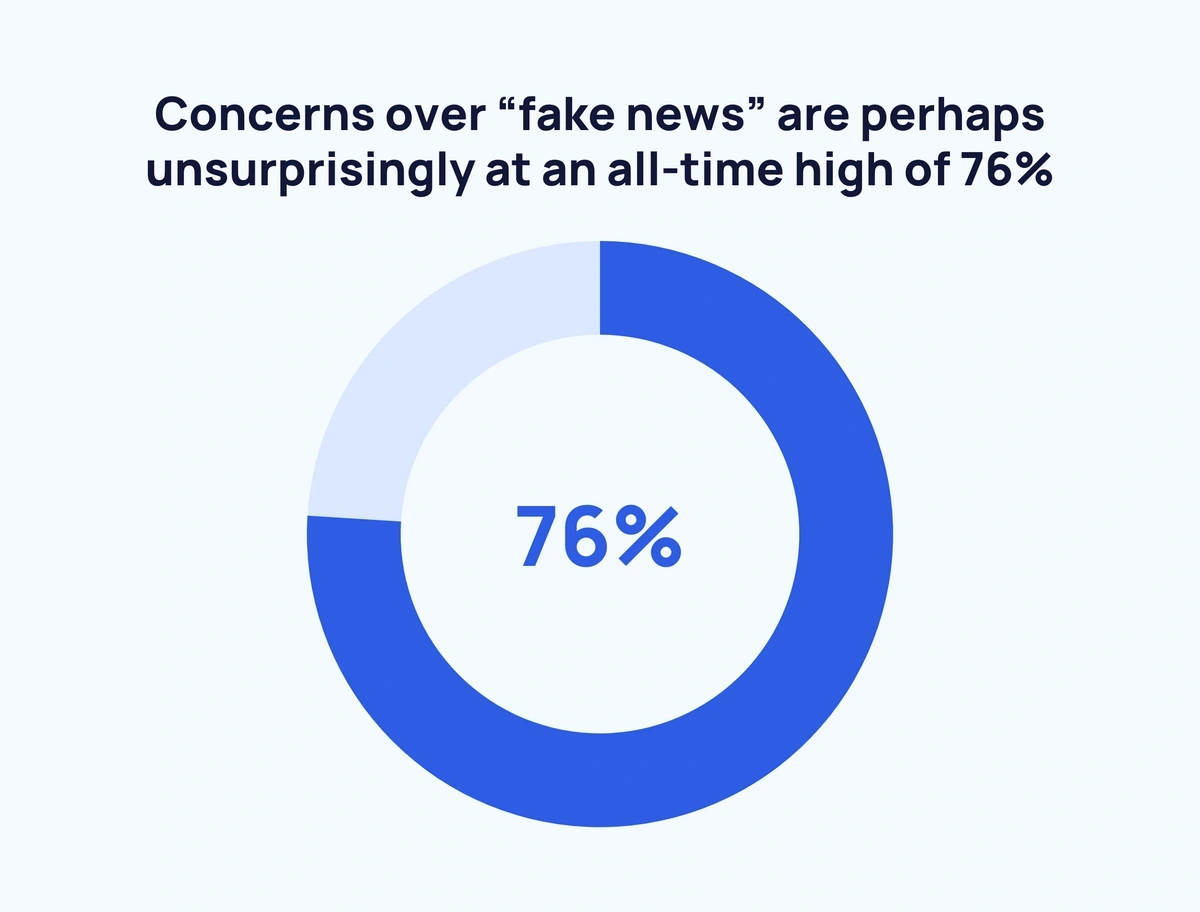
And concerns over “fake news” are at an all-time high of 76%.
The report suggests that businesses are among the most trusted institutions.
But this is not necessarily the case on a global level.
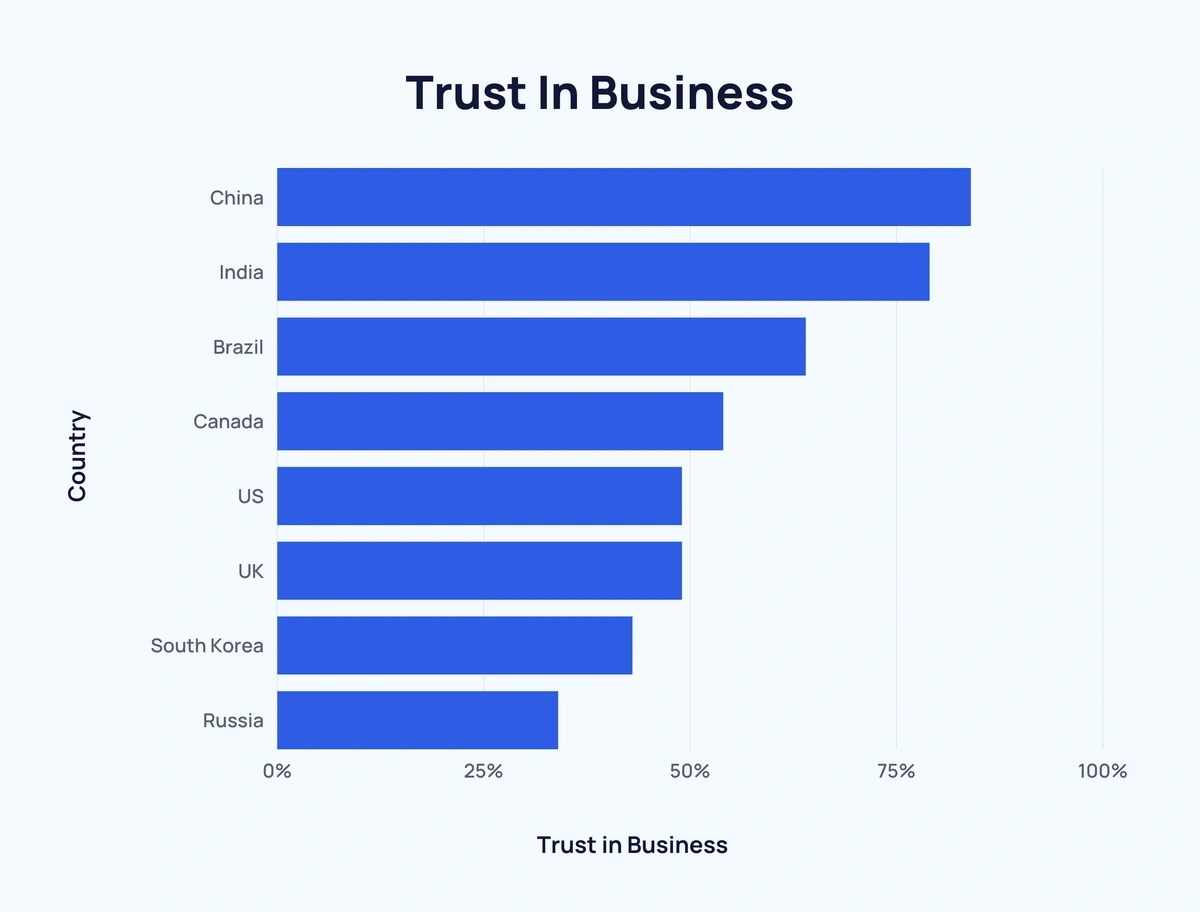
In fact, the difference between business trust in some of the top nations by GDP is stark:
| Country | Trust in Business | GDP Rank |
| China | 84% | #2 |
| India | 79% | #5 |
| Brazil | 64% | #8 |
| Canada | 54% | #10 |
| US | 49% | #1 |
| UK | 49% | #6 |
| South Korea | 43% | #12 |
| Russia | 34% | #11 |
Source: Pew Research, European Commission, GlobeScan, Edelman, Statista
Determinants of Trust in Institutions
Distrust has become the default for many, with 3 in 5 people refusing to trust something until they are presented with evidence to do so.
A 2019 paper found that trust in institutions significantly declines in nations that employ fiscal adjustment programs. Conversely, institutional trust is notably strengthened following credit rating upgrades.
Socio-economic and geopolitical factors naturally influence trust in institutions. And one such unignorable incident is the COVID-19 pandemic which has been associated with an increase in trust in scientists.
Figures show a rise of 9% from 34% in 2018 to 43% in 2020 in people who trust scientists “a lot”. These improved levels of trust were most prominent among respondents who claimed to know “some” to “not much/nothing at all” about science.
Source: Edelman, Drakos, Kallandranis, and Karidis,
Conclusion
Predicting institutional confidence is a minefield influenced by innumerable ever-changing global and cultural factors.
Nonetheless, there appears to be a global trend towards distrust of many institutions, with media in particular seemingly leading the way.
If you found this page interesting, take a look at Key Gen Z Trends and Remote Work Trends.
Stop Guessing, Start Growing 🚀
Use real-time topic data to create content that resonates and brings results.

Exploding Topics is owned by Semrush. Our mission is to provide accurate data and expert insights on emerging trends. Unless otherwise noted, this page’s content was written by either an employee or a paid contractor of Semrush Inc.
Share
Newsletter Signup
By clicking “Subscribe” you agree to Semrush Privacy Policy and consent to Semrush using your contact data for newsletter purposes
Written By


Josh is the Co-Founder and CTO of Exploding Topics. Josh has led Exploding Topics product development from the first line of co... Read more