


Get Advanced Insights on Any Topic
Discover Trends 12+ Months Before Everyone Else
How We Find Trends Before They Take Off
Exploding Topics’ advanced algorithm monitors millions of unstructured data points to spot trends early on.

Keyword Research
Performance Tracking
Competitor Intelligence
Fix Your Site’s SEO Issues in 30 Seconds
Find technical issues blocking search visibility. Get prioritized, actionable fixes in seconds.
Powered by data from
Latest Blog Posts
Featured Case Studies
See what's trending before everyone else
Each week, we'll send you our best Exploding Topics. Plus, expert insight and analysis.
27+ Amazing Video Game Industry Statistics (2025)

This guide will highlight some of the top video game industry statistics worth knowing.
We've updated the list in October 2025.
Read on to explore the current state of the video game industry.
Editor's Picks - Top Video Game Industry Stats
- The US video game market is worth almost $60 billion
- Over one-third of the world's population are active gamers
- China and the US dominate the gaming market, with nearly 1 billion players and $100 billion in revenue
- 47% of gamers are women
- Most US game purchases are now made digitally
- Mobile gaming makes up 49% of all video games revenue
- More than $1.6 billion has been handed out in Esports prize money
Video Game Industry Growth Statistics
The US video gaming market is worth nearly $60 billion (Motley Fool)
Sources disagree about the exact size of the US video game market. But Motley Fool analysis from September 2025 finds that revenue hit $59.3 billion in 2024.
That equates to a household spend of $449 per year.
There are now 2.87 billion gamers worldwide (Statista)

As with revenue, there are various different estimates out there for the total number of gamers worldwide. 3.3 billion is a popularly-cited number.
However, the most recent research from 2025 provides an estimate of more like 2.87 billion. That's still more than a third of the world's population.
China and the US dominate international gaming markets (newzoo)
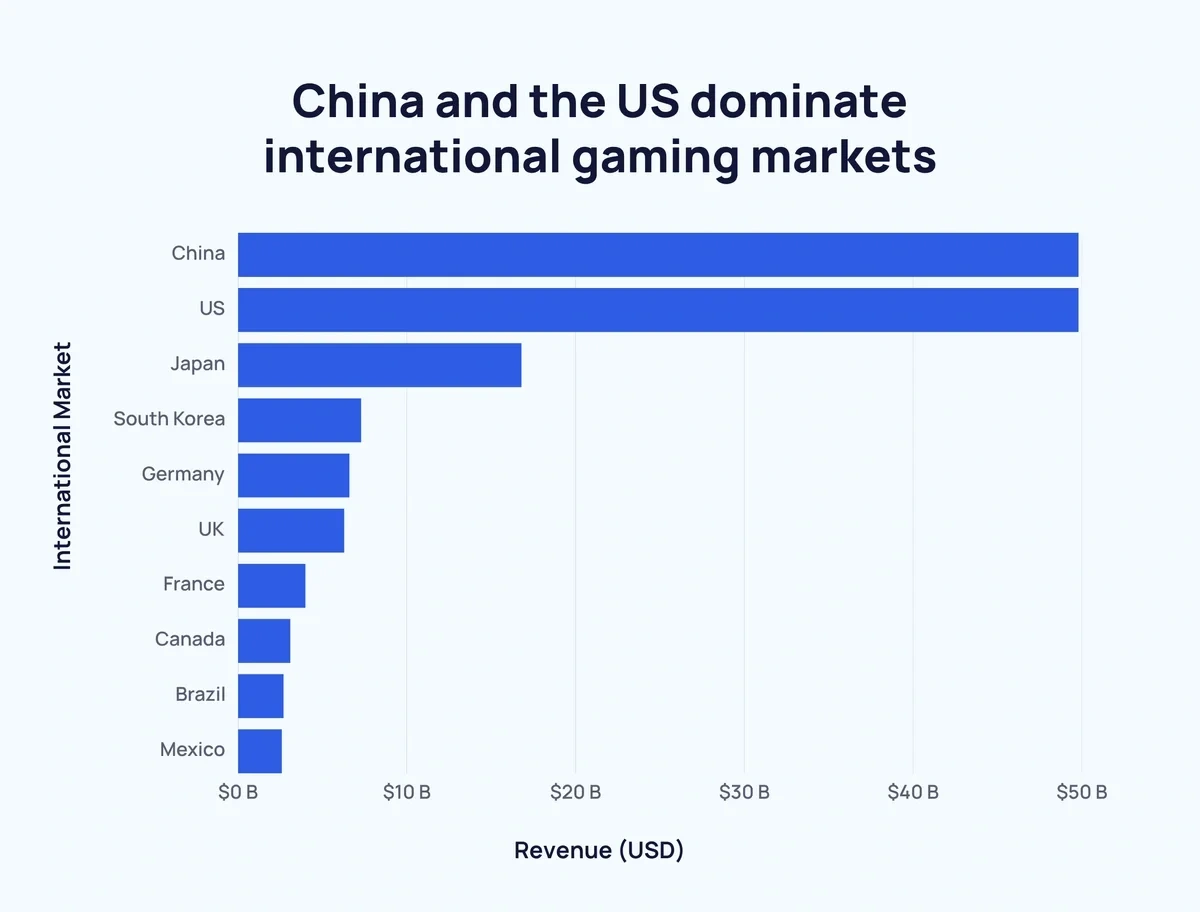
Together, gaming revenue generated by China and the US outperforms the rest of the top 10 leading markets combined by some distance.
The third biggest international gaming market is Japan, bringing in $16.8 billion. This figure stands at barely a third of China’s.
However, Japan’s share of gaming revenue is more than 2x the amount generated by 4th-placed South Korea. And roughly equal to all of the top 3 European nations (Germany, the United Kingdom, and France) combined.
3 of the top 4 international gaming markets are based in Asia. A further 3 are situated in North America.
| Rank | International Market | Revenue | Players |
| 1 | China | $49.8 billion | 723 million |
| 2 | United States | $49.6 billion | 224.8 million |
| 3 | Japan | $16.8 billion | 74.1 million |
| 4 | South Korea | $7.3 billion | 34 million |
| 5 | Germany | $6.6 billion | 53.2 million |
| 6 | United Kingdom | $6.3 billion | 43.4 million |
| 7 | France | $4 billion | 40.2 million |
| 8 | Canada | $3.1 billion | 24.4 million |
| 9 | Brazil | $2.7 billion | 123.3 million |
| 10 | Mexico | $2.6 billion | 78.1 million |
Video Game Demographic Statistics
77% of gamers in the US are adults (Entertainment Software Association)
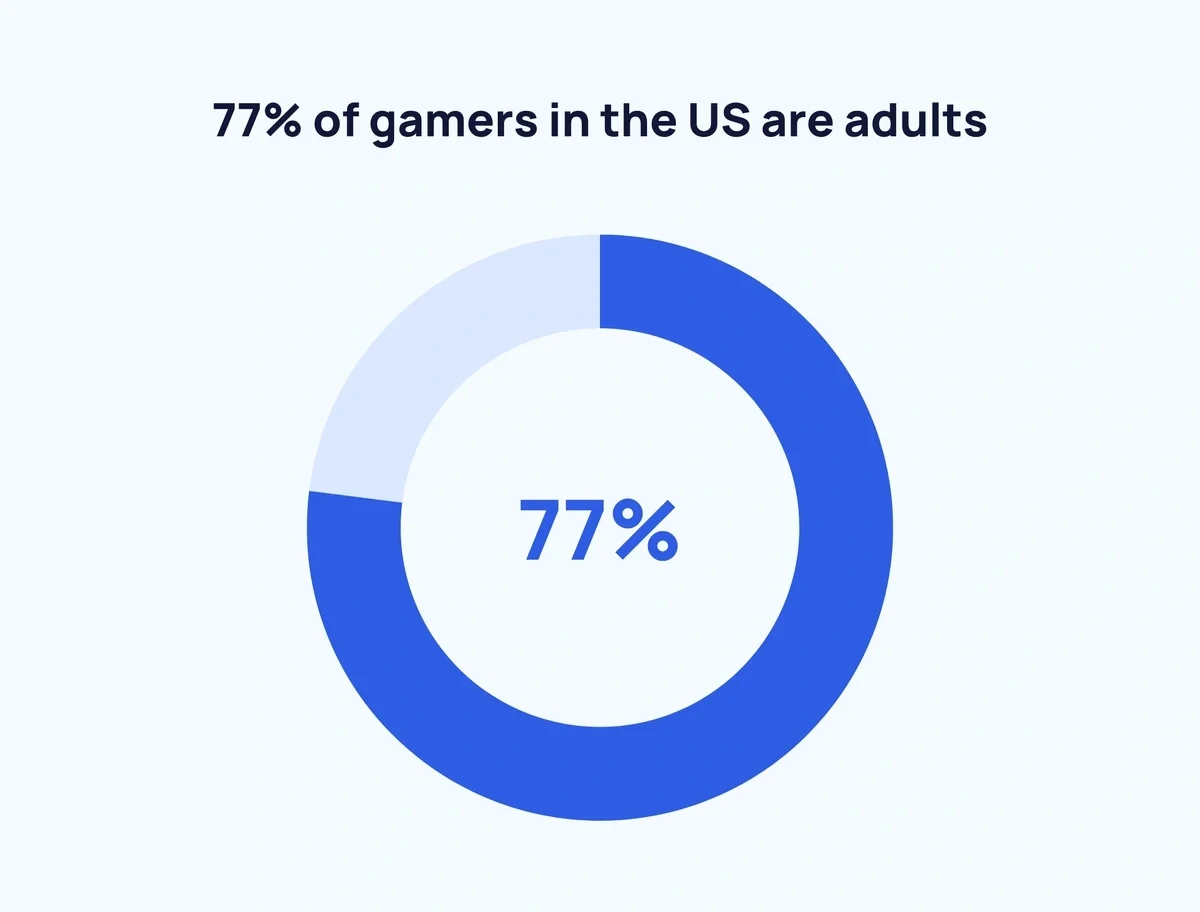
Video games are considered by many an activity for kids and teenagers. However, according to recent data, fewer than 1 in 4 gamers are children.
Gamers aged 18-34 and 50+ are the two largest groups, each making up 28% of all gamers in the US. The average age is 36.
Nonetheless, 86% of Gen Alpha boys and 76% of girls play video games for at least an hour a week.
Gaming is split almost equally between men and women (Entertainment Software Association)
The proportion of male-to-female gamers has shifted significantly in the last 20 years.
In 2006, female gamers made up 38% of all gamers. That's risen to 47% in 2025.
52% of gamers are male, with the remaining 1% either non-binary or preferring not to say.
LGBT representation in gaming matches the overall population (Entertainment Software Association)
9% of gamer self-identify as LGBT.
That's broadly in line with the overall balance in the US. According to the latest Gallup data, 9.3% of US adults identify as LGBTQ+.
Mobile Gaming Stats
Mobile gaming is responsible for almost half of total gaming revenue (Quantum Run)
Mobile gaming’s share of total gaming revenue has climbed significantly over the past decade.
In 2012, mobile gaming claimed only 18% of the gaming industry's overall revenue.
Today, that figure stands at 49%, well ahead of console (28%) and PC (23%). Mobile gaming generates over $92 billion.
Honor of Kings was the highest-grossing mobile game in the first half of 2025 (AppMagic)
From January to June 2025, Honor of Kings generated an astonishing $895.43 million revenue.
Last War: Survival and Whiteout Survival completed the top 3, each generating over $700 million.
Roblox made it into the top 10. Roblox has more than 111 million daily active users, 80% of whom play on mobile.
Honor of Kings has grossed more than $18 billion all-time (Video Game Sales Wiki)
More than 100 mobile games have surpassed $1 billion in all-time revenue. Honor of Kings leads the way with $18.66 billion.
Here are the top 10 highest grossing mobile games of all time:
| Title | All-time revenue |
| Honor of Kings/Arena of Valor | $18.66 billion |
| Candy Crush Saga | $12 billion |
| PUBG Mobile | $11.04 billion |
| Monster Strike | $11.02 billion |
| Clash of Clans | $10.2 billion |
| Pokemon Go | $9.27 billion |
| Puzzle and Dragons | $8.58 billion |
| Fate/Grand Order | $7 billion |
| Genshin Impact | $6.3 billion |
| Roblox Mobile | $5.54 billion |
Home Gaming Console Statistics
Worldwide home console revenue is $51.9 billion per year (Quantum Run)
Home consoles made by the likes of Sony, Microsoft, and Nintendo - and their accompanying games, accessories, and merchandise - were responsible for approximately 28% of all gaming revenue last year.
Mobile gaming generated considerably more revenue ($92.6 billion) than either console gaming ($51.9 billion) or PC gaming ($43.2 billion).
That said, all types of gaming have seen a marked increase in in-app purchases during the COVID-19 pandemic.
Here’s a breakdown of annual revenue by platform:
| Platform | Annual Revenue (Billions) |
| PC | $43.2 |
| Console | $51.9 |
| Mobile | $92.6 |
There are 130 million Xbox Live Users worldwide (SQ Magazine)

There are 130 million monthly active Xbox Live users in 2025, up from 120 million in 2024.
Xbox Live is needed in order to gain online multiplayer access to Xbox games. Although Xbox Live is a free service, many of its most desirable features (including online access to most games) are locked behind a paid tier system known as Xbox Game Pass.
There were 37 million active Xbox Game Pass subscribers in Q1 2025, up 12% YoY.
There are more than 50 million PlayStation Plus users (SQ Magazine)
Sony introduced a paywall to restrict online access to PlayStation Plus members in 2013, matching Microsoft’s model for the Xbox. Since then, PlayStation Plus users have steadily climbed.
As of Q1 2025, there are 51.6 million PlayStation Plus subscribers worldwide.
Meanwhile, 23.7 million PlayStation gamers have Premium subscriptions, an all-time high.
The Nintendo Switch has sold over 150 million units to date (Nintendo)
Since its release in March 2017, the Nintendo Switch has sold 153.1 million units. This vastly improves on Nintendo’s prior release, the Wii U, which sold a total of 13.56 million units.
First-party titles have been a driving force behind the console’s success. Popular franchises such as The Legend of Zelda, Pokémon, and Super Mario are all exclusive Nintendo properties.
Free-to-play (F2P) games generate over $115 billion of market revenue per year (Statista)
F2P games have become increasingly popular in recent years. They made an estimated $117.7 billion in 2024, driven by in-game purchases.
While F2P games remain most popular on mobile, followed by PC, the free-to-play model has increasingly come to consoles as well via titles like Fortnite, Rocket League and Warzone. 77.4% of Fortnite players play on console.
Gamers spend more money on in-game downloads than on full games (Juniper)
In-game spending has overtaken outright video game purchases as the main source of gaming revenue. In 2025, in-game purchases will amount to an estimated $74.4 billion, up from $54 billion in 2020.
Popular Video Game Statistics
Minecraft is the best-selling game of all time (Wikipedia)
Minecraft is the best-selling video game of all time, selling 350 million copies.
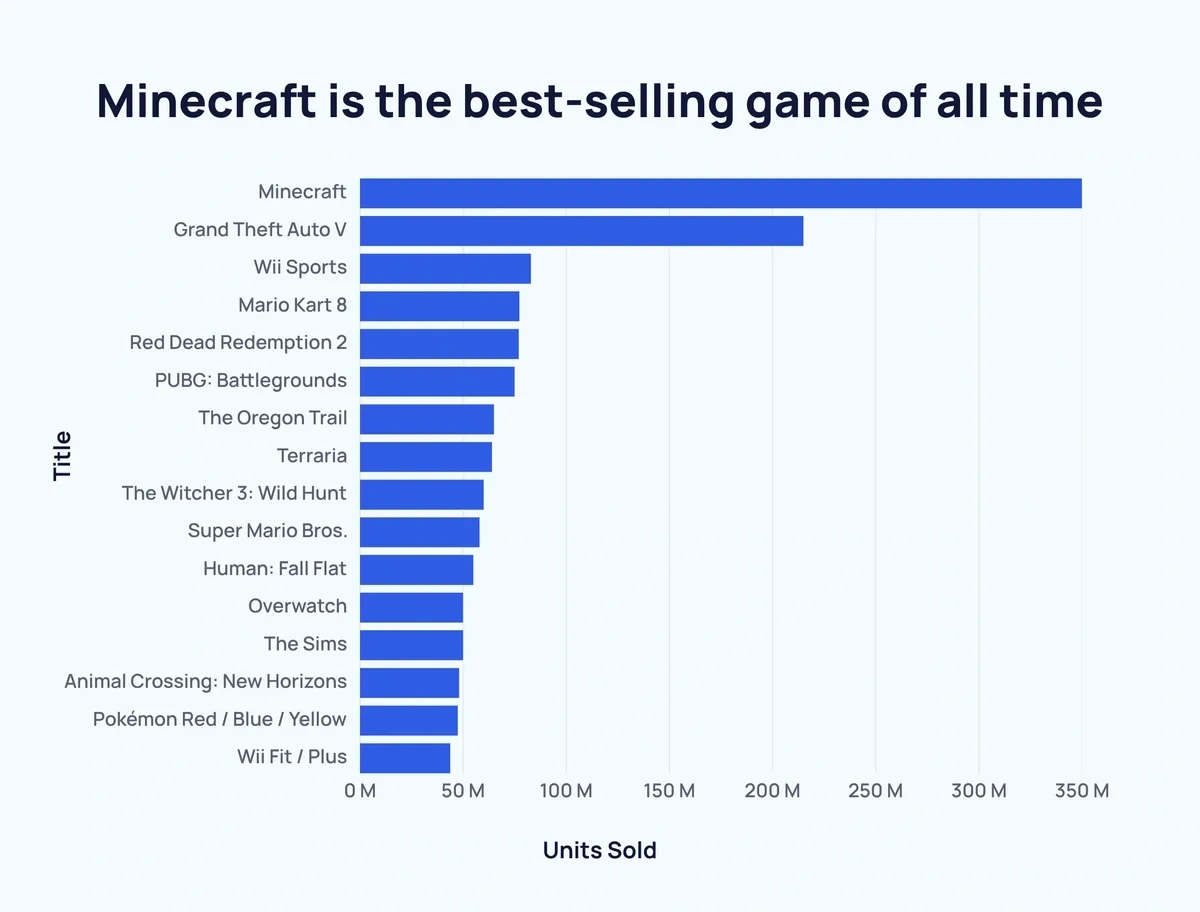
Various Nintendo titles also feature in the list, although that's largely down to bundling.
For instance, Wii Sports was the default game that came with a Wii console purchase for many years.
Here’s the top 20 list of best-selling video games of all time:
| Rank | Title | Publisher | Units Sold (Million) | Year of Release |
| #1 | Minecraft | Mojang Studios | 350 | 2011 |
| #2 | Grand Theft Auto V | Rockstar Games | 215 | 2013 |
| #3 | Wii Sports | Nintendo | 82.9 | 2006 |
| #4 | Mario Kart 8/Deluxe | Nintendo | 77.32 | 2014 |
| #5 | Red Dead Redemption 2 | Rockstar Games | 77 | 2018 |
| #6 | PUBG: Battlegrounds | Krafton | 75 | 2017 |
| #7 | The Oregon Trail | MECC | 65 | 1971 |
| #8 | Terraria | Re-Logic/505 Games | 64 | 2011 |
| #9 | The Witcher 3: Wild Hunt | CD Projekt | 60 | 2015 |
| #10 | Super Mario Bros. | Nintendo | 58 | 1985 |
| #11 | Human: Fall Flat | Curve Digital | 55 | 2016 |
| #12= | Overwatch | Blizzard Entertainment | 50 | 2016 |
| #12= | The Sims | Electronic Arts | 50 | 2000 |
| #14 | Animal Crossing: New Horizons | Nintendo | 48.19 | 2020 |
| #15 | Pokémon Red / Blue / Yellow | Nintendo | 47.44 | 1996 |
| #16 | Wii Fit/Plus | Nintendo | 43.8 | 2007 |
| #17 | Call of Duty: Black Ops III | Activision | 43 | 2015 |
| #18= | Call of Duty: Modern Warfare | Activision | 41 | 2019 |
| #18= | Stardew Valley | Chucklefish/Concerned Ape | 41 | 2016 |
| #20= | Payday 2 | 505 Games | 40 | 2013 |
| #20= | Sonic the Hedgehog | Sega | 40 | 1991 |
Mario Kart 8 Deluxe is the Switch's best-selling game (Nintendo)
Mario Kart 8 Deluxe is the best-selling Switch game of all time with 68.86 million copies sold.
The game has outsold Animal Crossing: New Horizons (48.19 million).
Here's a look at the top 10 best-selling Nintendo Switch titles as of June 30, 2025:
| Rank | Title | Developer | Release | Sales |
| 1 | Mario Kart 8 Deluxe | Nintendo EAD/EPD | 2017 | 68.86 million |
| 2 | Animal Crossing: New Horizons | Nintendo | 2020 | 48.19 million |
| 3 | Super Smash Bros. Ultimate | Bandai Namco/Sora | 2018 | 36.55 million |
| 4 | The Legend of Zelda: Breath of the Wild | Nintendo EPD | 2017 | 33.04 million |
| 5 | Super Mario Odyssey | Nintendo EPD | 2017 | 29.5 million |
| 6 | Pokémon Scarlet/ Pokémon Violet | Game Freak | 2022 | 27.15 million |
| 7 | Pokémon Sword/ Pokémon Shield | Game Freak | 2019 | 26.84 million |
| 8 | The Legend of Zelda: Tears of the Kingdom | Nintendo EPD | 2023 | 21.93 million |
| 9 | Super Mario Party | NDCube | 2018 | 21.19 million |
| 10 | New Super Mario Bros. U Deluxe | Nintendo EAD | 2019 | 18.36 million |
League of Legends is the most watched video game on Twitch (TwitchTracker)
Streaming trends show that League of Legends was the most-watched game on Twitch weekly. Data comes from a typical week in October 2025.
"Just chatting" was actually the most popular category of Twitch stream, at 52.4 million weekly hours.
But the most popular game was League of Legends, with 31 million viewing hours. Grand Theft Auto V was next, at 12.8 million hours, followed by Counter-Strike.
EA FC 26 was the only sports game to feature in the top 20, receiving 5.81 million weekly viewing hours.
Puzzle games are the most-played type of video game among Millennials and older in the US (Entertainment Software Association)
Among Millennials and older generations, puzzle games are the most popular format.
73% of Boomers/Silent Generation gamers play puzzle games, as do 71% of Gen X. By comparison, only 20% of the oldest gamers play arcade/other games.
66% of Gen Alpha also play puzzle games, but arcade/other is narrowly more popular (67%).
Gen Z is the only generation to prefer shooters above all else.
Video Game Innovations Statistics
The majority of PlayStation game purchases worldwide made digitally (Sony)
For the quarter ending March 31, 2025, 80% of all PlayStation 4 and PlayStation 5 software sales were digital purchases. That was a 3% YoY increase.
For the full year 2024, 76% of sales were digital. That was a 6% YoY increase.
Video game subscriptions are worth nearly $5 billion worldwide (Grandview Research)
Video game subscriptions ("Games as a Service") are one of the fastest-growing segments within the industry.
Between 2025 and 2030, GaaS is expected to grow at a CAGR of 24.9%.
GaaS is already a $4.91 billion market.
The global virtual reality (VR) gaming market is worth approximately $3.6 billion (Statista)
Virtual reality (VR) has not fully taken off in the way that many anticipated. According to Counterpoint, headset sales declined last year for the third consecutive year.
Nevertheless, VR remains a significant part of the gaming market, generating an estimated $3.6 billion in 2024.
Esports Growth Statistics
Annual global Esports revenue is now over $4.8 billion (Statista)

The global Esports market revenue generates $4.8 billion globally in 2025.
It's growing at a CAGR of 5.56%. If this continues, the sector will be worth $5.9 billion by 2029.
Interestingly, Esports betting is the largest part of the market, accounting for $2.8 billion.
Esports events have given out over $1.6 billion in prize money (e-Sports Earnings)
Across nearly 62,000 tracked Esports tournaments, players have been awarded $1.68 billion in prize money.
Johan Sundstein has the highest overall career earnings, at more than $7.1 million. 10 players have made at least $5 million in career Esports earnings.
The Esports World Cup in 2025 set the record for the highest single-tournament prize pool, at over $70 million.
Dota 2 contributed the most Esports prize money in the first half of 2025 (eSports Earnings)
From January to June 2025, Dota 2 tournaments gave out $6.84 million in prize money.
Counter-Strike 2 was the next-biggest earner for Esports players, paying out $4.93 million.
39 of the top 40 all-time Esports earners have won 99% or more of their earnings from Dota 2.
There are an estimated 772 million Esports viewers worldwide (Statista)
Esports is a fast-growing segment in the gaming industry. And this is reflected in global viewership numbers.
Worldwide, 772 million people are believed to watch Esports. A further 169 million viewers are projected by 2029.
Several Esports organizations are worth over $200 million (CrustLab)
The boom in Esports interest has led to increasing values in Esports organizations.
The elite Esports organizations can now rival major sports teams in terms of value. TSM is valued at an estimated $540 million.
The top 10 Esports teams all have estimated values in excess of $200 million. Team Liquid has the highest all-time earnings, at $56.3 million.
Conclusion
That’s all for our round-up of up-to-date gaming industry stats for 2025.
It’s clear the video game industry is going from strength to strength. And shows no signs of slowing down.
Considering how huge the industry already is, it's hard to imagine it growing. But with new platforms launching (the PS6 is scheduled for mid-2027) and Esports going even more mainstream, there's little doubt that the space will see upward growth over the next 4-5 years.
If you enjoyed reading our video game industry stats, here's a list of growing video game startups.
Stop Guessing, Start Growing 🚀
Use real-time topic data to create content that resonates and brings results.

Exploding Topics is owned by Semrush. Our mission is to provide accurate data and expert insights on emerging trends. Unless otherwise noted, this page’s content was written by either an employee or a paid contractor of Semrush Inc.
Share
Newsletter Signup
By clicking “Subscribe” you agree to Semrush Privacy Policy and consent to Semrush using your contact data for newsletter purposes
Written By


Josh is the Co-Founder and CTO of Exploding Topics. Josh has led Exploding Topics product development from the first line of co... Read more