


Get Advanced Insights on Any Topic
Discover Trends 12+ Months Before Everyone Else
How We Find Trends Before They Take Off
Exploding Topics’ advanced algorithm monitors millions of unstructured data points to spot trends early on.

Keyword Research
Performance Tracking
Competitor Intelligence
Fix Your Site’s SEO Issues in 30 Seconds
Find technical issues blocking search visibility. Get prioritized, actionable fixes in seconds.
Powered by data from
Latest Blog Posts
Featured Case Studies
See what's trending before everyone else
Each week, we'll send you our best Exploding Topics. Plus, expert insight and analysis.
Video Streaming Services Stats (2025)

The video streaming market is now valued at over $670 billion. And is expected to continue growing to over $2.49 trillion by 2032, at a CAGR of 17.8%.
With that, the list of unique titles has surpassed 800,000 in the US alone. And the number of streaming platforms continues to rise.
Below, we’ll dive deeper into more video streaming service statistics.
Video Streaming Services (Top 5 Stats)
- 36% of all TV usage is dedicated to streaming
- There are approximately 1.8 billion subscriptions to video streaming services
- 26% of viewers admit to binge-watching at least once a week
- Netflix has well over 200 million subscribers worldwide
- Ted Lasso was the most-streamed program of 2023 (16.9 billion minutes)
Build a winning strategy
Get a complete view of your competitors to anticipate trends and lead your market
Video Streaming Market Share
Streaming is now more popular than either cable or broadcast, demanding 36% of total TV usage.
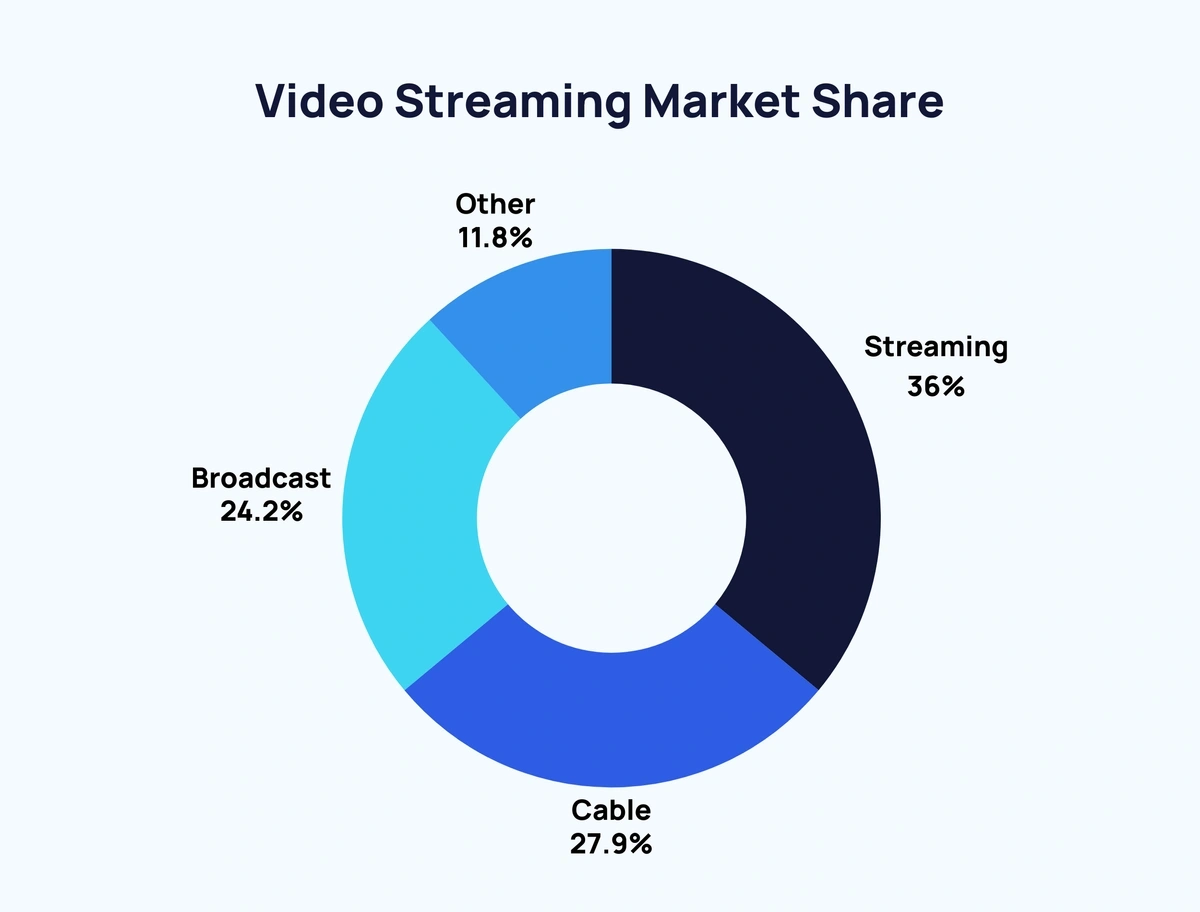
This is how the digital media landscape looks as of 2025:
| Medium | Proportion of Viewers |
| Streaming | 36% |
| Cable | 27.9% |
| Broadcast | 24.2% |
| Other | 11.8% |
Source: Nielsen
Video Streaming Users
The number of video streaming service users has grown significantly in recent years.
In 2020, Forbes estimated that there were 1.1 billion subscriptions to online video streaming services worldwide.
As of 2025, that figure is closer to 1.8 billion.
User penetration sits at around 17% in 2025. By 2027, the figure is expected to reach 20.7%.
In fact, 83% of US households have at least one streaming service subscription. That’s a significant increase from 2015’s 52%.
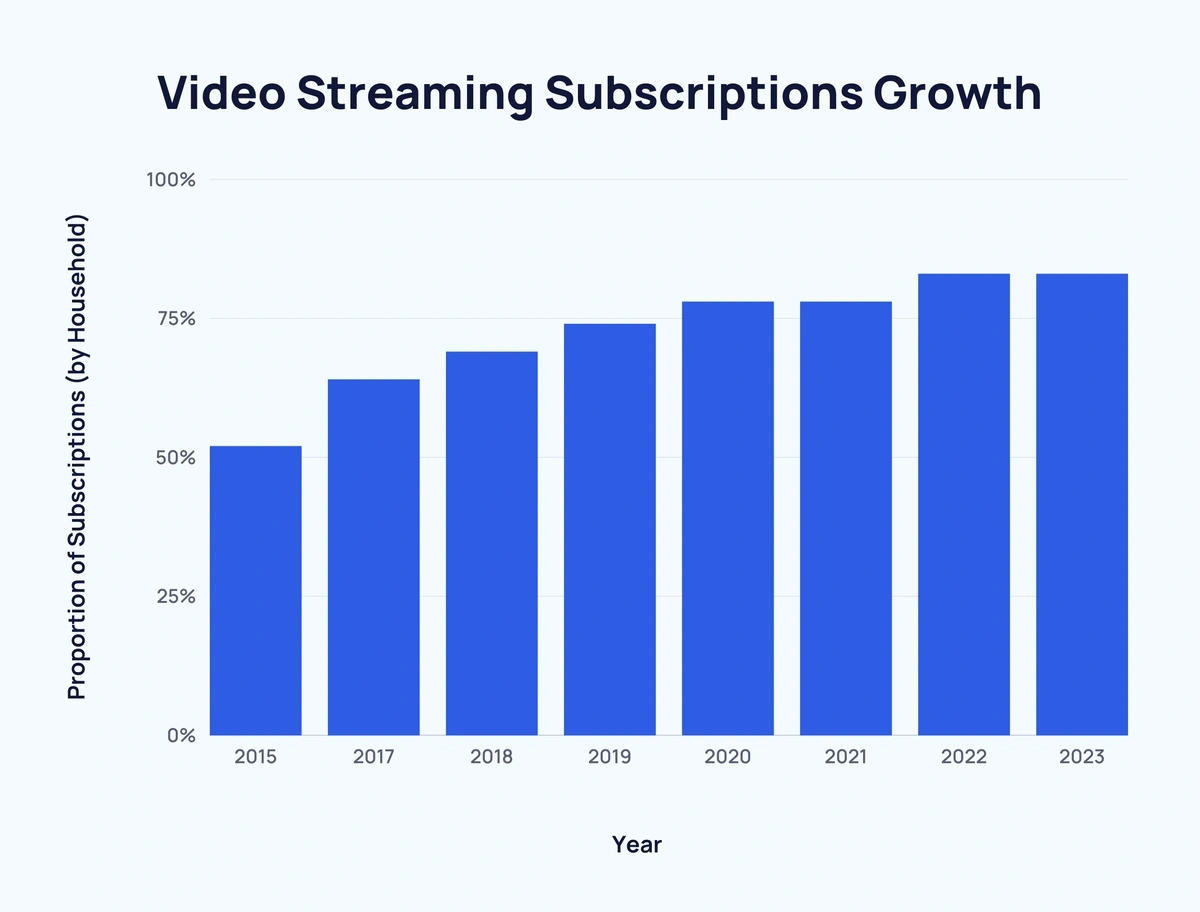
Here’s how video streaming subscriptions have grown over time in the US:
| Year | Proportion of Subscriptions (by Household) |
| 2015 | 52% |
| 2017 | 64% |
| 2018 | 69% |
| 2019 | 74% |
| 2020 | 78% |
| 2021 | 78% |
| 2022 | 83% |
| 2023 | 83% |
And here’s how the digital media landscape has changed over recent months:
| Month, Year | Streaming | Cable | Broadcast | Other |
| Dec, 2021 | 27.7% | 37.3% | 26.1% | 8.9% |
| Jan 2022 | 28.9% | 35.6% | 26.4% | 9.1% |
| Feb 2022 | 28.7% | 35.4% | 26% | 10% |
| Mar 2022 | 29.7% | 36.9% | 24.9% | 8.4% |
| Apr 2022 | 30.4% | 36.8% | 24.7% | 8.2% |
| May 2022 | 31.9% | 36.5% | 24.4% | 7.2% |
| Jun 2022 | 33.7% | 35.1% | 22.4% | 8.8% |
| Jul 2022 | 34.8% | 34.4% | 21.6% | 9.2% |
| Aug 2022 | 35% | 34.5% | 22.1% | 8.5% |
| Sep 2022 | 36.9% | 33.8% | 24.2% | 5.1% |
| Oct 2022 | 37.3% | 32.9% | 26% | 3.8% |
| Nov 2022 | 38.2% | 31.8% | 25.7% | 4.3% |
| Dec 2022 | 38.1% | 30.9% | 24.7% | 6.3% |
| Jan 2023 | 32.8% | 30.4% | 24.9% | 11.9% |
| Feb 2023 | 34.3% | 30.2% | 23.8% | 11.7% |
| Mar 2023 | 34.1% | 31.1% | 23.3% | 11.6% |
| Apr 2023 | 34% | 31.5% | 23.1% | 11.5% |
| May 2023 | 36.4% | 31.1% | 22.8% | 9.7% |
| Jun 2023 | 37.7% | 30.6% | 20.8% | 10.9% |
| Jul 2023 | 38.7% | 29.6% | 20% | 11.6% |
| Aug 2023 | 38.3% | 30.2% | 20.4% | 11.1% |
| Sep 2023 | 37.5% | 29.8% | 23% | 9.6% |
| Oct 2023 | 36.6% | 29.5% | 24.6% | 9.3% |
| Nov 2023 | 36.1% | 28.3% | 24.9% | 10.7% |
| Dec 2023 | 35.9% | 28.2% | 23.5% | 12.5% |
| Jan 2024 | 36% | 27.9% | 24.2% | 11.8% |
Sources: Statista, Forbes, EarthWeb, Nielsen, Leichtman Research Group
Video Streaming User Activity
On average, Americans spend 13 hours and 11 minutes per day using digital media.
According to Forbes, 3 hours and 6 minutes of that time is spent streaming video.
And that’s only likely to increase based on consumer demand.
A recent survey revealed that 72% of Americans love their user experience with video streaming services. And 93% intend to either maintain or increase their streaming options.
When considering new video streaming platforms, cost and ease of use rank as the most important considerations.
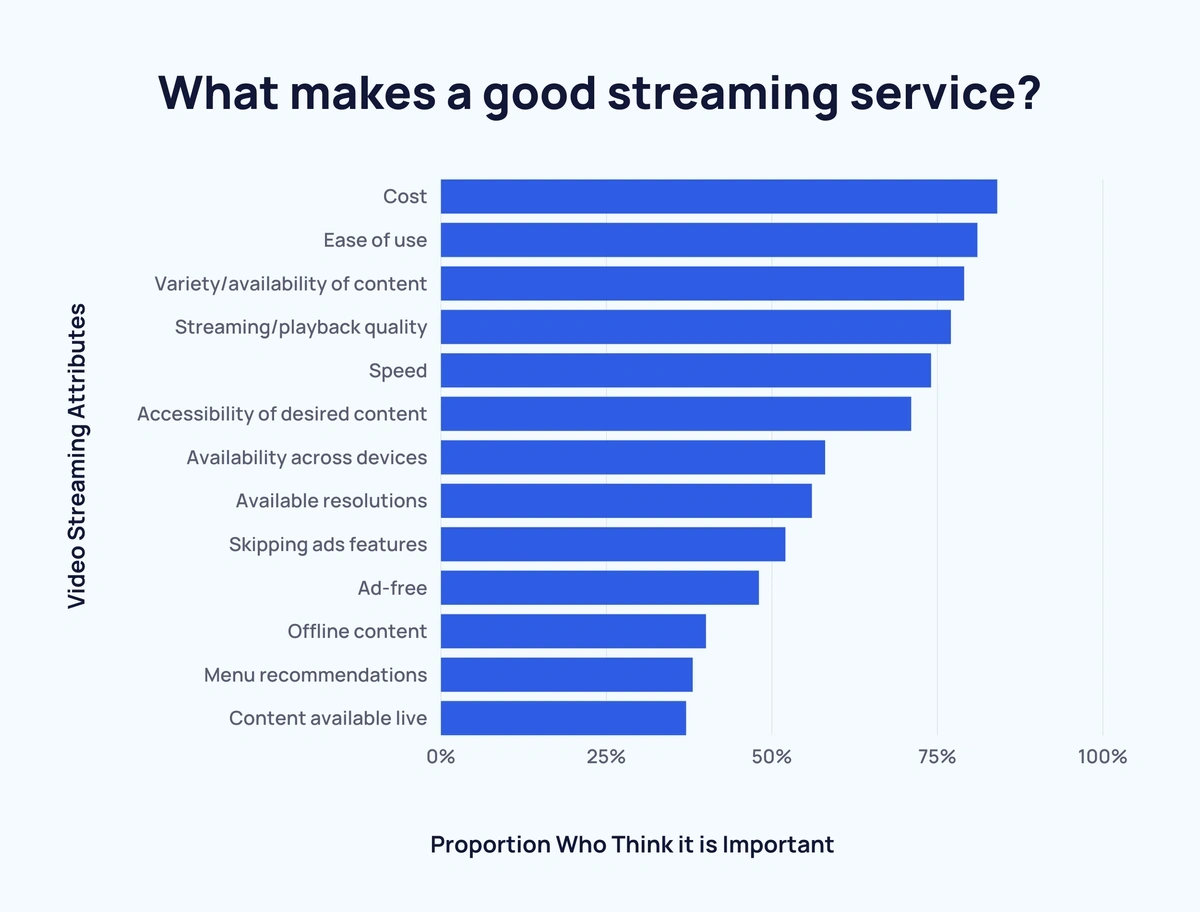
Here’s a breakdown of what video streaming users find important:
| Video Streaming Attributes | Proportion Who Think it is Important |
| Cost | 84% |
| Ease of use | 81% |
| Variety/availability of content | 79% |
| Streaming/playback quality | 77% |
| Speed (menu selection, loading content) | 74% |
| Accessibility/search of desired content | 71% |
| Availability across devices | 58% |
| Resolution available (4k Ultra HD, HD) | 56% |
| Skipping ads features | 52% |
| Ad-free | 48% |
| Content available for downloading/offline | 40% |
| Menu recommendations | 38% |
| Content available live | 37% |
The most common reason (28% agree) to stick with a video streaming service is the ability to switch to a cheaper, ad-supported version of the same service.
This is closely followed by exclusive content desired by the user (27%).
Here’s the full list of reasons to stick with a video streaming service:
| Most Likely Reasons to Stick with an SVOD | Percentage Who Agree |
| Being able to switch to a reduced-cost, ad-supported version of the service | 28% |
| The release of an exclusive new movie or series I want to watch | 27% |
| The ability to purchase new movie releases at the same time they are released in theatres | 23% |
| Ability to add more profiles, so multiple people can watch at the same time under the same account | 22% |
| Ability to download and watch content offline | 17% |
| Getting discounts on related merchandise and entertainment | 18% |
| Ability to watch shows and movies together with others through a social platform | 18% |
| None of the above | 9% |
Around 1 in 4 (26%) users binge-watch on video streaming services at least once a week.
Below, is a a breakdown of binge-watching user habits for video streaming platforms:
| Frequency | Proportion who binge-watch |
| Pretty much every day | 19% |
| At least once a week | 26% |
| Several times per month | 20% |
| Once a month | 14% |
| Several times per year | 20% |
Adverts are becoming increasingly commonplace on video streaming platforms. As such, ad experience is worth noting.
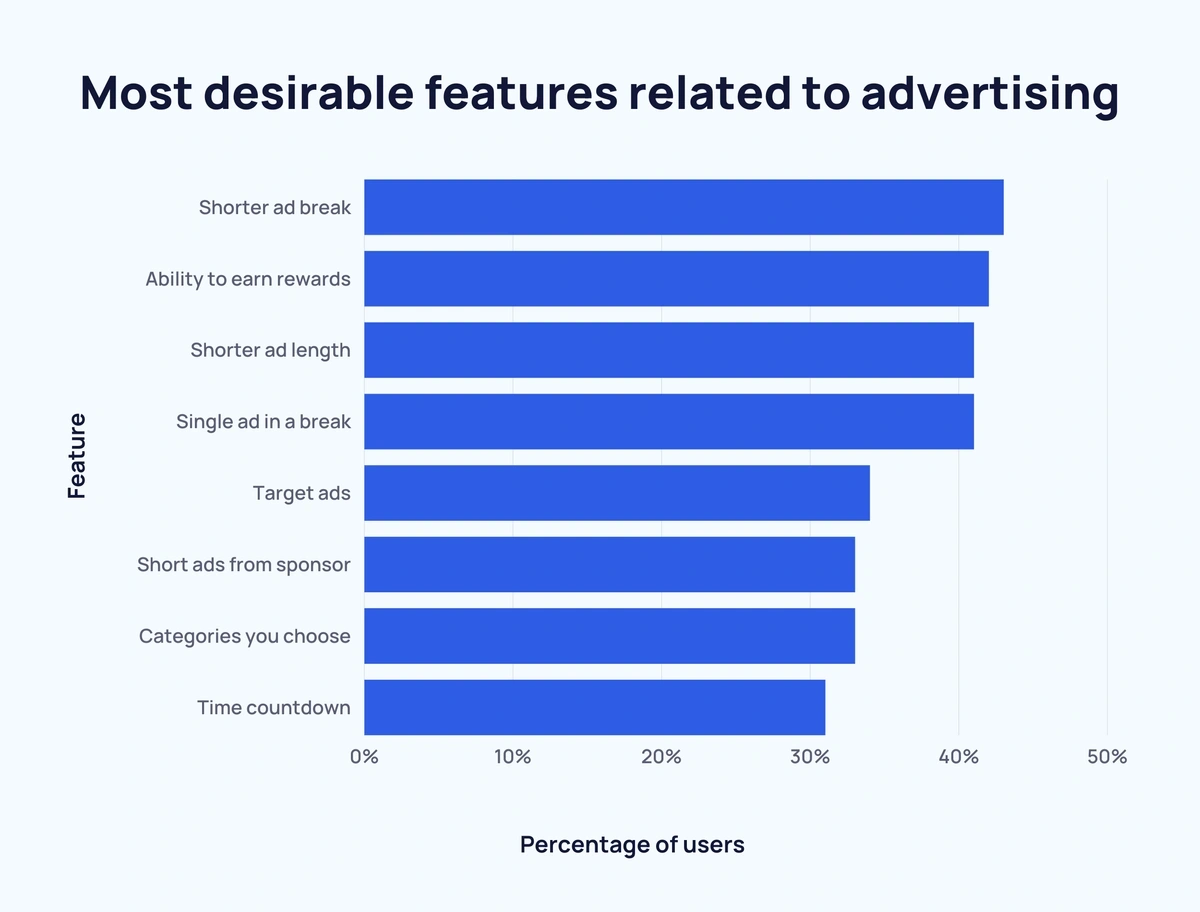
Here are the most desirable features related to advertising according to users:
| Feature | Percentage of users |
| Shorter ad break | 43% |
| Ability to earn rewards | 42% |
| Shorter ad length | 41% |
| Single ad in a break | 41% |
| Target ads | 34% |
| Short ads from sponsor | 33% |
| Categories you choose | 33% |
| Time countdown | 31% |
Sources: Forbes, Nielsen, Civic Science, Marking Dive
Generational Differences in Video Streaming
Younger generations (Gen Z - 57%, Millennials - 62%) are more likely to cancel video streaming subscriptions than older generations (Gen X - 43%, Boomers and older - 24%).
However, younger generations (Gen Z - 38%, Millennials - 43%) are also more likely to change their minds and renew a recently canceled subscription than older generations (Gen X - 20%, Boomers and older - 7%).
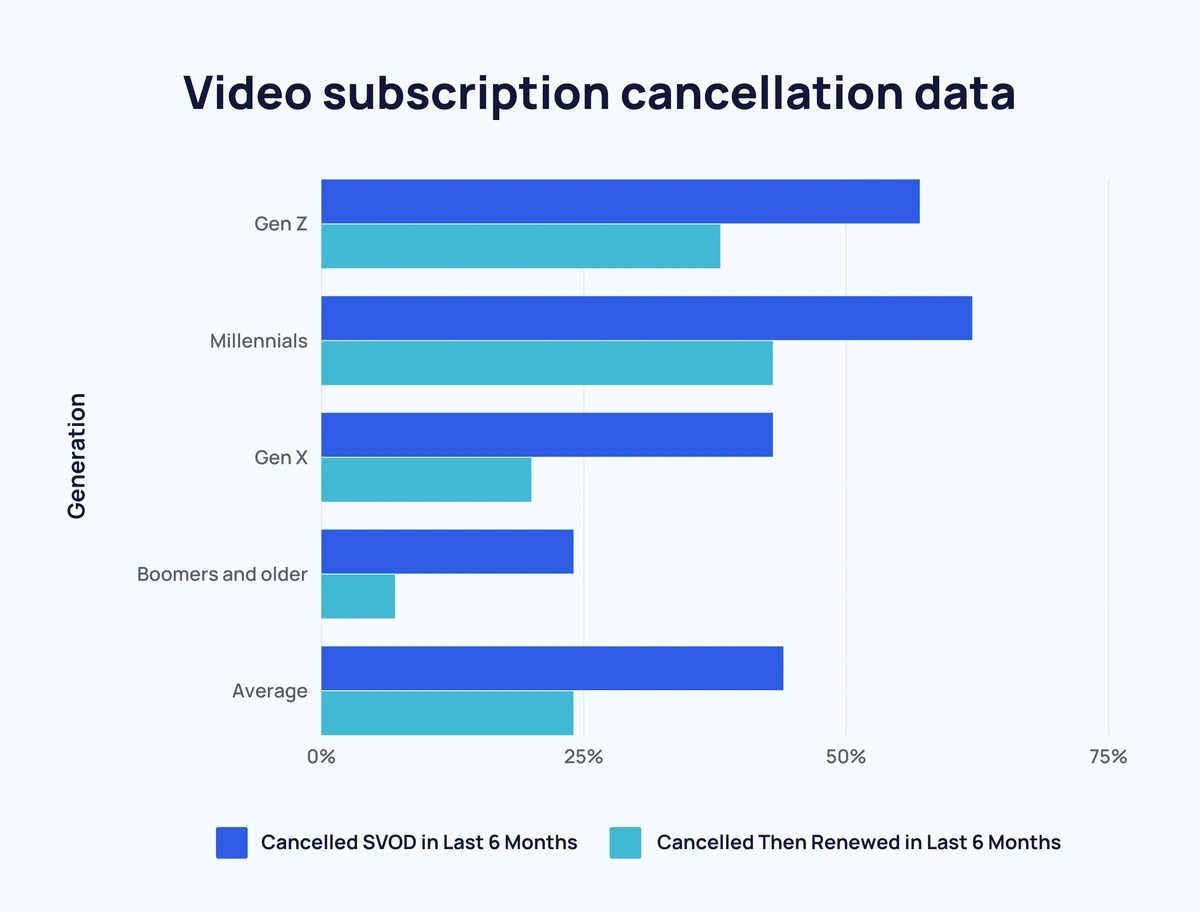
Here’s the video subscription cancellation data in full:
| Generation | Canceled SVOD in Last 6 Months | Canceled Then Renewed in Last 6 Months |
| Gen Z | 57% | 38% |
| Millennials | 62% | 43% |
| Gen X | 43% | 20% |
| Boomers and older | 24% | 7% |
| Average | 44% | 24% |
Across the board, Millennials are the most likely generation to make changes to their video streaming subscriptions.
On the other end of the scale, Boomers and older are the least likely generation to make any sort of change to their video streaming subscriptions.
Here’s a breakdown of generational differences between video streaming subscription changes:
| Change Made in Last 6 Months | Generation | ||||
| Gen Z | Millennials | Gen X | Boomers and older | Average | |
| Cancelled a paid entertainment subscription to save money | 30% | 32% | 30% | 15% | 26% |
| Dropped at least one paid entertainment subscription and switched to a free ad-supported service | 21% | 31% | 19% | 8% | 19% |
| Signed up for a bundle of entertainment services to lower overall subscription costs | 17% | 18% | 14% | 4% | 13% |
| Added a paid entertainment subscription to replace other higher-cost entertainment activities | 13% | 15% | 14% | 6% | 12% |
| Switched from a higher-cost, ad-free entertainment subscription to a lower-cost, ad-supported version of that subscription | 16% | 18% | 10% | 4% | 11% |
| Have made at least one of these changes | 54% | 66% | 51% | 25% | 47% |
Binge-watching differences between generations are perhaps not as pronounced as you may have imagined.
The most likely age bracket to binge-watch is 30 to 44-year-olds (70%), closely followed by 18 to 29-year-olds (69%).
While teenagers may be accused of binge-watching, 45 to 64-year-olds are actually more likely (62% compared to 60% of 13 to 17-year-olds) to do so.
Finally, around 2 in 5 (41%) of those aged 65+ admit to binge-watching programs.
Here are the binge-watching stats by age bracket in full:
| Age Bracket | Binge-watchers | Non-binge watchers |
| 13-17 years | 60% | 40% |
| 18-29 years | 69% | 31% |
| 30-44 years | 70% | 30% |
| 45-64 years | 62% | 38% |
| 65+ | 41% | 59% |
Sources: Deloitte, Civic Science
Video Streaming Players
Netflix remains the biggest player in the video streaming space with over 260 million subscribers as of 2025.

Not only that, Netflix generates 1.3 billion website visits each monthly according to the latest Exploding Topics data.
Nonetheless, the media giant is losing ground.
Disney+ has accumulated 157 million subscribers as of May 2023. And Amazon Prime Video has over 117 million subscribers. Max now has around 97 million subscribers, while Paramount+ ended 2022 with approximately 60 million.
Meanwhile, the leading Chinese streaming service iQIYI has 128.9 million subscribers as of Q1 2023.
Here’s how Netflix’s user base has progressed over time:
| Year | Netflix Users | Change Over Previous Year |
| 2013 | 41.4 million | - |
| 2014 | 54.5 million | ↑ 13.1 million |
| 2015 | 70.8 million | ↑ 16.3 million |
| 2016 | 89.1 million | ↑ 18.3 million |
| 2017 | 110.6 million | ↑ 21.5 million |
| 2018 | 139.3 million | ↑ 28.7 million |
| 2019 | 167.1 million | ↑ 27.8 million |
| 2020 | 203.7 million | ↑ 36.6 million |
| 2021 | 221.8 million | ↑ 18.1 million |
| 2022 | 230.8 million | ↑ 9 million |
| 2023 | 238.4 million | ↑ 7.6 million |
| 2024 | 260 million | ↑ 21.6 million |
Amazon Prime Video is possibly Netflix’s biggest competitor when it comes to users.
Here’s how their user base has changed over time (including projection):
| Year | Amazon Prime Members | Change Over Previous Year |
| 2013 | 25 million | - |
| 2014 | 40 million | ↑ 15 million |
| 2015 | 54 million | ↑ 14 million |
| 2016 | 65 million | ↑ 11 million |
| 2017 | 99.7 million | ↑ 34.7 million |
| 2018 | 112.1 million | ↑ 12.4 million |
| 2019 | 124 million | ↑ 11.9 million |
| 2020 | 142.5 million | ↑ 17.5 million |
| 2021 | 151.9 million | ↑ 9.4 million |
| 2022 | 157.4 million | ↑ 5.5 million |
| 2023 | 161.7 million | ↑ 4.3 million |
| 2024 | 165 million | ↑ 3.3 million |
| 2025 | 168.3 million | ↑ 3.3 million |
Netflix is one of the most expensive video streaming services out there.
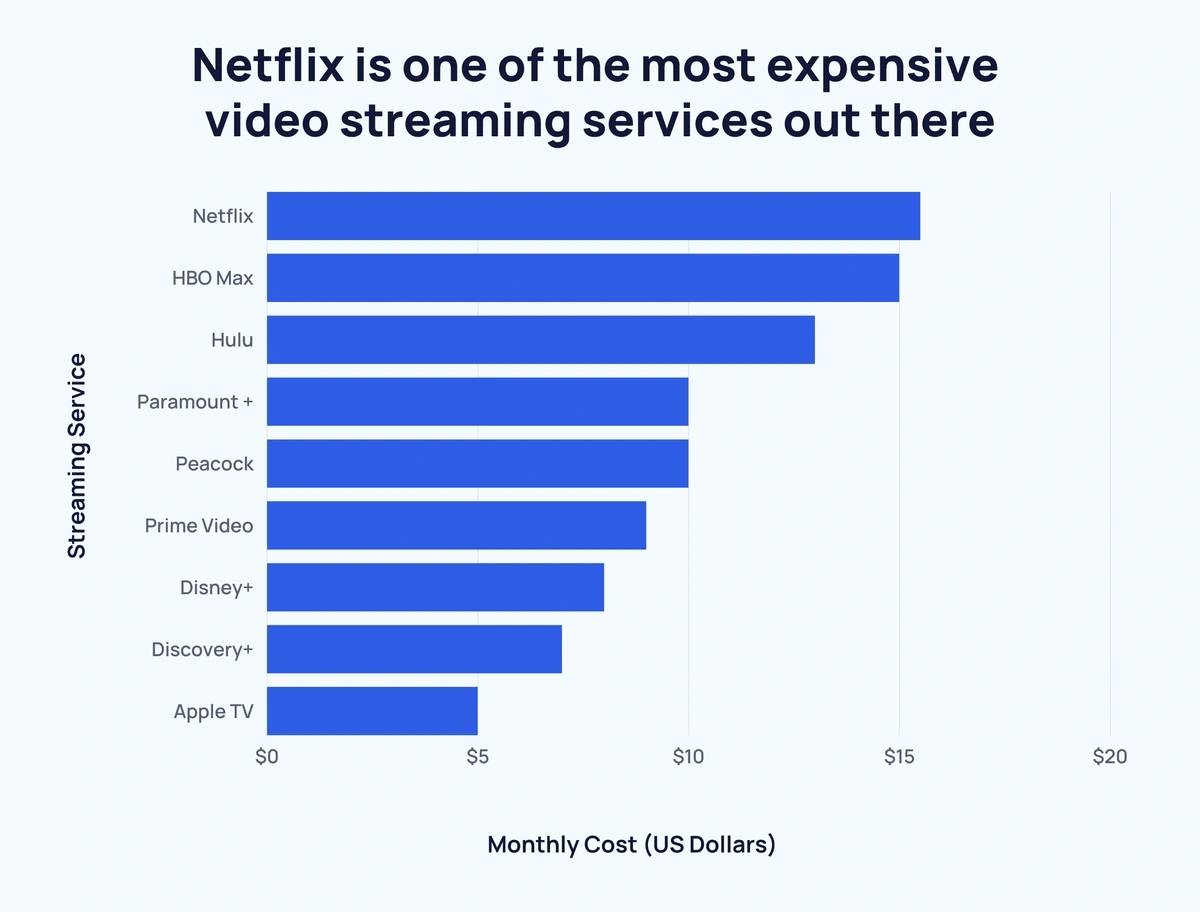
This is how it compares to other popular video streaming services according to the latest data:
| Streaming Service | Monthly Cost |
| Netflix | $15.49 |
| HBO Max | $14.99 |
| Hulu | $12.99 |
| Paramount + | $9.99 |
| Peacock | $9.99 |
| Prime Video | $8.99 |
| Disney+ | $7.99 |
| Discovery+ | $6.99 |
| Apple TV | $4.99 |
And here’s how the top video streaming platforms compare in terms of market share over time:
| Month, Year | Netflix | YouTube | Hulu | Amazon | Disney+ |
| Dec 2021 | 6.4% | 5.8% | 3% | 2.1% | 1.6% |
| Jan 2022 | 6.6% | 5.7% | 3% | 2.4% | 1.8% |
| Feb 2022 | 6.4% | 5.7% | 3% | 2.3% | 1.7% |
| Mar 2022 | 6.6% | 6% | 3.3% | 2.3% | 1.8% |
| Apr 2022 | 6.6% | 6.1% | 3.3% | 2.5% | 1.7% |
| May 2022 | 6.8% | 6.7% | 3.4% | 2.6% | 1.7% |
| Jun 2022 | 7.7% | 6.9% | 3.3% | 2.9% | 2% |
| Jul 2022 | 8% | 7.3% | 3.6% | 3% | 1.8% |
| Aug 2022 | 7.6% | 7.6% | 3.7% | 2.9% | 1.9% |
| Sep 2022 | 7.3% | 8% | 3.8% | 2.9% | 1.9% |
| Oct 2022 | 7.2% | 8.5% | 4% | 2.8% | 2% |
| Nov 2022 | 7.6% | 8.8% | 3.9% | 2.6% | 2% |
| Dec 2022 | 7.5% | 8.7% | 3.4% | 2.7% | 1.9% |
| Jan 2023 | 7.5% | 7.3% | 3.2% | 2.9% | 1.7% |
| Feb 2023 | 7.3% | 7.9% | 3.3% | 3% | 1.8% |
| Mar 2023 | 7.3% | 7.8% | 3.3% | 2.9% | 1.8% |
| Apr 2023 | 6.9% | 8.1% | 3.3% | 2.8% | 1.8% |
| May 2023 | 7.9% | 8.5% | 3.7% | 3.1% | 1.8% |
| Jun 2023 | 8.2% | 8.8% | 3.5% | 3.2% | 2% |
| Jul 2023 | 8.1% | 9.2% | 3.6% | 3.4% | 2% |
| Aug 2023 | 8.2% | 9.1% | 3.6% | 3.4% | 3% |
| Sep 2023 | 7.8% | 9% | 3.6% | 3.6% | 1.9% |
| Oct 2023 | 7.2% | 9.1% | 3.1% | 3.6% | 1.9% |
| Nov 2023 | 7.4% | 9% | 2.7% | 3.4% | 1.9% |
| Dec 2023 | 7.7% | 8.5% | 2.6% | 3.3% | 1.9% |
| Jan 2024 | 7.9% | 8.6% | 2.7% | 2.8% | 1.9% |
Finally, here is a comparison of global traffic data for the top video streaming platforms.
| Streaming Service | Monthly Visits | Unique Visitors |
| Netflix | 1.2 billion | 146.6 million |
| HBO Max | 178.9 million | 27.4 million |
| Hulu | 77.5 million | 16.5 million |
| Paramount + | 43.1 million | 10.1 million |
| Peacock | 28.3 million | 7.2 million |
| Prime Video | 218.1 million | 55.1 million |
| Disney+ | 240.1 million | 43.1 million |
| Discovery+ | 6.6 million | 1.6 million |
| Apple TV | 27.2 million | 13.8 million |
Sources: Arstechnica, DigitalVEurope, Netflix, Backlinko, The Small Business Blog, Business Insider, Forbes, Nielsen, Semrush
Popular Media for Video Streaming
Apple TV+’s Ted Lasso was the most-streamed program in 2023 with around 16.9 billion minutes of streaming. That's a significant drop from 2022's top program Stranger Things (52 billion minutes streamed).
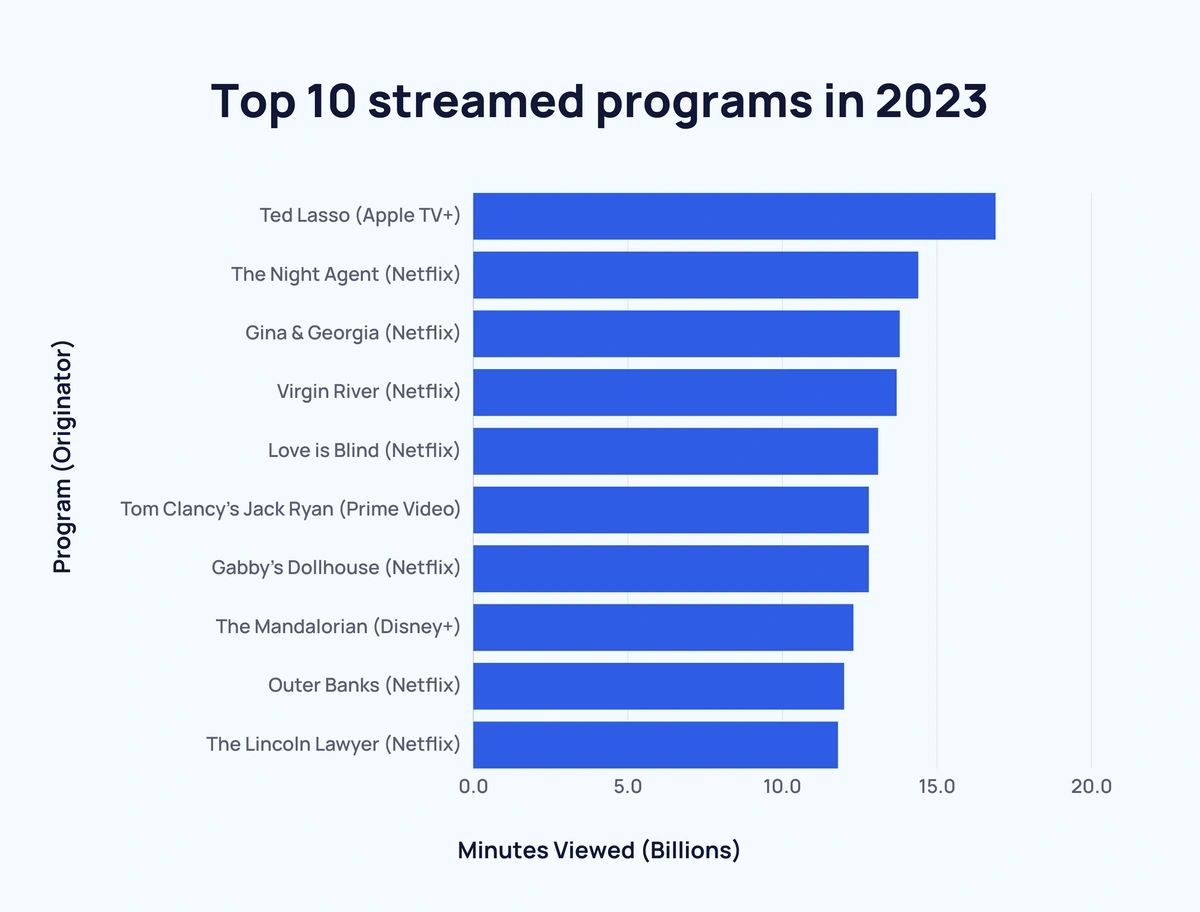
Here’s a look at the top 10 streamed programs for 2022 and 2023:
| 2022 Rank | Program | Originator | Episodes | Mins Viewed |
| 1 | Stranger Things | Netflix | 34 | 52 billion |
| 2 | NCIS | Various | 356 | 38.1 billion |
| 3 | Cocomelon | Netflix | 18 | 37.8 billion |
| 4 | Ozark | Netflix | 44 | 31.3 billion |
| 5 | Encanto | Disney+ | 1 | 27.4 billion |
| 6 | Grey’s Anatomy | Netflix | 396 | 26.8 billion |
| 7 | Criminal Minds | Various | 328 | 24.9 billion |
| 8 | Bluey | Disney+ | 114 | 21.1 billion |
| 9 | Gilmore Girls | Netflix | 153 | 20.8 billion |
| 10 | Seinfeld | Netflix | 176 | 19.3 billion |
| 2023 Rank | Program | Originator | Episodes | Mins Viewed |
| 1 | Ted Lasso | Apple TV+ | 34 | 16.9 billion |
| 2 | The Night Agent | Netflix | 10 | 14.4 billion |
| 3 | Ginny & Georgia | Netflix | 20 | 13.8 billion |
| 4 | Virgin River | Netflix | 54 | 13.7 billion |
| 5 | Love is Blind | Netflix | 70 | 13.1 billion |
| 6 | Tom Clancy's Jack Ryan | Prime Video | 30 | 12.8 billion |
| 7 | Gabby's Dollhouse | Netflix | 58 | 12.8 billion |
| 8 | The Mandalorian | Disney+ | 27 | 12.3 billion |
| 9 | Outer Banks | Netflix | 30 | 12 billion |
| 10 | The Lincoln Lawyer | Netflix | 20 | 11.8 billion |
Looking at original content, Netflix created each of the top 10 in 2022.
Here’s a breakdown of the most popular original video content on streaming platforms in 2022:
| Rank | Program | Originator | Episodes | Mins Viewed |
| 1 | Stranger Things | Netflix | 34 | 52 billion |
| 2 | Ozark | Netflix | 44 | 31.3 billion |
| 3 | Wednesday | Netflix | 8 | 18.6 billion |
| 4 | Cobra Kai | Netflix | 50 | 16.7 billion |
| 5 | Bridgerton | Netflix | 16 | 14 billion |
| 6 | Virgin River | Netflix | 42 | 13.6 billion |
| 7 | Dahmer | Netflix | 10 | 13.4 billion |
| 8 | Live is Blind | Netflix | 40 | 13.1 billion |
| 9 | Inventing Anna | Netflix | 9 | 12.9 billion |
| 10 | The Crown | Netflix | 50 | 12.7 billion |
| 11 | The Boys | Prime Video | 24 | 10.6 billion |
| 12 | Great British Baking Show | Netflix | 85 | 10.6 billion |
| 13 | The Umbrella Academy | Netflix | 30 | 10.5 billion |
| 14 | The Last Kingdom | Netflix | 46 | 10.4 billion |
| 15 | The Rings of Power | Prime Video | 8 | 9.4 billion |
Long-running crime drama NCIS tops the charts for most minutes streamed (approximately 38.09 billion) across all acquired programming.
Here’s a breakdown of the most popular acquired video content on streaming platforms in 2022:
| Rank | Program | Originator | Episodes | Mins Viewed |
| 1 | NCIS | Various | 356 | 38.09 billion |
| 2 | Cocomelon | Netflix | 18 | 37.85 billion |
| 3 | Grey’s Anatomy | Netflix | 396 | 26.78 billion |
| 4 | Criminal Minds | Various | 328 | 24.87 billion |
| 5 | Bluey | Disney+ | 114 | 21.1 billion |
| 6 | Gilmore Girls | Netflix | 153 | 20.8 billion |
| 7 | Seinfeld | Netflix | 176 | 19.3 billion |
| 8 | Supernatural | Netflix | 328 | 18.78 billion |
| 9 | Heartland | Netflix | 225 | 17.95 billion |
| 10 | The Simpsons | Disney+ | 667 | 15.87 billion |
| 11 | Friends | HBO Max | 236 | 14.54 billion |
| 12 | The Blacklist | Netflix | 196 | 14.01 billion |
| 13 | New Girl | Netflix | 146 | 13.97 billion |
| 14 | Spongebob Squarepants | Prime Video | 215 | 13.87 billion |
| 15 | Shameless | Netflix | 134 | 13.62 billion |
In terms of movies, Encanto was the top performer with 27.416 billion streamed minutes in 2022. That's more than double the amount of streaming minutes for 2023's top movie Moana (11.6 billion).
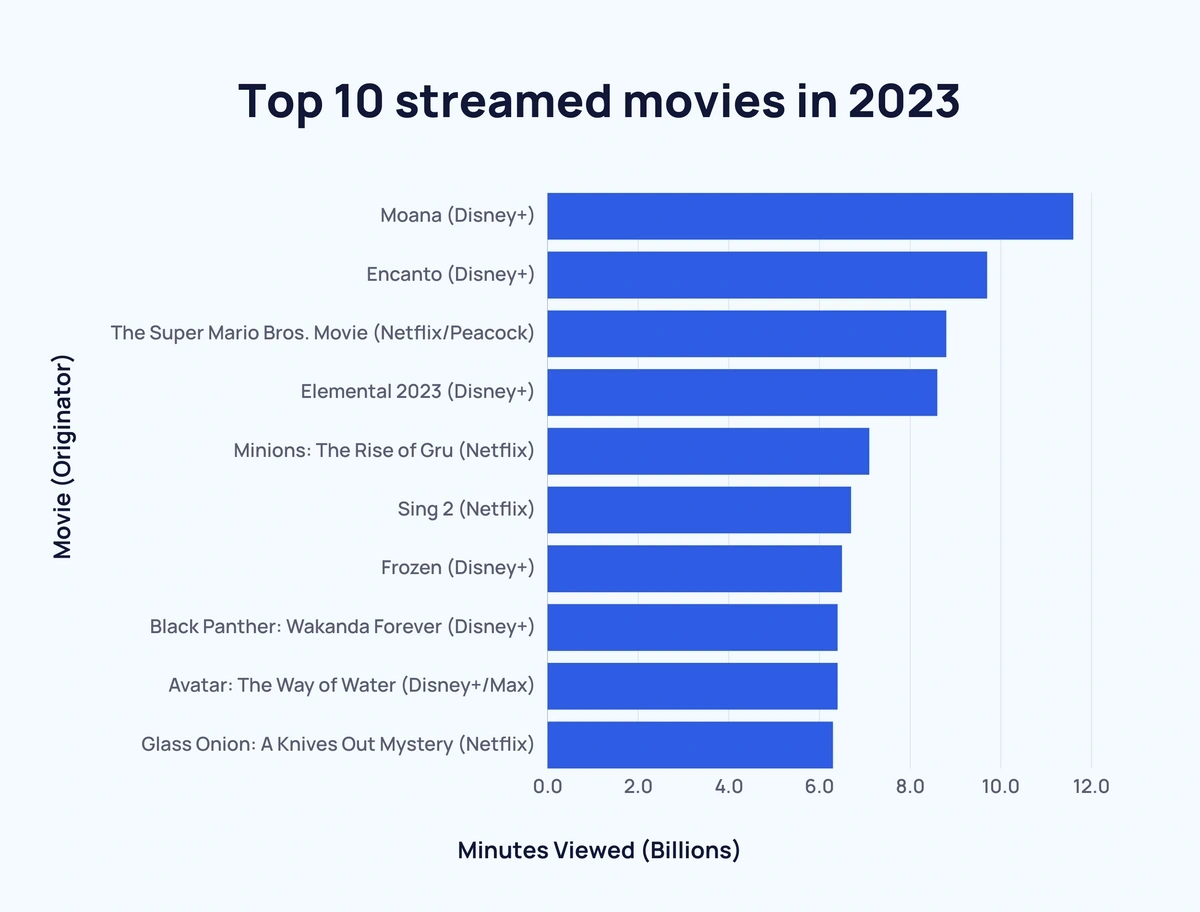
Here are the top movies for streaming minutes in 2022 and 2023:
| Rank | Movie | Originator | Mins Viewed |
| 1 | Encanto | Disney+ | 27.416 billion |
| 2 | Turning Red | Disney+ | 11.427 billion |
| 3 | Sing 2 | Netflix | 11.347 billion |
| 4 | Moana | Disney+ | 8.629 billion |
| 5 | The Adam Project | Netflix | 6.141 billion |
| 6 | Hocus Pocus 2 | Disney+ | 5.697 billion |
| 7 | Don’t Look Up | Netflix | 5.141 billion |
| 8 | Frozen | Disney+ | 5.133 billion |
| 9 | Luca | Disney+ | 4.974 billion |
| 10 | Gray Man, The | Netflix | 4.972 billion |
| Rank | Movie | Originator | Mins Viewed |
| 1 | Moano | Disney+ | 11.6 billion |
| 2 | Encanto | Disney+ | 9.7 billion |
| 3 | The Super Mario Bros. Movie | Netflix/Peacock | 8.8 billion |
| 4 | Elemental (2023) | Disney+ | 8.6 billion |
| 5 | Minions: Rise of Gru | Netflix | 7.1 billion |
| 6 | Sing 2 | Netflix | 6.7 billion |
| 7 | Frozen | Disney+ | 6.5 billion |
| 8 | Black Panther: Wakanda Forever | Disney+ | 6.4 billion |
| 9 | Avatar: The Way of Water | Disney+/Max | 6.4 billion |
| 10 | Glass Onion: A Knives Out Mystery | Netflix | 6.3 billion |
Source: Nielsen, Nielsen (2)
Conclusion
Video streaming has gone from strength to strength in recent years.
And that shows little sign of slowing down any time soon.
For more related content, take a look at 11 Huge Streaming Trends and The 7 Biggest Entertainment Trends.
Stop Guessing, Start Growing 🚀
Use real-time topic data to create content that resonates and brings results.

Exploding Topics is owned by Semrush. Our mission is to provide accurate data and expert insights on emerging trends. Unless otherwise noted, this page’s content was written by either an employee or a paid contractor of Semrush Inc.
Share
Newsletter Signup
By clicking “Subscribe” you agree to Semrush Privacy Policy and consent to Semrush using your contact data for newsletter purposes
Written By


Fabio is a research associate at Exploding Topics. Since 2021, Fabio has researched, written, and edited articles for the Explo... Read more