


Get Advanced Insights on Any Topic
Discover Trends 12+ Months Before Everyone Else
How We Find Trends Before They Take Off
Exploding Topics’ advanced algorithm monitors millions of unstructured data points to spot trends early on.

Keyword Research
Performance Tracking
Competitor Intelligence
Fix Your Site’s SEO Issues in 30 Seconds
Find technical issues blocking search visibility. Get prioritized, actionable fixes in seconds.
Powered by data from
Latest Blog Posts
Featured Case Studies
See what's trending before everyone else
Each week, we'll send you our best Exploding Topics. Plus, expert insight and analysis.
Number of Amazon Employees (2025)

As Amazon continues to grow as a multinational company, so has its workforce.
Today, millions of people use the E-commerce website every day. In May 2025, Amazon recieved 2.8 billion visits worldwide.
But how many people are employed by the American conglomerate?
We’ll explore that, and much more, below:
Contents
- Top Amazon Employees Statistics
- How Many Amazon Employees Are There?
- Number of Amazon Employees Over Time (Annually)
- Number of Amazon Employees Over Time (Monthly)
- Amazon Workforce by Gender
- Amazon Workforce by Ethnicity
- Amazon Workforce by Role
- Amazon Workforce by Age
Top Amazon Employees Statistics
-
Amazon employs over 1.55 million people
-
Since 2007, Amazon’s personnel has expanded by over 90x
-
Over half (56.8%) of Amazon’s workforce is male
-
About 1/3rd (31.9%) of Amazon employees are white
How Many Amazon Employees Are There?
According to Amazon’s latest Annual Report, Amazon employs approximately 1,556,000 full-time and part-time employees.
Number of Amazon Employees Over Time (Annually)
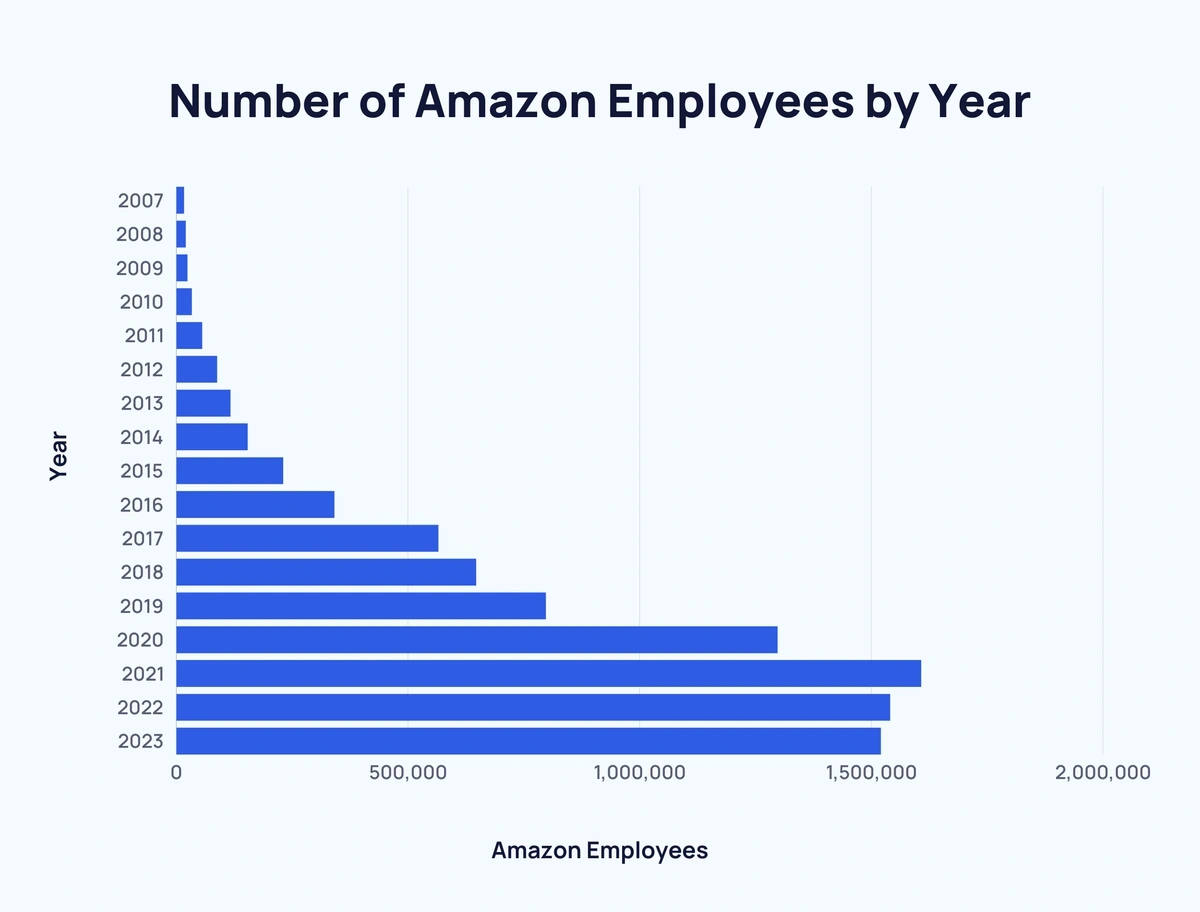
Over the last 15 years, the number of Amazon employees has grown at an increasing rate:
Between 2007 and 2012, the number of Amazon employees increased by 71,400.
Whereas between 2012 and 2017, Amazon employees grew by 477,600.
And between 2017 and 2022, this figure increased to 975,000.
In fact, the number of Amazon employees has only dropped twice since 2007. In 2021, Amazon employed around 1,608,000 people – 67,000 fewer than 2022’s end-of-year total (1,541,000).
Since 2007 (17,000 employees), the number of Amazon employees has increased by over 90x.
Here’s a breakdown of the number of employees that work at Amazon over time:
|
Year |
Amazon Employees |
Change Over Previous Year |
Change Over Previous Year (%) |
|
2007 |
17,000 |
- |
- |
|
2008 |
20,700 |
↑ 2,300 |
↑ 21.76% |
|
2009 |
24,300 |
↑ 3,600 |
↑ 17.39% |
|
2010 |
33,700 |
↑ 9,400 |
↑ 38.68% |
|
2011 |
56,200 |
↑ 22,500 |
↑ 66.77% |
|
2012 |
88,400 |
↑ 32,200 |
↑ 57.3% |
|
2013 |
117,300 |
↑ 28,900 |
↑ 32.69% |
|
2014 |
154,100 |
↑ 36,800 |
↑ 31.37% |
|
2015 |
230,800 |
↑ 76,700 |
↑ 49.77% |
|
2016 |
341,400 |
↑ 110,600 |
↑ 47.92% |
|
2017 |
566,000 |
↑ 224,600 |
↑ 65.79% |
|
2018 |
647,500 |
↑ 81,500 |
↑ 14.4% |
|
2019 |
798,000 |
↑ 140,500 |
↑ 23.24% |
|
2020 |
1,298,000 |
↑ 500,000 |
↑ 62.66% |
|
2021 |
1,608,000 |
↑ 310,000 |
↑ 23.88% |
|
2022 |
1,541,000 |
↓ 67,000 |
↓ 4.17% |
|
2023 |
1,525,000 |
↓ 16,000 |
↓ 1.04% |
|
2024 |
1,521,000 |
↓ 4,000 |
↓ 0.26% |
|
2025 |
1,556,000 |
↑ 35,000 |
↑ 2.30% |
The growth or decline of Amazon's employee count has followed both their sales and website traffic data similarly.
Here's a look at Amazon's total annual visits and unique visitors over the past five years, based on Semrush data:
|
Year |
Total Visits |
Change Over Year |
Unique Visitors |
Change Over Year |
|
2020 |
- |
- | ||
|
2021 |
↑ 2.0% |
↑ 29.6% | ||
|
2022 |
↓ 31.1% |
↑ 11.4% | ||
|
2023 |
↑ 17.9% |
↑ 9.7% | ||
|
2024 |
↓ 3.6% |
↓ 20.6% |
Sources: Amazon, Statista, MacroTrends
Number of Amazon Employees Over Time (Monthly)
Quarterly analysis of Amazon employee numbers reflects a similar upward trend.
Build a winning strategy
Get a complete view of your competitors to anticipate trends and lead your market
From the analysis period (Q1 2018 to Q1 2024), only 7 of 24 quarters saw a drop in Amazon employees.
The three biggest changes in employee numbers during this period are as follows:
- #1 - Q2 2020 → Q3 2020 (248,500)
- #2 - Q3 2020 → Q4 2020 (172,700)
- #3 - Q3 2021 → Q4 2021 (140,000)
Here are the Amazon quarterly employment figures in full:
|
Quarter |
Amazon Employees |
Change Over Previous Year |
Change Over Previous Year (%) |
|
Q1 2018 |
563,100 |
- |
- |
|
Q2 2018 |
575,700 |
↑ 12,600 |
↑ 2.24% |
|
Q3 2018 |
613,300 |
↑ 37,600 |
↑ 6.53% |
|
Q4 2018 |
647,500 |
↑ 34,200 |
↑ 5.58% |
|
Q1 2019 |
630,600 |
↓ 16,900 |
↓ 2.61% |
|
Q2 2019 |
653,300 |
↑ 22,700 |
↑ 3.6% |
|
Q3 2019 |
750,000 |
↑ 96,700 |
↑ 14.8% |
|
Q4 2019 |
798,000 |
↑ 48,000 |
↑ 6.4% |
|
Q1 2020 |
840,400 |
↑ 42,400 |
↑ 5.31% |
|
Q2 2020 |
876,800 |
↑ 36,400 |
↑ 4.33% |
|
Q3 2020 |
1,125,300 |
↑ 248,500 |
↑ 28.34% |
|
Q4 2020 |
1,298,000 |
↑ 172,700 |
↑ 15.35% |
|
Q1 2021 |
1,271,000 |
↓ 27,000 |
↓ 2.08% |
|
Q2 2021 |
1,335,000 |
↑ 64,000 |
↑ 5.04% |
|
Q3 2021 |
1,468,000 |
↑ 133,000 |
↑ 9.96% |
|
Q4 2021 |
1,608,000 |
↑ 140,000 |
↑ 9.54% |
|
Q1 2022 |
1,622,000 |
↑ 14,000 |
↑ 0.87 |
|
Q2 2022 |
1,523,000 |
↓ 99,000 |
↓ 6.1% |
|
Q3 2022 |
1,544,000 |
↑ 21,000 |
↑ 1.38% |
|
Q4 2022 |
1,541,000 |
↓ 3,000 |
↓ 0.19% |
|
Q1 2023 |
1,465,000 |
↓ 76,000 |
↓ 4.93% |
|
Q2 2023 |
1,461,000 |
↓ 4,000 |
↓ 0.27% |
|
Q3 2023 |
1,500,000 |
↑ 39,000 |
↑ 2.67% |
|
Q4 2023 |
1,525,000 |
↑ 25,000 |
↑ 1.67% |
|
Q1 2024 |
1,521,000 |
↓ 4,000 |
↓ 0.26% |
|
Q1 2025 |
1,556,000 |
↑ 35,000 |
↑ 2.30% |
Growth in employees in 2025 corresponded with record revenues and unprecedented scale. On Amazon Prime Day, total E-commerce across the US exceeded $24 billion, as more than half of retailers planned their own promotions around the event.
Amazon Workforce by Gender
As of 2022, 56.8% of Amazon’s workforce were male, while 43.1% were female.
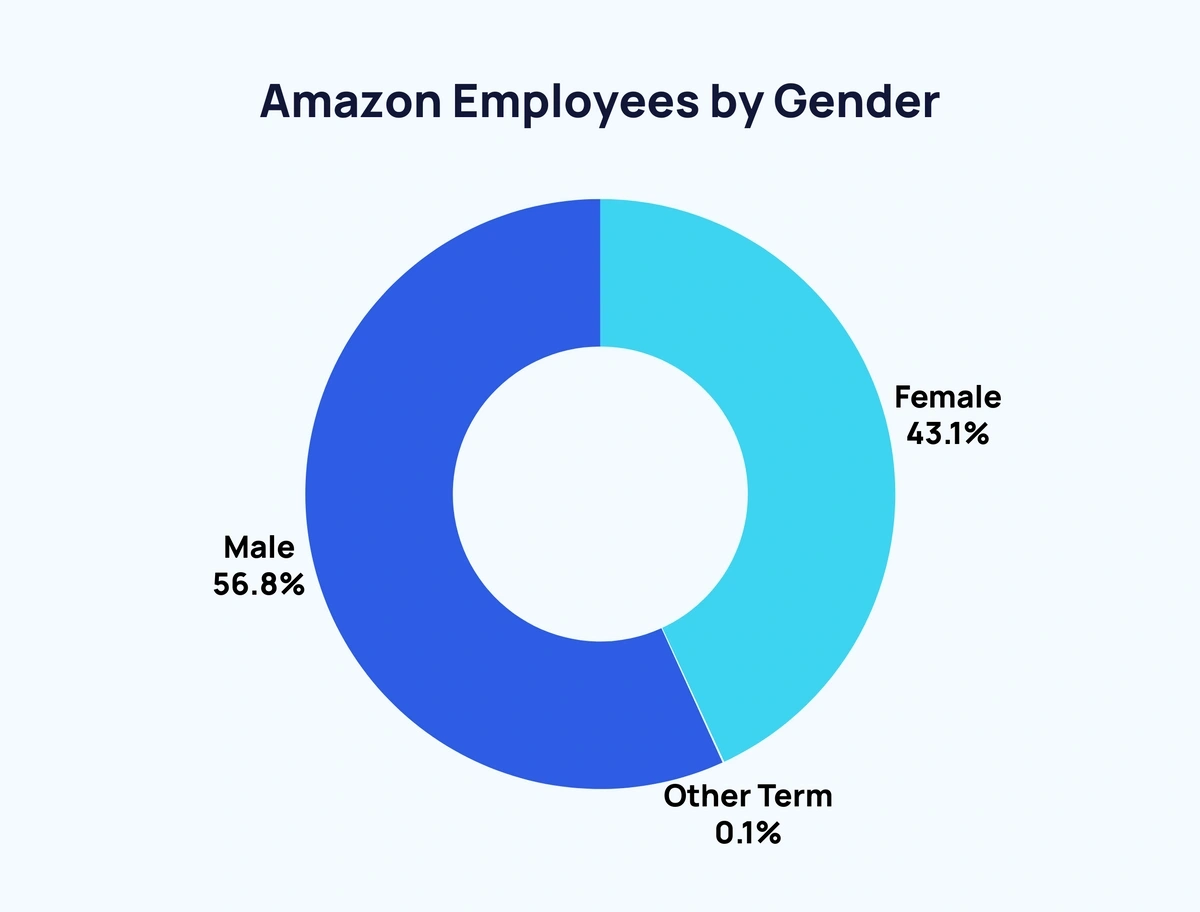
Those figures represent a shift from 2018’s 58.1% male/41.9% female split.
Here’s a closer look at the Amazon workforce by gender over time:
|
Year |
Male |
Change Over Year |
Female |
Change Over Year |
|
2018 |
58.1% |
- |
41.9% |
- |
|
2019 |
57.3% |
↓ 0.8% |
42.7% |
↑ 0.8% |
|
2020 |
55.4% |
↓ 1.9% |
44.6% |
↑ 1.9% |
|
2021 |
55.2% |
↓ 0.2% |
44.8% |
↑ 0.2% |
|
2022 |
56.8% |
↑ 1.6% |
43.1% |
↓ 1.7% |
Focusing specifically on the US, Amazon’s employee gender split is even more balanced.
As of 2021, 53% of Amazon workers were male and 47% were female.
This is the full picture in the US:
|
Year |
Male |
Change Over Year |
Female |
Change Over Year |
|
2018 |
55.5% |
- |
44.5% |
- |
|
2019 |
54.6% |
↓ 0.9% |
45.4% |
↑ 0.9% |
|
2020 |
53.1% |
↓ 1.5% |
46.9% |
↑ 1.5% |
|
2021 |
53% |
↓ 0.1% |
47% |
↑ 0.1% |
|
2022 |
54.3% |
↑ 1.3% |
45.5% |
↓ 1.5% |
Source: Amazon
Amazon Workforce by Ethnicity
Broken down by ethnicity, around 1 in 3 (31.9%) Amazon employees are White – a figure that continues to drop annually.
This comes at a time when Black (26.1%) and LatinX (23.5%) Amazon workers are on the rise.
Here’s a detailed look at Amazon employees by ethnicity over time:
|
Year |
White |
Black |
LatinX |
Asian |
Multiracial |
Native American |
|
2018 |
38.4% |
24.8% |
17.3% |
14.6% |
3.7% |
1.3% |
|
2019 |
34.6% |
26.4% |
18.6% |
15.4% |
3.6% |
1.3% |
|
2020 |
32.1% |
26.5% |
22.8% |
13.6% |
3.6% |
1.5% |
|
2021 |
30.2% |
28.2% |
23.6% |
13.2% |
3.3% |
1.5% |
|
2022 |
31.9% |
26.1% |
23.5% |
16.6% |
1.8% |
1.8% |
And here’s how the makeup of Amazon’s workforce has changed between 2018 and 2022:
|
White |
Black |
LatinX |
Asian |
Multiracial |
Native American | |
|
Change |
↓ 6.5% |
↑ 1.3% |
↑ 6.2% |
↑ 2% |
↓ 1.9% |
↑ 0.5% |
Source: Amazon
Amazon Workforce by Role
The distribution of gender and ethnicity within the Amazon workforce varies massively depending on job role.
For instance, senior leadership roles are dominated by males (76.9%). And approximately 2 in 3 senior leaders are White (66.4%).
In contrast, field & customer support has a far more even distribution with a 51.7% male workforce. And a maximum of 5.5% separates Black (32.7%), LatinX (27.2%), and White (26.7%) Amazon employees in this field of work.
Here’s the data in full:
|
Workforce Avg. |
Field & Customer Support |
Corporate Employees |
People Managers |
Senior Leaders | |
|
Male |
55.2% |
51.7% |
67.2% |
69.2% |
76.9% |
|
Female |
44.8% |
48.3% |
32.8% |
30.8% |
23.1% |
|
White |
30.2% |
26.7% |
44.6% |
53.1% |
66.4% |
|
Black |
28.2% |
32.7% |
8.5% |
12% |
5.5% |
|
LatinX |
23.6% |
27.2% |
8.7% |
10.9% |
4.5% |
|
Asian |
13.2% |
8.2% |
34.4% |
19.9% |
21.5% |
|
Multiracial |
3.3% |
3.3% |
3.2% |
3.3% |
1.8% |
|
Native American |
1.5% |
1.7% |
0.6% |
0.7% |
0.2% |
And this is how the Amazon employee landscape has changed between 2018 and 2021:
|
Change |
Workforce Avg. |
Field & Customer Support |
Corporate Employees |
People Managers |
Senior Leaders |
|
Male |
↓ 2.9% |
↓ 1.5% |
↓ 3.2% |
↓ 3.5% |
↓ 3.1% |
|
Female |
↑ 2.9% |
↑ 1.5% |
↑ 3.2% |
↑ 3.5% |
↑ 3.1% |
|
White |
↓ 8.2% |
↓ 7.2% |
↓ 6.1% |
↓ 8% |
↓ 7.9% |
|
Black |
↑ 3.4% |
↑ 1.1% |
↑ 3.6% |
↑ 4.8% | |
|
LatinX |
↑ 6.3% |
↑ 6% |
↑ 2.6% |
↑ 3.4% | |
|
Asian |
↓ 1.4% |
↑ 0.7% |
↓ 0.6% |
↓ 0.7% | |
|
Multiracial |
↓ 0.4% |
↓ 0.7% |
↑ 0.2% |
↑ 0.3% | |
|
Native American |
↑ 0.2% |
↑ 0.2% |
↑ 0.1% |
↑ 0.1% |
Source: Amazon
Amazon Workforce by Age
According to Zippia, the average employee at Amazon is 20 to 30 years old. Over half (54%) of all Amazon employees fall within this age bracket.

Just 17% of all Amazon workers are over 40 years old.
Here are the Amazon employee age figures:
|
Age Group |
Proportion of Amazon Employees |
|
18 to 20 years |
19% |
|
20 to 30 years |
54% |
|
30 to 40 years |
17% |
|
40+ years |
8% |
Source: Zippia
Conclusion
Despite a recent dip in employee numbers, the long-term trend points towards a growing Amazon workforce.
Especially considering the company’s continued presence as an internet juggernaut.
If you found these statistics interesting, we have more related content here: Number of Amazon Prime Members and Key Consumer Behavior Trends.
Stop Guessing, Start Growing 🚀
Use real-time topic data to create content that resonates and brings results.

Exploding Topics is owned by Semrush. Our mission is to provide accurate data and expert insights on emerging trends. Unless otherwise noted, this page’s content was written by either an employee or a paid contractor of Semrush Inc.
Share
Newsletter Signup
By clicking “Subscribe” you agree to Semrush Privacy Policy and consent to Semrush using your contact data for newsletter purposes
Written By


Fabio is a research associate at Exploding Topics. Since 2021, Fabio has researched, written, and edited articles for the Explo... Read more