


Get Advanced Insights on Any Topic
Discover Trends 12+ Months Before Everyone Else
How We Find Trends Before They Take Off
Exploding Topics’ advanced algorithm monitors millions of unstructured data points to spot trends early on.

Keyword Research
Performance Tracking
Competitor Intelligence
Fix Your Site’s SEO Issues in 30 Seconds
Find technical issues blocking search visibility. Get prioritized, actionable fixes in seconds.
Powered by data from
Latest Blog Posts
Featured Case Studies
See what's trending before everyone else
Each week, we'll send you our best Exploding Topics. Plus, expert insight and analysis.
Number of Amazon Prime Members (2024)

Amazon’s subscription-based membership program, Amazon Prime, has truly taken off in recent years.
First introduced in 2005, Prime is now a household name, delivering products and streaming content to millions in the US and worldwide.
Below, we’ll take a look at the latest data related to Amazon Prime members.
Contents
- Top Stats Related To The Number Of Amazon Prime Members
- How Many Amazon Prime Members Are There?
- Amazon Prime’s Growth Over Time
- US Amazon Prime Members Over Time
- Proportion Of US Amazon Prime Members
- US Household Stats For Amazon Prime Members
- US Generational Data For Amazon Prime Members
- Amazon Prime Day Statistics
- Amazon Prime Day Purchasing Stats
Top Stats Related to the Number of Amazon Prime Members
- There are around 200 million Amazon Prime members worldwide
- The number of Prime members doubled between 2017 and 2020
- Amazon’s US marketplace gets over 4x more visits than any other marketplace
- 2 in 3 US internet users have an Amazon Prime subscription
How Many Amazon Prime Members Are There?
According to the most recent available data, there are approximately 200 million Amazon Prime members.

However, Amazon hasn't disclosed a specific figure since 2020. Which, based on historical trends, means that it’s likely that this number has risen significantly since then.
Source: Marketplace Pulse
Amazon Prime’s Growth Over Time
The past few years have seen rapid growth for Amazon’s subscription service.
In fact, between 2017 (100 million) and 2020 (200 million), the number of Prime members doubled.
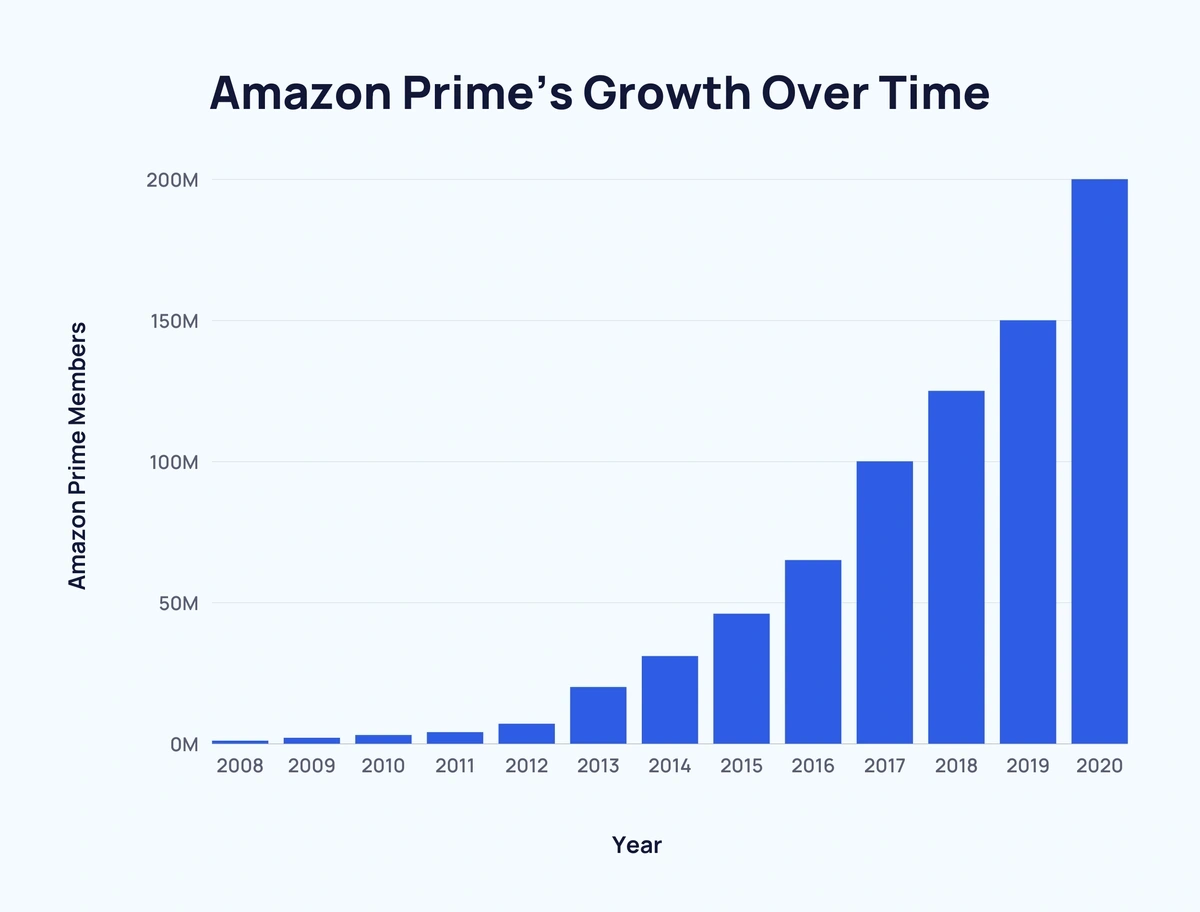
Here’s a look at annual Amazon Prime membership figures since 2008:
| Year | Amazon Prime Members | Change Over Previous Year | Change Over Previous Year (%) |
| 2008 | 1 million | - | - |
| 2009 | 2 million | ↑ 1 million | ↑ 100% |
| 2010 | 3 million | ↑ 1 million | ↑ 50% |
| 2011 | 4 million | ↑ 1 million | ↑ 25% |
| 2012 | 7 million | ↑ 3 million | ↑ 75% |
| 2013 | 20 million | ↑ 13 million | ↑ 186% |
| 2014 | 31 million | ↑ 11 million | ↑ 55% |
| 2015 | 46 million | ↑ 15 million | ↑ 48% |
| 2016 | 65 million | ↑ 19 million | ↑ 41% |
| 2017 | 100 million | ↑ 35 million | ↑ 53% |
| 2018 | 125 million | ↑ 25 million | ↑ 25% |
| 2019 | 150 million | ↑ 25 million | ↑ 20% |
| 2020 | 200 million | ↑ 50 million | ↑ 33% |
The vast majority of Amazon Prime members access the US marketplace.
Looking at total monthly web visits, amazon.com sees over 4x more than any other marketplace.
Here’s a breakdown of the top 10 Amazon Marketplaces by monthly web visits:
| Rank | Amazon Marketplace | Country | Total Monthly Web Visits |
| 1 | amazon.com | US | 2.78 trillion |
| 2 | amazon.co.jp | Japan | 620 billion |
| 3 | amazon.de | Germany | 548 billion |
| 4 | amazon.co.uk | UK | 442 billion |
| 5 | amazon.in | India | 332 billion |
| 6 | amazon.it | Italy | 229 billion |
| 7 | amazon.fr | France | 209 billion |
| 8 | amazon.ca | Canada | 193 billion |
| 9 | amazon.es | Spain | 178 billion |
| 10 | amazon.br | Brazil | 113 billion |
As Amazon Prime’s popularity has increased, so has the amount of marketplace sellers offering prime shipping.
Between December 2017 and December 2021, the proportion of Amazon Marketplace sellers offering Prime shipping increased by 17.12%.
This is how the share of Amazon Marketplace sellers offering Prime shipping has changed over time:
| Month, Year | Share of Amazon Marketplace Sellers Offering Prime Shipping | Six-Month Change |
| Jun, 2017 | 59.66% | - |
| Dec, 2017 | 66.21% | ↑ 6.55% |
| Jun, 2018 | 67.65% | ↑ 1.44% |
| Dec, 2018 | 73.08% | ↑ 5.43% |
| Jun, 2019 | 77.88% | ↑ 4.8% |
| Dec, 2019 | 84% | ↑ 6.12% |
| Jun, 2020 | 77.73% | ↑ 13.73% |
| Dec, 2020 | 84.75% | ↑ 7.02% |
| Jun, 2021 | 82.13% | ↓ 2.62% |
| Dec, 2021 | 83.33% | ↑ 1.2% |
Source: Marketplace Pulse, Marketplace Pulse
US Amazon Prime Members Over Time
There are an estimated 167.2 million Amazon Prime members based in the US. Overall, Americans account for around 3 in 4 Prime members.
US Amazon Prime Members doubled from 40 million in Q4 2014 to 80 million in Q1 2017.
This figure almost doubled again by Q2 2021 (153 million).
Here’s how Prime members have increased over time in the US:
| Q, Year | US Amazon Prime Members |
| Q4 2014 | 40 million |
| Q2 2015 | 44 million |
| Q3 2015 | 47 million |
| Q4 2015 | 54 million |
| Q1 2016 | 58 million |
| Q2 2016 | 63 million |
| Q1 2017 | 80 million |
| Q2 2017 | 85 million |
| Q4 2017 | 92 million |
| Q2 2018 | 95 million |
| Q3 2018 | 97 million |
| Q4 2018 | 101 million |
| Q1 2019 | 103 million |
| Q2 2019 | 105 million |
| Q4 2019 | 112 million |
| Q1 2020 | 118 million |
| Q3 2020 | 126 million |
| Q4 2020 | 142 million |
| Q1 2021 | 147 million |
| Q2 2021 | 153 million |
And here’s a breakdown of the annual figures for Amazon Prime members:
| Year | US Amazon Prime Members | Change Over Previous Year |
| 2017 | 99.7 million | - |
| 2018 | 112.1 million | ↑ 12.4 million |
| 2019 | 124 million | ↑ 11.9 million |
| 2020 | 146.1 million | ↑ 22.1 million |
| 2021 | 159.8 million | ↑ 13.7 million |
| 2022 | 163.5 million* | ↑ 3.7 million |
| 2023 | 167.2 million* | ↑ 3.7 million |
| 2024 | 171.8 million* | ↑ 4.6 million |
| 2025 | 176.2 million* | ↑ 4.4 million |
*Predicted figures
Sources: Digital Commerce 360, eMarketer
Proportion of US Amazon Prime Members
As US Amazon Prime members have increased, so too has the proportion of US Amazon users signing up for the subscription service.
In December 2015, just under half (47%) of all US Amazon users were signed up to Amazon Prime.
By September 2021, the share of US Prime members stood closer to two-thirds (65%).

Here’s a look at how the share of US Amazon customers who are also Prime members has changed in recent years:
| Month, Year | Proportion of US Amazon Customers Who Are Prime Members |
| Dec, 2015 | 47% |
| Sep, 2016 | 52% |
| Sep, 2017 | 63% |
| Dec, 2018 | 62% |
| Dec, 2019 | 65% |
| Sep, 2021 | 65% |
Source: eMarketer
US Household Stats for Amazon Prime Members
It is not uncommon for Amazon users to share accounts.
It is predicted that over 15 million more US households have a Prime subscription compared to 2018.
As such, here’s how the number of US households with a Prime subscription has changed since 2018:
| Year | US Households with a Prime Subscription | Change Over Previous Year |
| 2018 | 60.1 million | - |
| 2019 | 66.4 million | ↑ 6.3 million |
| 2020* | 71.3 million | ↑ 4.9 million |
| 2021* | 74.4 million | ↑ 3.1 million |
| 2022* | 76.6 million | ↑ 2.2 million |
*Predicted figures
Source: Consumer Intelligence Research Partners
US Generational Data for Amazon Prime Members
Around 2 in 3 (67.1%) internet users in the United States have an Amazon Prime subscription.
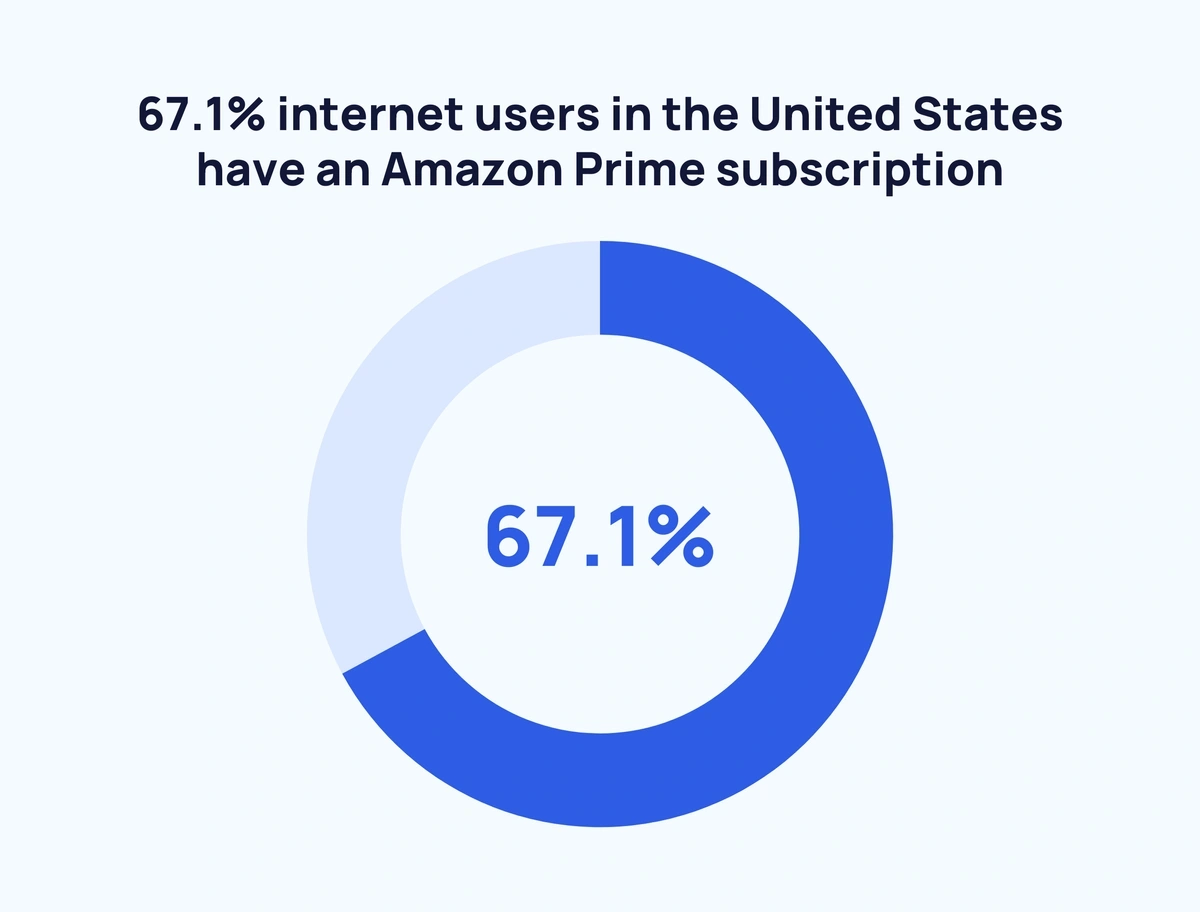
Millennials (76.9%) and Bridge Millennials (79.7%) lead the way for proportion of US Amazon Prime members.
While, perhaps unsurprisingly, Baby Boomers and seniors have the lowest proportion. Although, over half (51.4%) have an Amazon Prime subscription.
Here are the numbers in full:
| Generation | Proportion of US Internet Users with Amazon Prime | Difference to Average |
| Generation Z | 56.7% | - 10.4% |
| Millennials | 76.9% | + 9.8% |
| Bridge Millennials | 79.7% | + 12.6% |
| Generation X | 70.8% | + 3.7% |
| Baby Boomers and Seniors | 51.4% | - 15.7% |
| Average | 67.1% | - |
Source: PYMNTS
Amazon Prime Day Statistics
Amazon Prime Day has become the cornerstone of the Amazon Prime subscription package.
Each year, increasingly more people flock to the site in search of heavily reduced products exclusively available through the Amazon Prime subscription service.
In 2015, just under $1 billion worth of sales were made on Amazon Prime Day. Amazon products accounted for over half (54.5%) of all items sold that day. In comparison, third-party vendors accounted for the remaining 45.5% of sales.
Since then, Amazon Prime Day sales have increased year-over-year by at least $620 million, first surpassing the 10 billion mark in 2020.
2022’s Amazon Prime Day saw approximately $12 billion in sales. And 62.8% of those sales were for Amazon products.
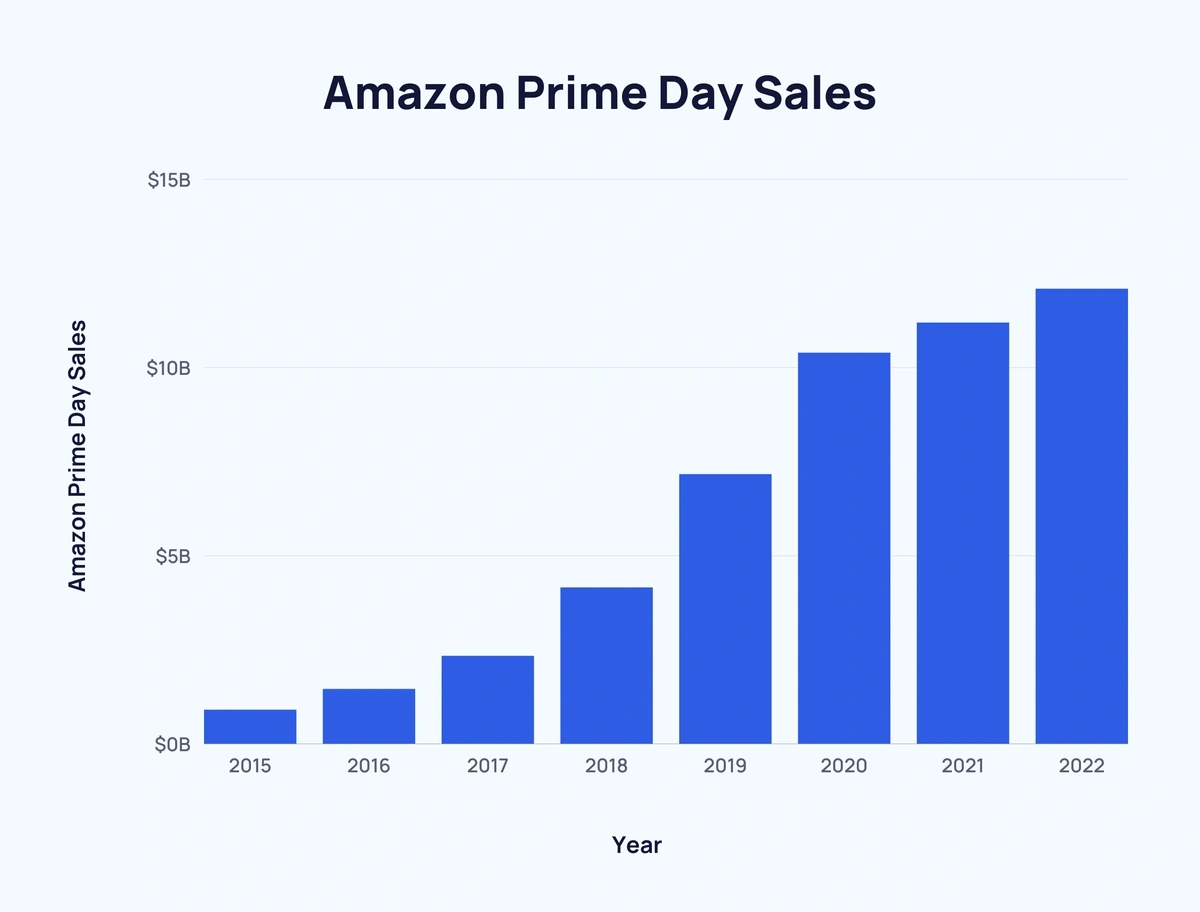
And ahead of Amazon Prime Day 2026, 88% of existing members anticipate making a purchase over the course of the four-day event.
Below, is a look at Amazon Prime Day’s rising sales since 2015:
| Year | Amazon Prime Day Sales | Proportion of Amazon Products Sold on Prime Day | Change Over Previous Year | Change Over Previous Year (%) |
| 2015 | $0.9 billion | 54.5% | - | - |
| 2016 | $1.45 billion | 57.8% | ↑ $0.55 billion | ↑ 61.11% |
| 2017 | $2.33 billion | 57.8% | ↑ $0.88 billion | ↑ 60.69% |
| 2018 | $4.15 billion | 64% | ↑ $1.82 billion | ↑ 78.11% |
| 2019 | $7.16 billion | 68% | ↑ $3.01 billion | ↑ 72.53% |
| 2020 | $10.39 billion | 64.9% | ↑ $3.23 billion | ↑ 45.11% |
| 2021 | $11.19 billion | 64% | ↑ $0.9 billion | ↑ 7.7% |
| 2022 | $12.09 billion | 62.8% | ↑ $0.8 billion | ↑ 8.04% |
| 2023 | $12.9 billion | - | ↑ $0.81 billion | ↑ 6.7% |
Sources: Digital Commerce 360, Statista
Amazon Prime Day Purchasing Stats
A whole range of products are purchased on Amazon Prime Day.
A recent survey suggests that household essentials are the most popular purchase with 29% of respondents claiming to buy a household product on Amazon Prime Day.
Health & beauty (28%) and consumer electronics (27%) follow closely behind.
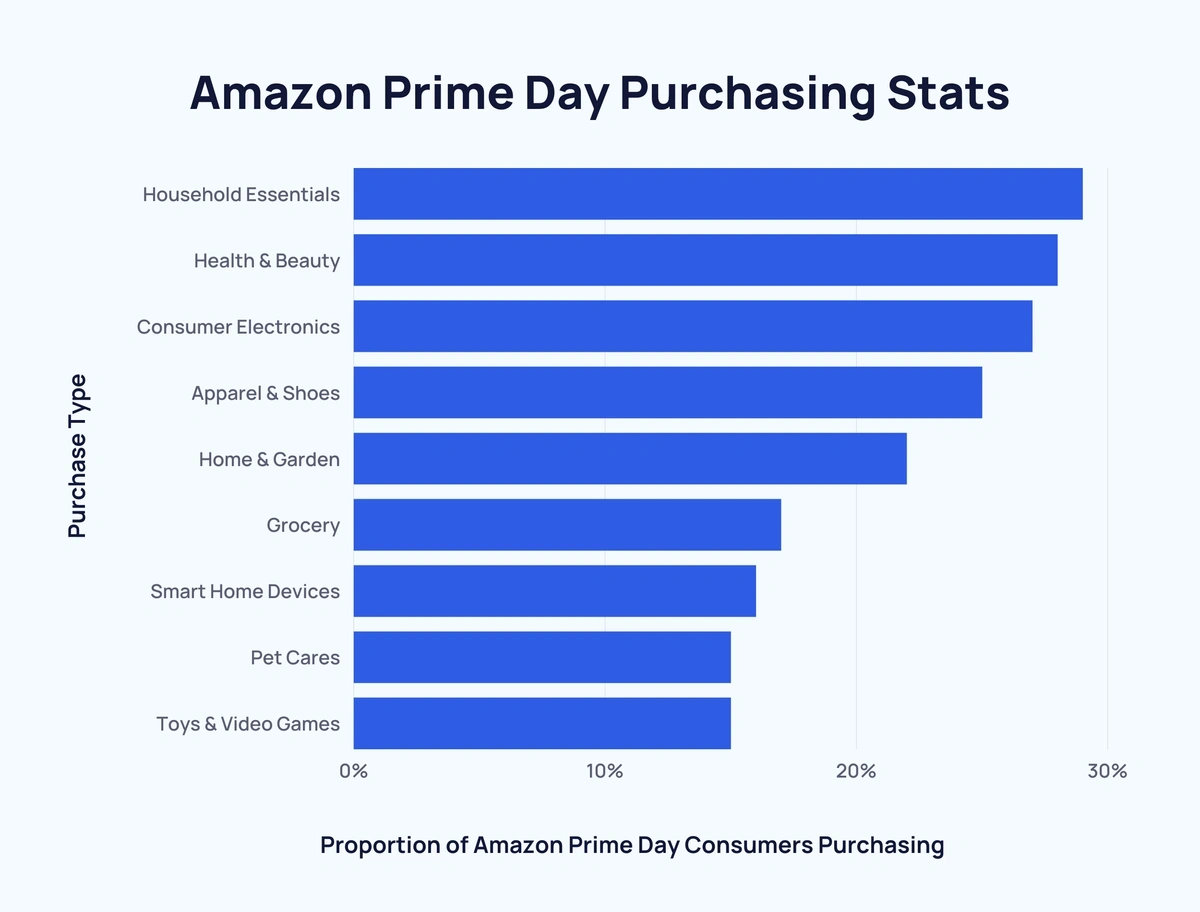
Here’s a look at the breakdown of consumer purchases on Amazon Prime Day 2022:
| Rank | Purchase Type | Proportion of Amazon Prime Day Consumers Purchasing |
| 1 | Household Essentials | 29% |
| 2 | Health & Beauty | 28% |
| 3 | Consumer Electronics | 27% |
| 4 | Apparel & Shoes | 25% |
| 5 | Home & Garden | 22% |
| 6 | Grocery | 17% |
| 7 | Smart Home Devices | 16% |
| 8 | Pet Cares | 15% |
| 9 | Toys & Video Games | 15% |
Source: Numerator
Conclusion
In a relatively short space of time, Amazon Prime has skyrocketed.
Amazon’s paid subscription service is going from strength to strength with each passing year.
And growth is unlikely to slow down as Amazon Prime Day continues to gather pace.
For more related content, take a look at Most Searched Products On Amazon (2023) and Best Products To Sell On Amazon.
Stop Guessing, Start Growing 🚀
Use real-time topic data to create content that resonates and brings results.

Exploding Topics is owned by Semrush. Our mission is to provide accurate data and expert insights on emerging trends. Unless otherwise noted, this page’s content was written by either an employee or a paid contractor of Semrush Inc.
Share
Newsletter Signup
By clicking “Subscribe” you agree to Semrush Privacy Policy and consent to Semrush using your contact data for newsletter purposes
Written By


Josh is the Co-Founder and CTO of Exploding Topics. Josh has led Exploding Topics product development from the first line of co... Read more