


Get Advanced Insights on Any Topic
Discover Trends 12+ Months Before Everyone Else
How We Find Trends Before They Take Off
Exploding Topics’ advanced algorithm monitors millions of unstructured data points to spot trends early on.

Keyword Research
Performance Tracking
Competitor Intelligence
Fix Your Site’s SEO Issues in 30 Seconds
Find technical issues blocking search visibility. Get prioritized, actionable fixes in seconds.
Powered by data from
Latest Blog Posts
Featured Case Studies
See what's trending before everyone else
Each week, we'll send you our best Exploding Topics. Plus, expert insight and analysis.
24+ Augmented Reality Stats (2024-2028)

AR integrations are becoming increasingly popular across various sectors, including marketing, manufacturing, and agriculture.
And as a result, the global augmented reality (AR) market is growing rapidly.
With that in mind, we’ll cover a range of statistics related to the AR space:
- Augmented Reality Statistics (2024)
- Augmented Reality Market Size
- AR Consumer Preferences
- AR User Statistics
- AR Market Value (By Segment)
- Stats For AR Glasses
- AR Headset Data
- AR Retailer Data
Augmented Reality Statistics (2024)
- The AR market is valued at over $32 billion
- AR revenue is projected to exceed $50 billion by 2027
- There are approximately 1.4 billion active AR user devices
- Around 3 in 4 adults under the age of 44 are aware of AR
- AR-based shopping encourages almost half of all consumers to spend more
Augmented Reality Market Size
The AR & VR market is worth an estimated $32.1 billion (Statista)

The AR & VR market now generates an estimated $32.1 billion each year. Revenue is predicted to grow at a CAGR of 10.77% through 2028.
The AR & VR market is predicted to nearly double between 2024 and 2028 (Statista)
By 2028, total revenue from the AR & VR space is set to increase by almost 2x.
This will take the market value beyond the $50 billion mark, reaching $58.1 billion.
By 2027, mobile AR market revenue is expected to top $39 billion (ARtillery Intelligence)
As of 2027, the mobile AR market revenue is predicted to reach $39.81 billion, up from $12.45 billion in 2021.
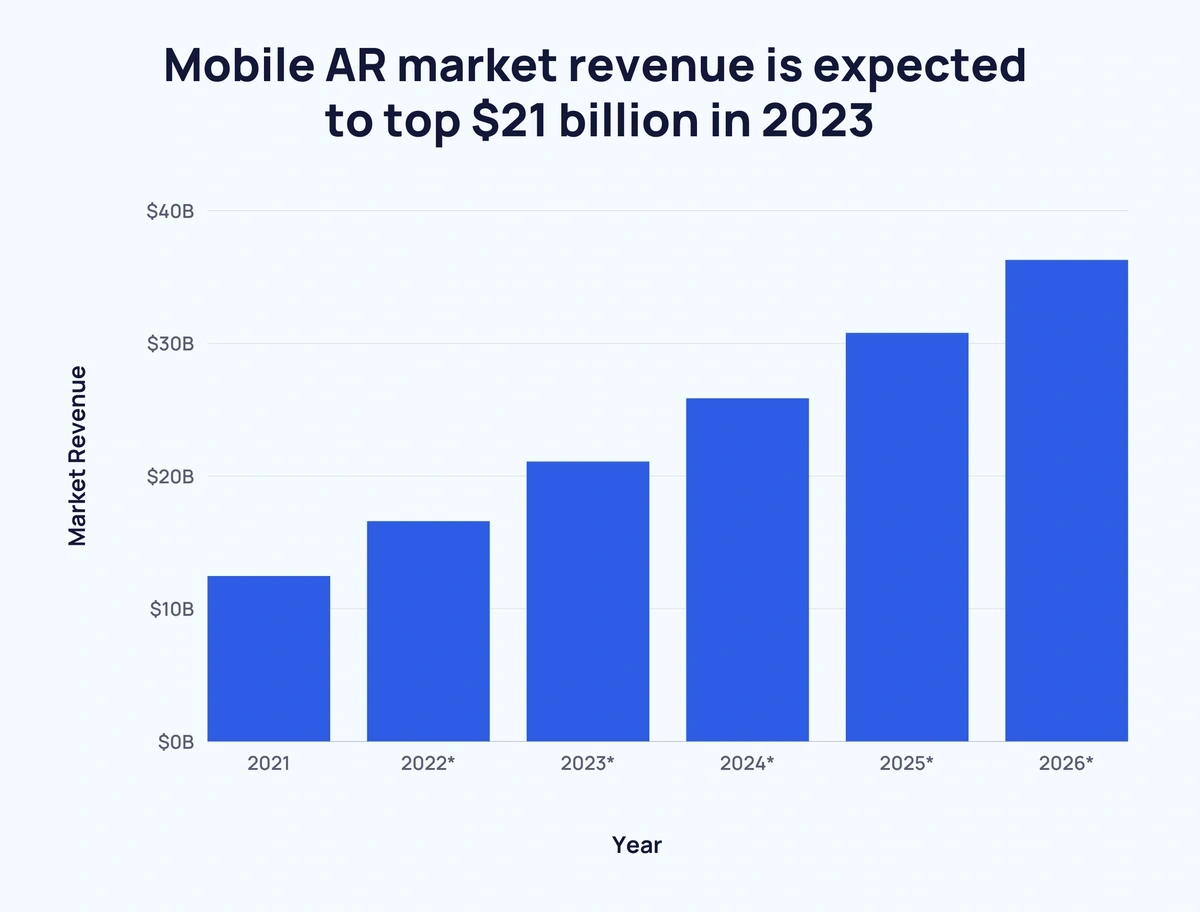
Here’s the mobile AR market revenue breakdown:
| Year | Market Revenue | Increase Over Previous Year | Increase Over Previous Year (%) |
| 2021 | $12.45 billion | - | - |
| 2022* | $16.58 billion | ↑ $4.13 billion | ↑ 33.17% |
| 2023* | $21.07 billion | ↑ $4.49 billion | ↑ 27.08% |
| 2024* | $25.84 billion | ↑ $4.77 billion | ↑ 22.64% |
| 2025* | $30.77 billion | ↑ $4.93 billion | ↑ 19.08% |
| 2026* | $36.26 billion | ↑ $5.49 billion | ↑ 17.84% |
| 2027* | $39.81 billion | ↑ $3.55 billion | ↑ 9.79% |
*Predicted figure
AR Consumer Preferences
Nearly half of all consumers are likely to spend more on a product via AR-based shopping (Think Mobiles)
Being able to test out a product ahead of purchase is a big deal for many consumers. And AR is increasingly being utilized to provide that ‘try before you buy’ incentive.
Approximately 2 in 5 (40%) consumers claim they are likely to pay more for a product that is initially available to test with AR.
Most consumers have a preference AR-integrated shopping (Think Mobiles)

Not only does AR encourage purchasing, but it also makes the shopping experience more enjoyable for many.
A recent study found that over half (55%) of shoppers claim AR shopping is more fun.
The most common reason for using AR is Immersion(Vorhaus Advisors)
A recent US study found that 32% of people who use AR do so for non-specific reasons such as liking it.
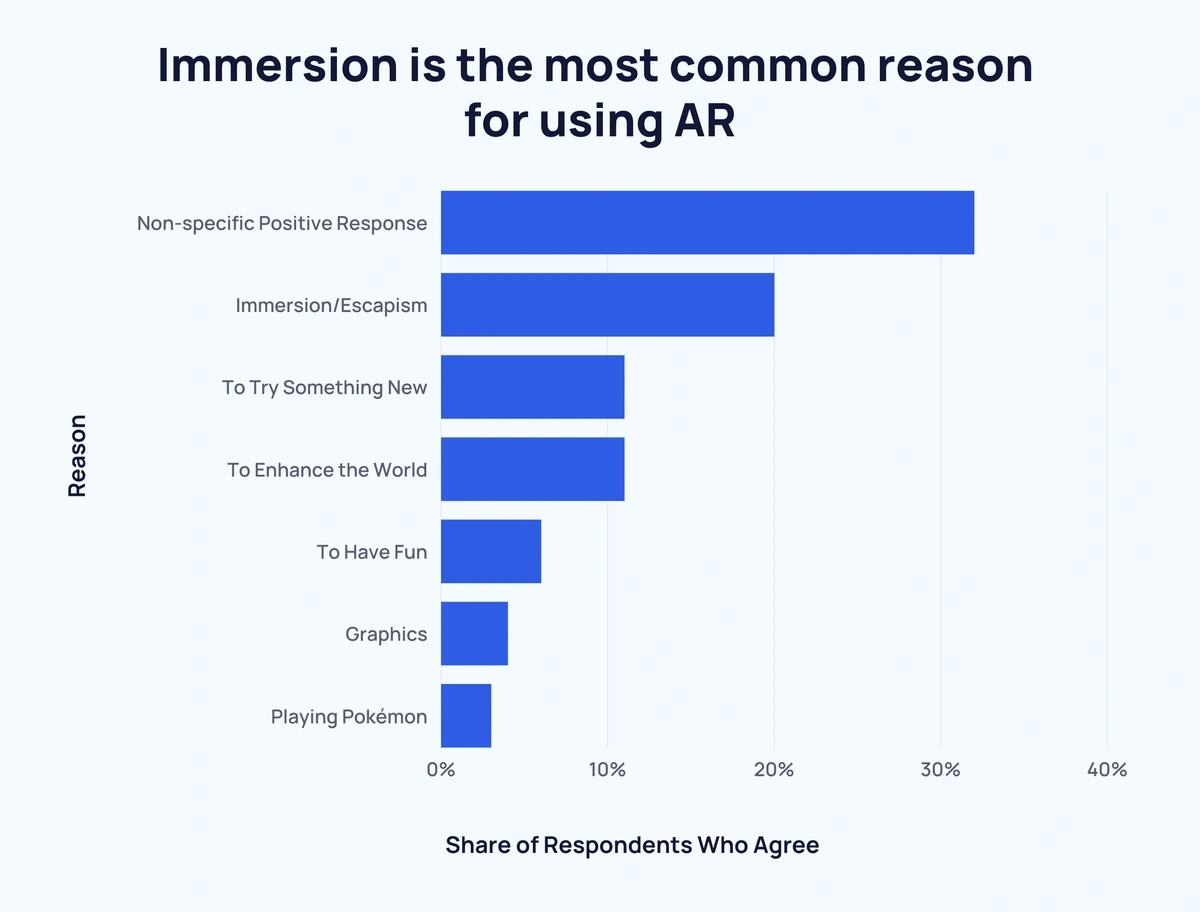
Of those who gave a specific reason for using AR, immersion/escapism was the most popular answer with 20% of respondents agreeing.
Here’s the full list of reasons for using AR:
| Rank | Reason | Share of Respondents Who Agree |
| 1 | Non-specific Positive Response | 32% |
| 2 | Immersion/Escapism | 20% |
| =3 | To Try Something New | 11% |
| =3 | To Enhance the World | 11% |
| 5 | To Have Fun | 6% |
| 6 | Graphics | 4% |
| 7 | Playing Pokémon | 3% |
The most popular AR use is gaming (Vorhaus Advisors)
Around 1 in 3 (32%) of Americans are interested in playing augmented reality video games.
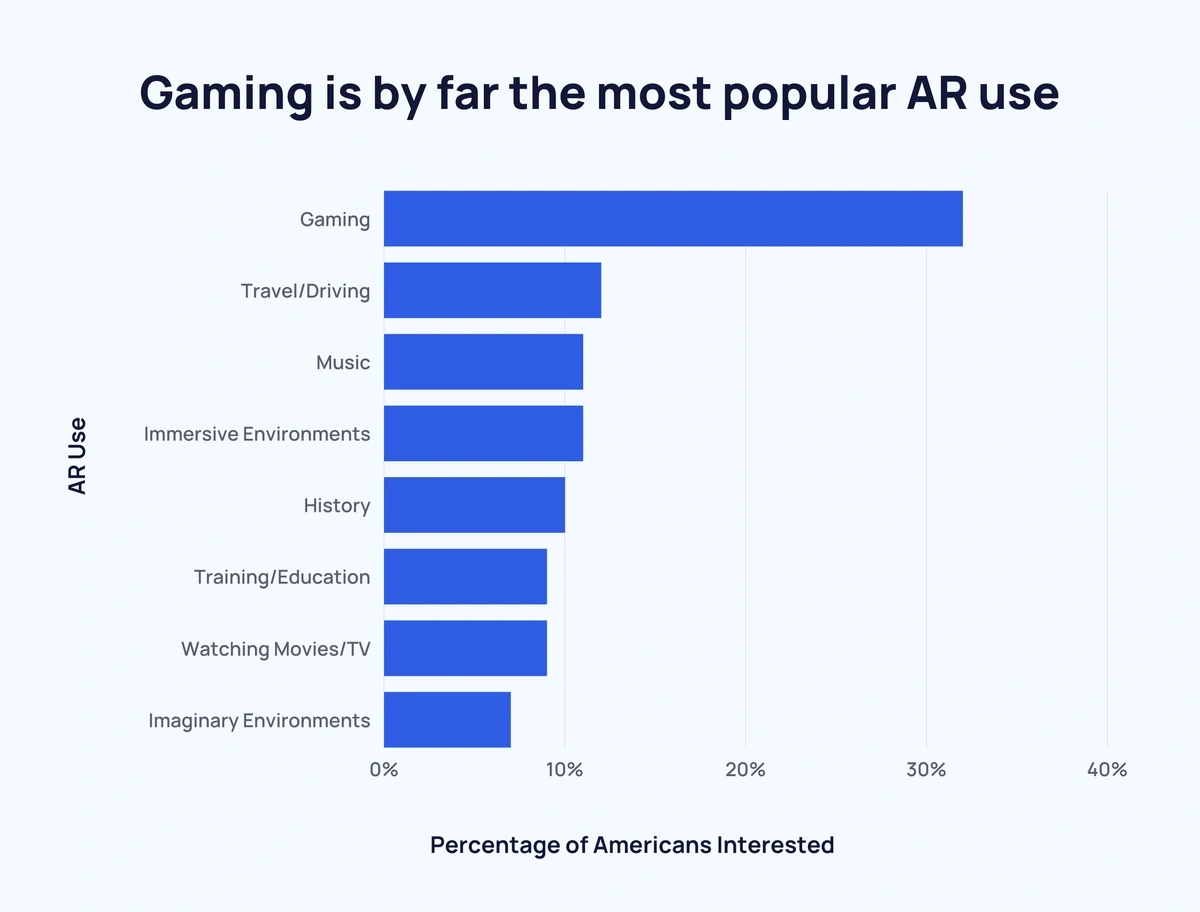
That’s almost 3x more than any other AR use.
Below is a list of AR use cases that Americans are most interested in:
| Rank | AR Use | Percentage of Americans Interested |
| 1 | Gaming | 32% |
| 2 | Travel/Driving | 12% |
| =3 | Music | 11% |
| =3 | Immersive Environments | 11% |
| 5 | History | 10% |
| =6 | Training/Education | 9% |
| =6 | Watching Movies/TV | 9% |
| 8 | Imaginary Environments | 7% |
As many as 75% of 16 to 44-year-olds are aware of AR (Leftronic)
The existence of AR has become common knowledge to many consumers.
Between 70% and 75% of people aged 16 to 44 have heard of AR.
Notably, 56% of 45 to 54-year-olds are aware of AR. And just 44% of 55 to 64-year-olds know about AR technology.
Around 9 in 10 Gen Zers have an interest in AR shopping (Dynata)
Across the board, members of Gen Z are showing a strong interest in AR-based shopping (91.75%).
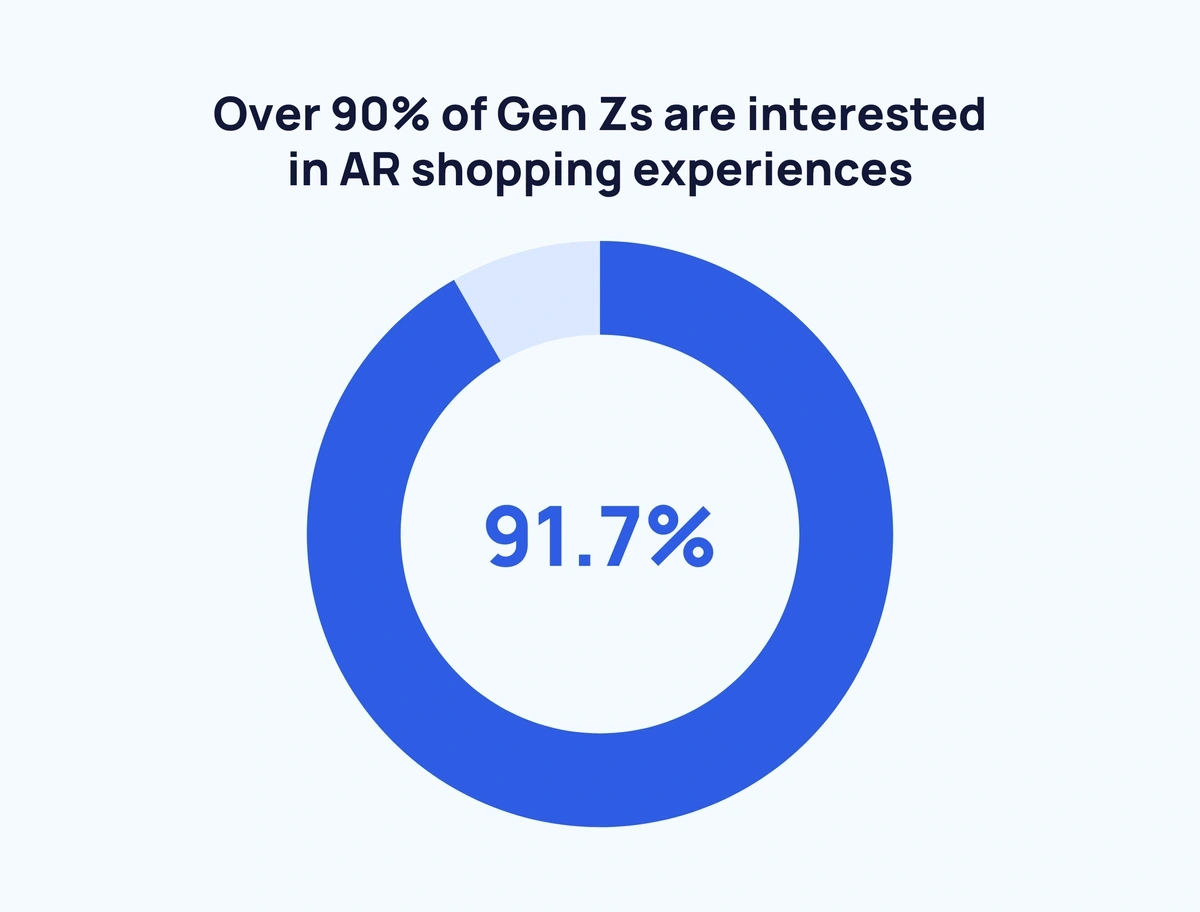
Perhaps unsurprisingly, there is a strong correlation between younger generations (like Gen Alpha) and AR shopping interest.
For example, seeing what a piece of furniture will look like interests 94% of Gen Z, compared to just 64% of the Silent Generation.
Here’s how the generations compare in terms of the proportion of AR shopping interest:
| Shopping Use | Gen Z | Millennials | Gen X | Boomers | Silent |
| Visualizing Furniture or Decor | 94% | 92% | 87% | 75% | 64% |
| Visualizing Paint Color | 91% | 91% | 85% | 73% | 58% |
| Visualizing Makeup or Hair Color | 90% | 87% | 82% | 60% | 62% |
| Visualizing Clothes, Shoes, and Accessories | 92% | 90% | 84% | 65% | 57% |
7 in 10 shoppers believe AR apps would influence them to shop more often (Think Mobiles)
On the whole, consumers feel that AR apps would make them shop more often.
In fact, 71% agree that this would be the case. And 61% claim they choose stores with AR over stores without.
AR User Statistics
There are an estimated 1.4 billion active AR user devices (ARtillery Intelligence)
The number of active AR user devices has been climbing year over year.
In 2019, there were approximately 0.44 billion active AR user devices. By 2021, this number had almost doubled to 0.81 billion.
As of 2023, there are 1.4 billion AR user devices in active use.
And that figure is expected to increase to 1.73 billion in 2024.
Just 3 in 10 Americans currently use AR (Vorhaus Advisors)
AR adoption may be gathering pace, but still, only a minority of Americans use it.
In fact, just 30% of Americans use AR. And a third of those (10% total) use it less than once a month.
From the remaining 20%, there’s an even split between those using it monthly, weekly, multiple times a week, and daily.
AR Market Value (by Segment)
The AR agriculture market is valued at more than $500,000 (BIS Research)

The latest data indicates that the AR agriculture market is valued at $660,000.
North America ($220,000) and Europe ($190,000) are the two largest contributors to this figure.
Here’s a breakdown of regional AR agriculture revenue:
| Region | Market Size | Proportion of Total Market Size |
| North America | $220,000 | 33.3% |
| Europe | $190,000 | 28.8% |
| Asia-Pacific and Japan | $110,000 | 16.7% |
| China | $50,000 | 7.6% |
| UK | $40,000 | 6% |
| Rest of World | $50,000 | 7.6% |
The AR manufacturing segment is expected to double in value between 2025 and 2030 (McKinsey)
As of 2025, the estimated value of the AR manufacturing segment is expected to fall between $40 billion to $50 billion.
In just five years, this is expected to roughly double, reaching $90 billion to $110 billion by 2030.
The value of AR in offices could increase by up to 10x in a five-year period (McKinsey)
AR in offices is likely to be valued at $10 billion to $40 billion in 2025.
By 2030, McKinsey predicts that this space will be worth anywhere between $30 billion and $100 billion.
By 2030, the value of AR in hospitals could hit $90 billion (McKinsey)

By 2025, AR in hospitals is expected to reach an economic value of $20 billion to $30 billion.
That value is predicted to potentially double to $40 billion but could climb up to $90 billion.
The AR vehicle space will double in value between 2025 and 2030 (McKinsey)
As of 2025, the estimated economic value of AR in the vehicle space will be $2 billion to $3 billion.
In 2030, that value is projected to rise to somewhere between $4 billion and $7 billion.
Stats for AR Glasses
Between 2023 and 2026, AR glasses revenue is predicted to increase by over 5x (ARtillery Intelligence)
As of 2024, revenue from consumer and enterprise AR glasses software and hardware exceeded 10 billion. That’s up more than 5x on 2021’s $1.85 billion.
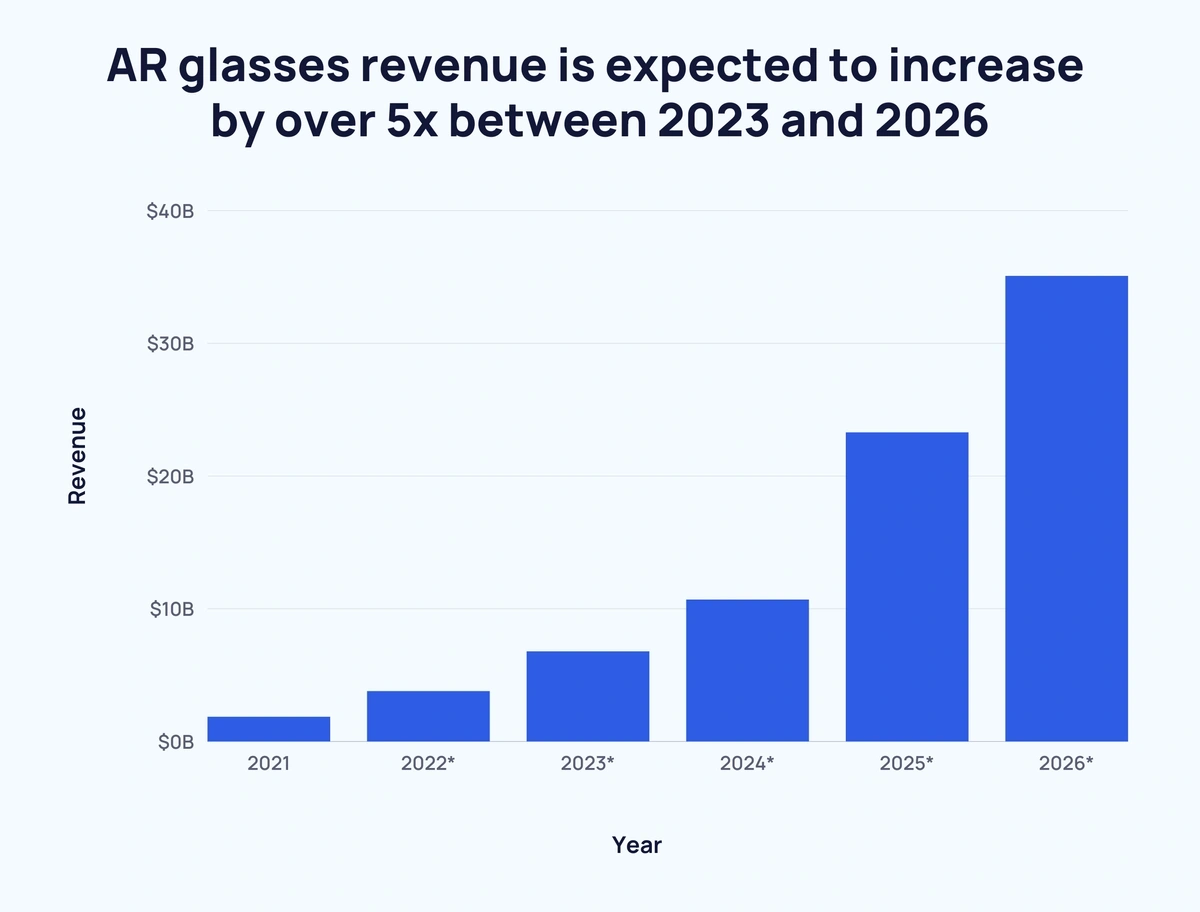
Over the next few years, AR glasses revenue is set to rocket to over $35 billion by 2026.
Here’s a breakdown of AR glasses revenue over time:
| Year | Revenue | Increase Over Previous Year | Increase Over Previous Year (%) |
| 2021 | $1.85 billion | - | - |
| 2022* | $3.78 billion | ↑ $1.93 billion | ↑ 104.3% |
| 2023* | $6.77 billion | ↑ $2.99 billion | ↑ 79.1% |
| 2024* | $10.68 billion | ↑ $3.91 billion | ↑ 57.8% |
| 2025* | $23.27 billion | ↑ $12.59 billion | ↑ 117.9% |
| 2026* | $35.06 billion | ↑ $11.79 billion | ↑ 50.7% |
Top-end VR glasses are retailed at $3,500 (VRcompare)
The price of VR glasses varies significantly from a few hundred dollars to a few thousand.
The Microsoft HoloLens 2 VR glasses are sold for almost 9x the price of Nreal Air VR glasses.
On average, top-end VR glasses weigh over 7x more than lightweight models (VRcompare)

There’s a strong correlation between the price of VR glasses and weight.
The heaviest VR glasses can weigh upwards of 550 grams. While the lightest VR glasses weigh as little as 76 grams.
Here’s a look at a selection of five VR glasses by price and weight in 2022:
| AR Glasses | Weight | Price |
| Microsoft HoloLens 2 | 556 grams | $3,500 |
| Magic Leap 2 | 260 grams | $3,299 |
| Lenovo ThinkReality A3 | 130 grams | $1,499 |
| Nreal Light | 106 grams | $499 |
| Nreal Air | 76 grams | $400 |
Vuzix’s premium VR glasses are more than 20x more expensive than their budget option (Vuzix)
The most expensive Vuzix VR glasses on offer in 2022 was the Vuzix M4000 at $2,499.99.
The least expensive available (Vuzix Smart Swim) was priced at $199.99.
Here’s an assortment of Vuzix AR glasses prices in 2022:
| AR Glasses | Price |
| Vuzix M4000 | $2,499.99 |
| Vuzix M400 | $1,799.99 |
| Vuzix Blade 2 | $1,299.99 |
| Vuzix Blade | $999.99 |
| Vuzix Smart Swim | $199.99 |
Micro LED AR glasses display chip market revenue is set to increase by over 400x in three years (TrendForce)
Market revenue for micro LED AR glasses for 2023 was estimated to reach $0.1 million.
In 2024, this is predicted to increase by 20x to $2 million.
And by 2025, market revenue is projected to hit $5 million.
As of 2026, the market for LED AR glasses display chips is likely to skyrocket to $41 million.
AR Headset Data
As of 2026, the AR headset market is expected to ship 50 million units (IDC)
In 2021, the AR headset market shipped just over 11 million units.
That figure is estimated to double in 2023 to around 23 million units.
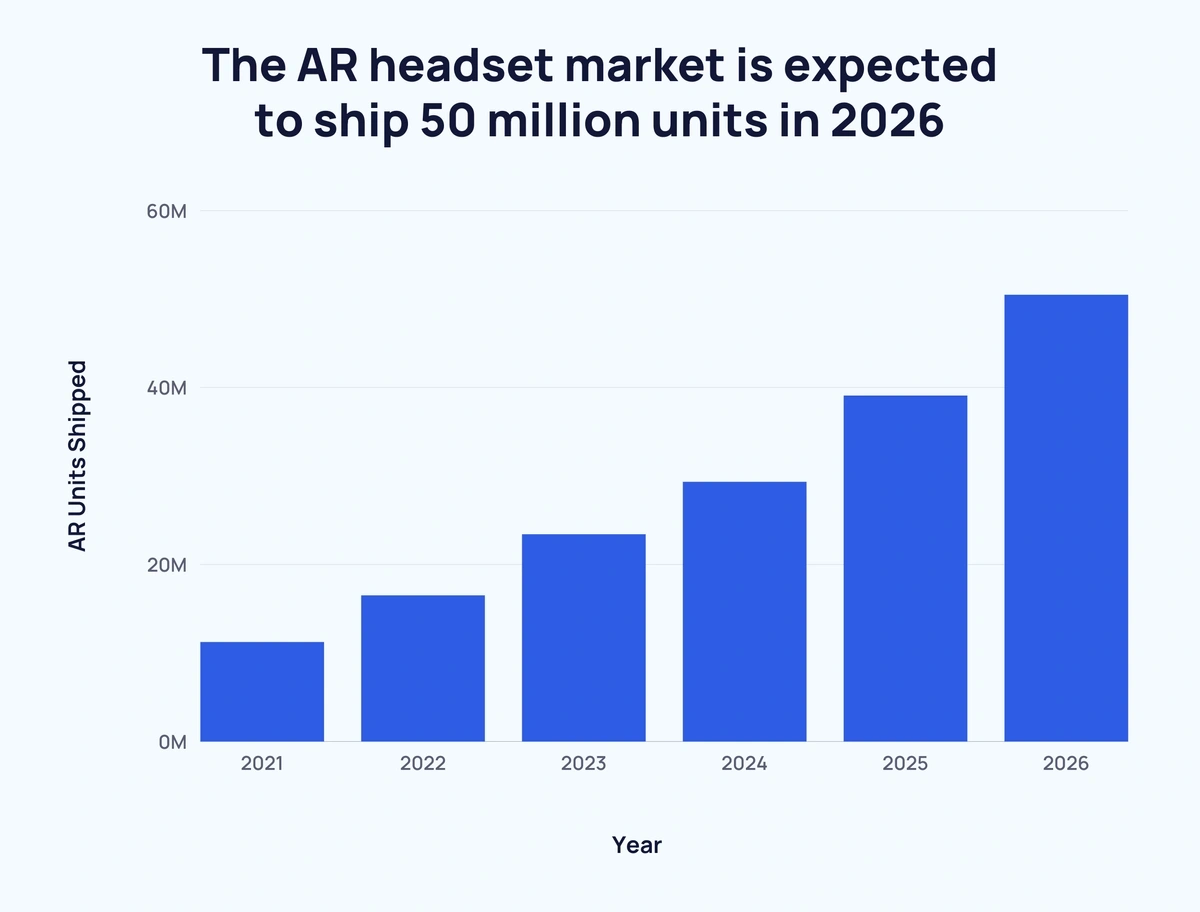
By 2026, over 50 million VR headsets are predicted to be shipped during the course of the year.
Here’s a breakdown of predicted AR/VR headset shipments from 2021 to 2026:
| Year | AR Units Shipped | Consumer | Commercial | Increase Over Previous Year |
| 2021 | 11.23 million | 9.54 million | 1.69 million | - |
| 2022 | 16.5 million | 13.24 million | 3.26 million | ↑ 46.93% |
| 2023 | 23.4 million | 17.81 million | 5.59 million | ↑ 41.82% |
| 2024 | 29.33 million | 21.13 million | 8.2 million | ↑ 25.34% |
| 2025 | 39.07 million | 25.31 million | 13.76 million | ↑ 33.21% |
| 2026 | 50.46 million | 30.88 million | 19.58 million | ↑ 29.15% |
Meta’s Oculus is responsible for two-thirds of XR headset shipments (IDC)
As of Q2 2022, Oculus made up 66% of all XR headsets shipped.
Pico made up 11%, while DPVR had a proportion of 9%.
Here’s a look at XR headset shipment share over time:
| Quarter, Year | XR Headset Share | |||
| Oculus | DPVR | Pico | Others | |
| Q1, 2020 | 34% | 7% | 6% | 53% |
| Q2, 2020 | 32% | 8% | 10% | 50% |
| Q3, 2020 | 29% | 8% | 11% | 52% |
| Q4, 2020 | 74% | 4% | 3% | 19% |
| Q1, 2021 | 75% | 6% | 3% | 16% |
| Q2, 2021 | 67% | 9% | 6% | 18% |
| Q3, 2021 | 73% | 10% | 6% | 11% |
| Q4, 2021 | 80% | 8% | 5% | 7% |
| Q1, 2022 | 77% | 7% | 8% | 8% |
| Q2, 2022 | 66% | 9% | 11% | 14% |
AR Retailer Data
More than half of retailers feel ill-prepared to support emerging mobile tech such as VR (Cision)
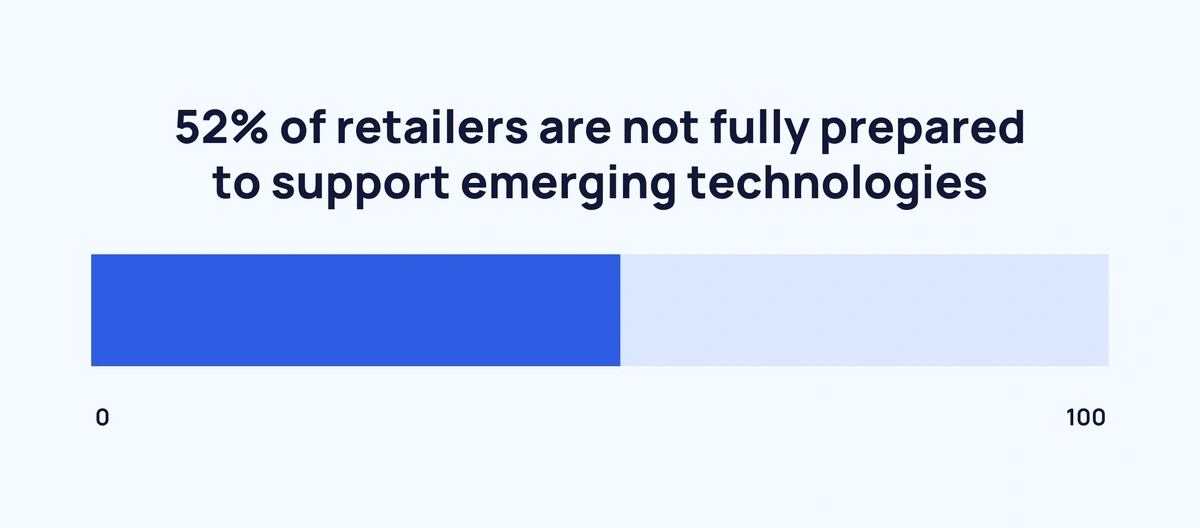
A recent study found that 52% of retailers are not fully prepared to support emerging technologies. This includes AI, chatbots, AR and VR.
Only 1 in every 100 retailers are utilizing AR to sell products (Marketing Dive)
Retailers are adopting AR to aid the sales process.
Yet, just 1% currently use AR or VR during sales.
Almost 1 in 3 game developers make games for the Oculus Quest (Game Developers Conference)
The Oculus Quest (27%) and Oculus Rift (13%) have the largest proportion of game developers making games for their devices.
Here’s a look at the top AR/VR platforms receiving attention from game developers:
| Rank | AR Platform | Proportion of Game Developers Making Games |
| 1 | Oculus Quest | 27% |
| 2 | Oculus Rift | 13% |
| 3 | HTC VIVE | 12% |
| 4 | Valve Index | 8% |
| 5 | iOS Phone | 7% |
| 6 | PlayStation VR | 6% |
| 7 | PlayStation VR2 | 5% |
| 8 | Google ARCore | 4% |
| 9 | Windows Mixed Reality Headsets | 4% |
| 10 | HP Reverb | 2% |
| 11 | Magic Leap One | 2% |
| 12 | Vive Flow | 1% |
| - | Other | 5% |
| - | None | 56% |
Conclusion
AR is certainly an emerging market.
However, it’s still unknown which use cases will become mainstream, which makes AR a fascinating market to follow.
If you found these statistics on AR interesting, take a look at our other related content: Explosive VR Startups, Key Technology Trends, and Mobile App Development Trends.
Stop Guessing, Start Growing 🚀
Use real-time topic data to create content that resonates and brings results.

Exploding Topics is owned by Semrush. Our mission is to provide accurate data and expert insights on emerging trends. Unless otherwise noted, this page’s content was written by either an employee or a paid contractor of Semrush Inc.
Share
Newsletter Signup
By clicking “Subscribe” you agree to Semrush Privacy Policy and consent to Semrush using your contact data for newsletter purposes
Written By


Josh is the Co-Founder and CTO of Exploding Topics. Josh has led Exploding Topics product development from the first line of co... Read more