


Get Advanced Insights on Any Topic
Discover Trends 12+ Months Before Everyone Else
How We Find Trends Before They Take Off
Exploding Topics’ advanced algorithm monitors millions of unstructured data points to spot trends early on.

Keyword Research
Performance Tracking
Competitor Intelligence
Fix Your Site’s SEO Issues in 30 Seconds
Find technical issues blocking search visibility. Get prioritized, actionable fixes in seconds.
Powered by data from
Latest Blog Posts
Featured Case Studies
See what's trending before everyone else
Each week, we'll send you our best Exploding Topics. Plus, expert insight and analysis.
Average Customer Retention By Industry (2025)

Strong customer retention is vital to success irrespective of industry. Business executives are constantly aiming to improve retention strategies to remain ahead of the curve.
There is plenty of variation between industry customer retention rates. And a high figure in one space can be a concerning figure in another.
We’ll explore the latest customer retention rates across different industries.
- Customer Retention By Industry
- Media And IT Services Customer Retention
- Automotive & Transportation Customer Retention
- Financial Services And Banking Customer Retention
- Telecommunications Customer Retention
- Consumer Services, Hospitality, And Travel Customer Retention
- Retail Customer Retention
- Customer Retention Drivers
Top 5 Customer Retention Stats in 2025
- Media and professional services have the highest industry retention rates (84%).
- The hospitality/travel/restaurant industries have a retention rate of just 55%.
- Financial/credit and cable have the highest churn rates in the US (25%).
- The top delivery method used for retention is email (89%).
- 60% of people believe that good customer service is key to customer retention.
- Customers with positive past experience spend 140% more than customers with poor experience.
Build a winning strategy
Get a complete view of your competitors to anticipate trends and lead your market
Customer Retention by Industry
Breaking down customer retention figures by industry, media and professional services rank joint-top for highest retention with 84%.
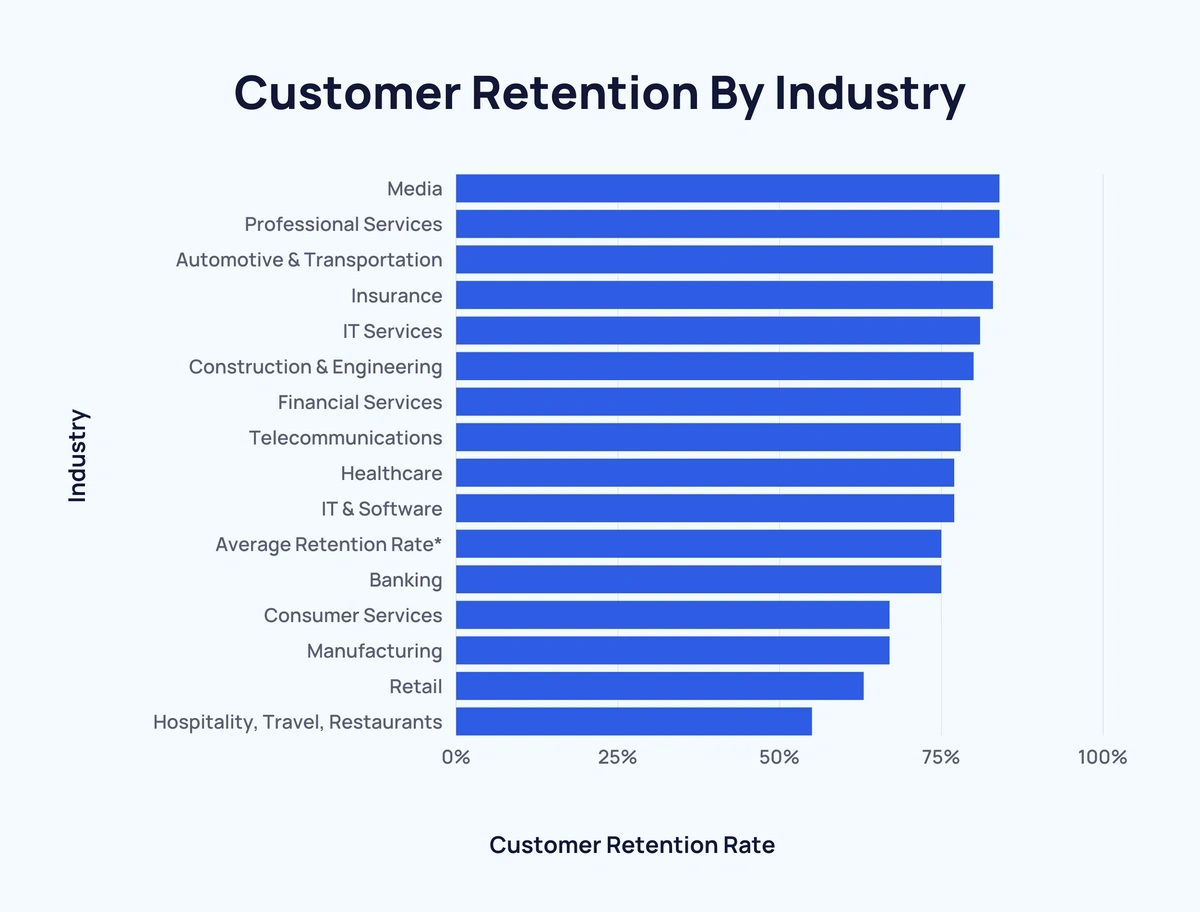
At the other end of the spectrum, the hospitality/travel/restaurant industries have a comparatively low customer retention rate of just 55%.
Here’s the full list of average customer retention rates by industry:
| Industry | Customer Retention Rate | Difference vs Average* |
| Media | 84% | ↑ 9% |
| Professional Services | 84% | ↑ 9% |
| Automotive & Transportation | 83% | ↑ 8% |
| Insurance | 83% | ↑ 8% |
| IT Services | 81% | ↑ 6% |
| Construction & Engineering | 80% | ↑ 5% |
| Financial Services | 78% | ↑ 3% |
| Telecommunications | 78% | ↑ 3% |
| Healthcare | 77% | ↑ 2% |
| IT & Software | 77% | ↑ 2% |
| Average Retention Rate* | 75% | - |
| Banking | 75% | - 0% |
| Consumer Services | 67% | ↓ 8% |
| Manufacturing | 67% | ↓ 8% |
| Retail | 63% | ↓ 12% |
| Hospitality, Travel, Restaurants | 55% | ↓ 20% |
*Average derived from 15 above industries
Looking specifically at US data, 2020 research shows that the financial/credit sector and cable have the highest churn rates (25%). This was closely followed by general retail with 24% of customers discontinuing their use of a retail service.
Here’s a detailed look at the US churn rate by industry:
| Industry | Churn Rate | Difference vs Average* |
| Financial/Credit | 25% | ↑ 4% |
| Cable | 25% | ↑ 4% |
| General Retail | 24% | ↑ 3% |
| Online Retail | 22% | ↑ 1% |
| Telecom/Wireless | 21% | - 0% |
| Average Churn Rate | 21% | - |
| Travel | 18% | ↓ 3% |
| Big Box Electronics | 11% | ↓ 10% |
*Average derived from 7 above industries
Source: Customer Gauge, Aspect
Media and IT Services Customer Retention
At 84% the media industry ranks joint-highest for global customer retention rate. Media companies often have substantial marketing budgets that allow them to target large client bases. This helps maintain a high retention rate despite a lack of personalization.
Meanwhile, IT services have a customer retention of 81%. And the IT & software industry has a comparatively low 77% customer retention. Both sectors have the advantage of being able to deliver fast results. However, unfulfilled expectations can quickly lead to high churn rates and customers jump ship.
One aspect that links both media and IT is apps - specifically social media apps.
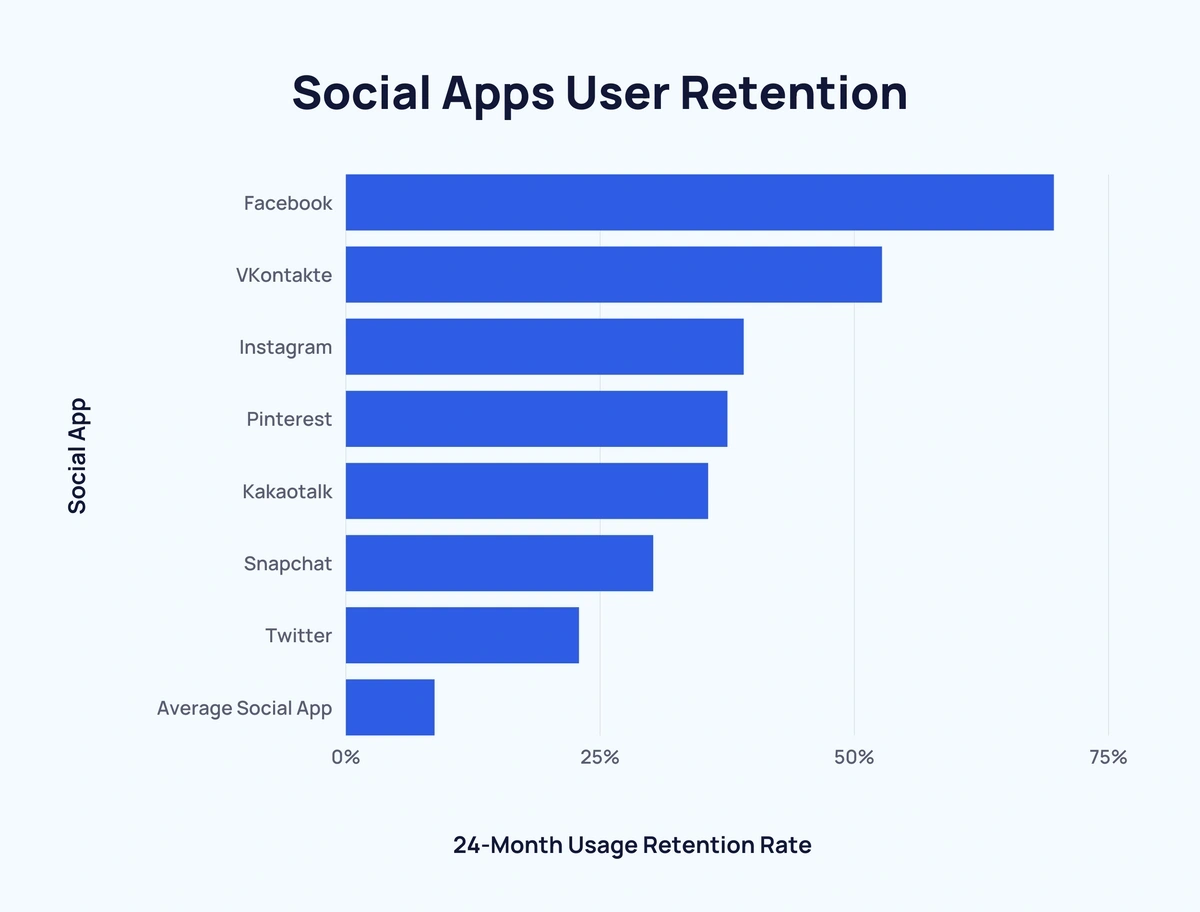
The latest available statistics show that the average social app has a 24-month usage retention rate of 8.7%. Yet, 2015’s figures for the most popular social apps far exceed this average.
Here’s how the biggest social apps compared in terms of mid-term to long-term user retention:
| Social App | 24-Month Usage Retention Rate | Comparison to Average |
| 69.6% | ↑ 60.9% | |
| VKontakte | 52.7% | ↑ 44% |
| 39.1% | ↑ 30.4% | |
| 37.5% | ↑ 28.8% | |
| Kakaotalk | 35.6% | ↑ 26.9% |
| Snapchat | 30.2% | ↑ 21.5% |
| 22.9% | ↑ 14.2% | |
| Average Social App | 8.7% | - |
These figures compare favorably to the average short-term retention for mobile apps:
| Month | Average User Retention |
| 1 | 43% |
| 2 | 33% |
| 3 | 29% |
Evidently, the type of app has a sizable influence on user retention rates.
In fact, 2020 data shows that the top app type by retention rate over 30 days (comics - 33.8%) has more than double the retention of the bottom app type (food & drink - 16.5%).
Below are a selection of mobile app retention statistics by app type:
| App Type | Day 1 Retention | Day 7 Retention | Day 30 Retention | Day 1 to Day 30 Drop-Off |
| Comics | 33.8% | 16.4% | 9.3% | ↓ 24.5% |
| News | 33.1% | 19.8% | 13.3% | ↓ 19.8% |
| Gaming - Hyper Casual | 32.3% | 8.3% | 2.6% | ↓ 29.7% |
| Gaming - Casual | 32.3% | 11.1% | 4.5% | ↓ 27.8% |
| Gaming - Social Casino | 32.1% | 12.6% | 5.4% | ↓ 26.7% |
| Gaming - Midcore | 31% | 7.9% | 2.3% | ↓ 28.7% |
| Gaming - Hardcore | 28.7% | 8.7% | 3.1% | ↓ 25.6% |
| Social | 26.3% | 9.3% | 3.9% | ↓ 22.4% |
| Books | 25.1% | 11.1% | 6% | ↓ 19.1% |
| Shopping - e-Commerce | 24.5% | 10.7% | 5.6% | ↓ 18.9% |
| Entertainment - Streaming | 24.4% | 9.9% | 4.7% | ↓ 19.7% |
| Entertainment - All | 22% | 8.2% | 3.8% | ↓ 18.2% |
| Music | 20.4% | 8.1% | 4.2% | ↓ 16.2% |
| Medical | 20% | 7% | 3.5% | ↓ 16.5% |
| Education | 18.8% | 6.3% | 2.5% | ↓ 16.3% |
Source: Business Wire, SimilarWeb, Liftoff
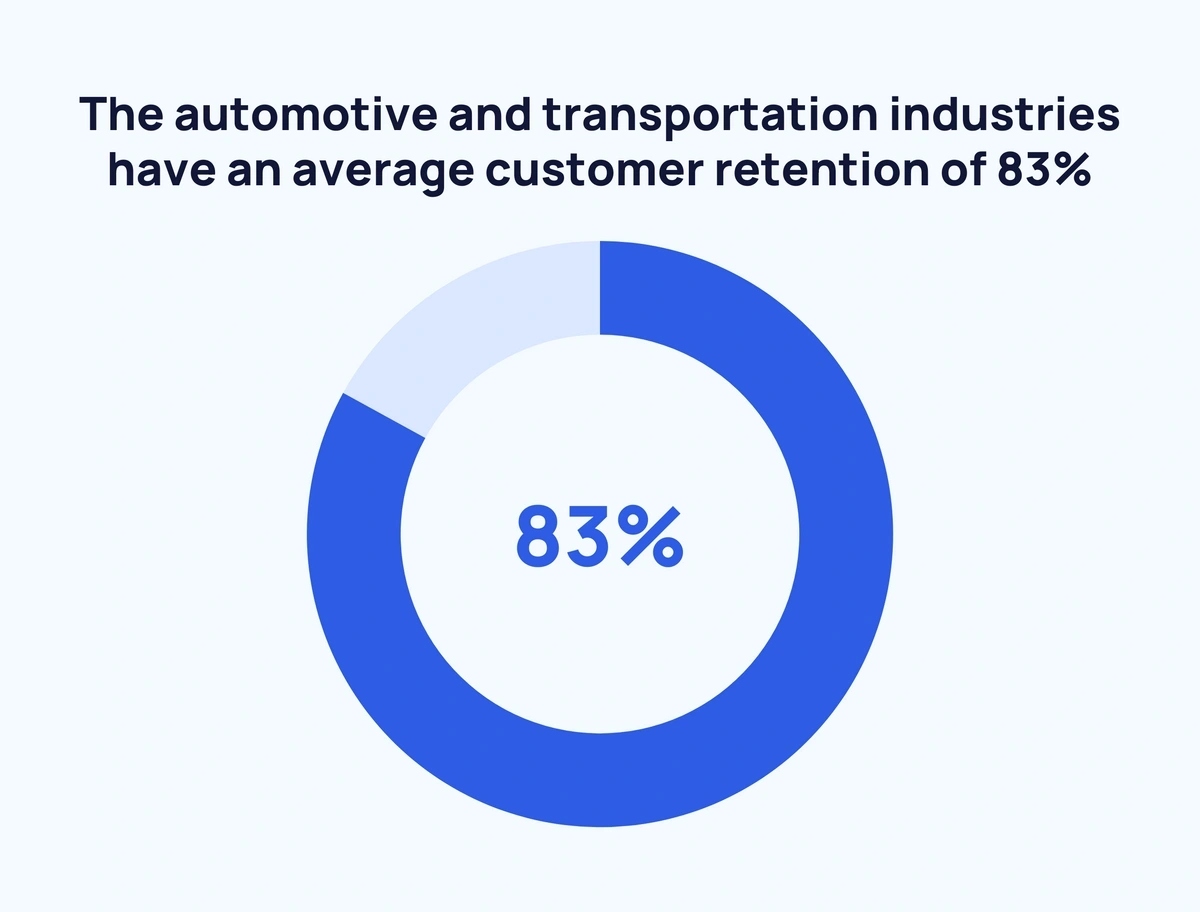
Automotive & Transportation Customer Retention
According to 2018 data, the automotive and transportation industries have an average customer retention of 83% - among the highest recorded industry retention rates.
In the short term, travel apps have a lower-than-average 1-day retention rate. On average, just 1 in 5 people will continue to use a travel app after the first day.
However, the drop-off over the course of a month isn’t as severe as some other app categories. From the remaining 20%, almost 1 in 5 continue to use travel apps up to the 30-day mark.
| App Type | Day 1 Retention | Day 7 Retention | Day 30 Retention | Day 1 to Day 30 Drop-Off |
| Travel | 20% | 7.6% | 3.6% | ↓ 16.4% |
Looking at 2021 data, transportation apps fare rather well in terms of long-term retention. Especially when compared to automotive apps.
| App Type | 30-Day Retention | 90-Day Retention | 1-Year Retention | Day 30 to 1-Year Drop-Off |
| Transportation | 50% | 45% | 33% | ↓ 17% |
| Automotive | 67% | 57% | 32% | ↓ 35% |
Automotive apps have a notably higher (17%) 30-day retention than transportation apps.
Yet, transportation apps edge (1%) automotive apps in terms of retention after a year.
The drop-off between the 30-day mark and the 1-year mark for automotive apps is over double the drop-off for transportation apps.
Source: Business Wire, Liftoff, Apptentive
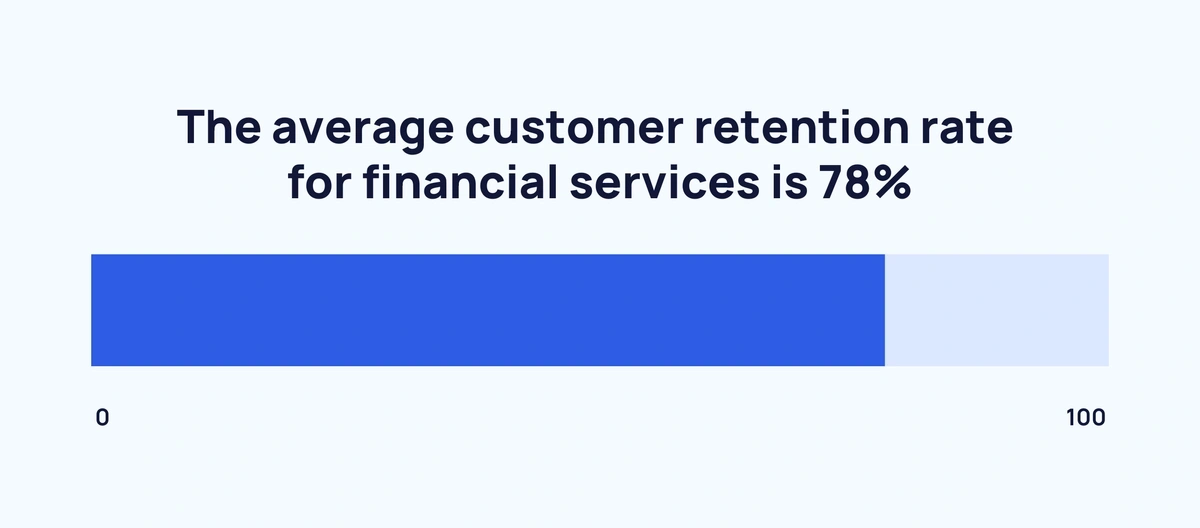
Financial Services and Banking Customer Retention
The average customer retention rate for financial services is 78%. While the retention rate for the banking industry is a fraction lower at 75%.
These high customer retention rates are reinforced by the fact that the average American uses their primary bank account for 16 years. In fact, just 4% of consumers switched banks in 2018.
Want to Spy on Your Competition?
Explore competitors’ website traffic stats, discover growth points, and expand your market share.
A strong brand is thought to be the most important driver in the banking industry's customer retention.
Here are the top drivers for customer retention according to retail bank CEOs in 2010:
| Requirement | Percentage of CEOs Who Consider Requirement Very Important |
| Strong Brands | 90% |
| High-quality data and data analysis | 82% |
| Integrated multichannel sales | 79% |
| Transparent products | 78% |
| Segmented offerings based on the consumer’s needs | 68% |
| Competitive prices | 60% |
| Strong branch presence | 59% |
| Use of innovative technologies | 53% |
| Bonuses for loyal customers | 37% |
| Product bundles | 31% |
And here’s how various financial and banking apps compare in terms of short-term customer retention:
| App Type | Day 1 Retention | Day 7 Retention | Day 30 Retention | Day 1 to Day 30 Drop-Off |
| Finance - Traditional Banking | 30.6% | 18.6% | 13.4% | ↓ 16.2% |
| Finance - Digital Banking | 30% | 15.6% | 10.2% | ↓ 19.8% |
| Finance - Investments | 25.6% | 12.5% | 7.1% | ↓ 18.5% |
| Finance - All | 22.7% | 9.7% | 5.8% | ↓ 16.9% |
| Business | 22.4% | 10.1% | 5% | ↓ 17.4% |
| Finance - Financial Services | 21.8% | 9.7% | 6.1% | ↓ 15.7% |
| Utilities | 18.3% | 6.8% | 3.4% | ↓ 14.9% |
On average, organic payment apps achieve higher retention rates than paid install payment apps. This is true across all five measured intervals between 1 day and 30 days.
Here is a detailed look at H1 2019 data for global payment app customer retention:
| Payment App | Day 1 | Day 7 | Day 14 | Day 21 | Day 30 |
| Organic | 16% | 10% | 8% | 7% | 6% |
| Paid | 14% | 7% | 5% | 4% | 3% |
Paid install payment apps also see a slightly higher 30-day drop-off (11%) compared to organic payment apps (10%).
Source: Business Wire, Bankmagazin, Liftoff, adjust
Telecommunications Customer Retention
The average customer retention rate for telecommunications companies is 78%.
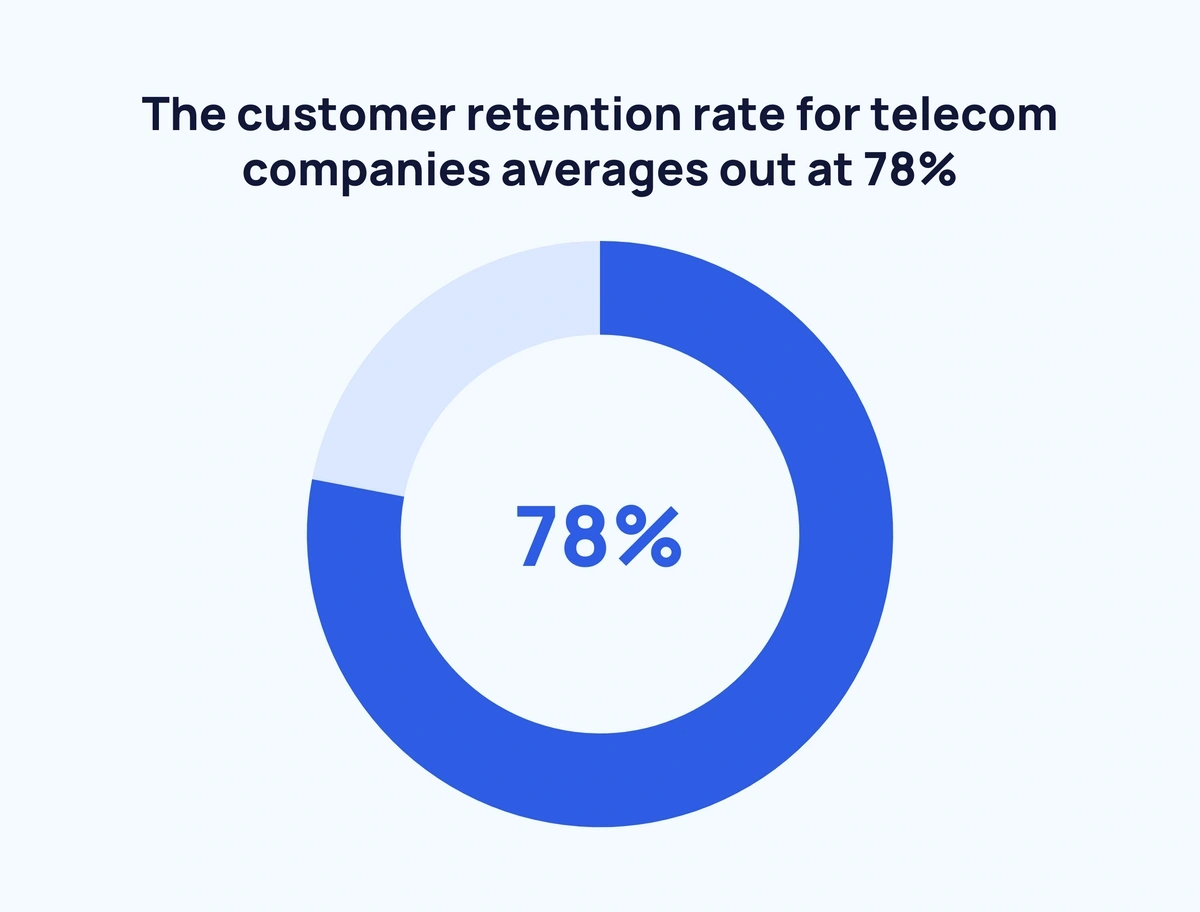
The relatively high customer retention rate is perhaps linked to long-term contracts and customer loyalty incentives which makes switching more difficult.
Meanwhile, mobile apps are a big part of modern telecommunication. However, the ease of installing and uninstalling apps means that their retention rates are considerably lower than more fixed subscription models.
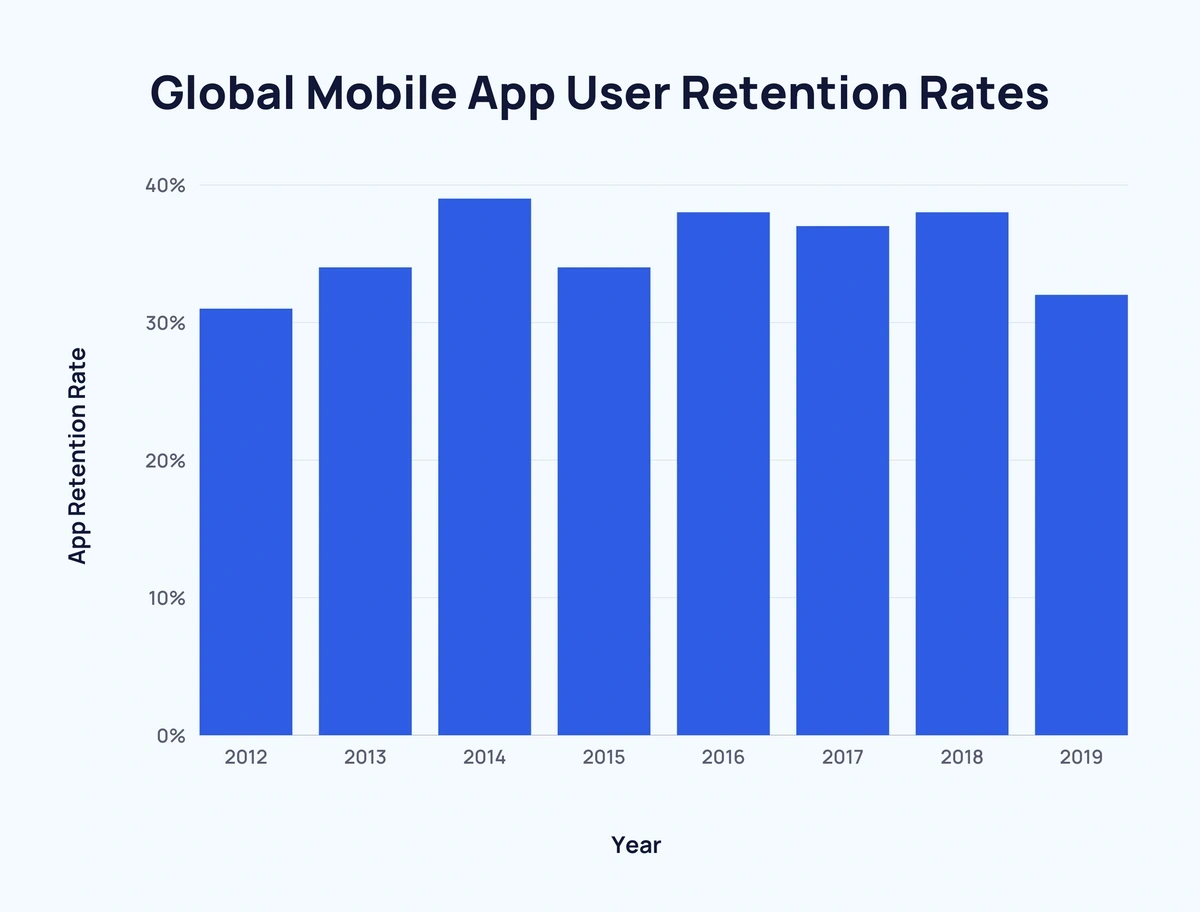
Nonetheless, here is a look at global mobile app user retention rates over time from 2012 to 2019:
| Year | App Retention Rate | Change of Previous Year |
| 2012 | 31% | - |
| 2013 | 34% | ↑ 3% |
| 2014 | 39% | ↑ 5% |
| 2015 | 34% | ↓ 5% |
| 2016 | 38% | ↑ 4% |
| 2017 | 37% | ↓ 1% |
| 2018 | 38% | ↑ 1% |
| 2019 | 32% | ↓ 6% |
Over this period, the average retention rate for app users sat at just over 35%.
Of course, retention rates vary across nations. Analysis from Q3 2020 highlights the discrepancies between countries’ post-install app retention over a 30-day period:
| Country | Region | 30-Day Retention Rate |
| Finland | Europe | 6.01% |
| Japan | Asia | 5.89% |
| Ireland | Europe | 5.78% |
| Denmark | Europe | 5.17% |
| Sweden | Europe | 4.48% |
| Netherlands | Europe | 4.36% |
| Canada | North America | 4.31% |
| Australia | Oceania | 4.11% |
| South Korea | Asia | 4.06% |
| Germany | Europe | 3.86% |
| United Kingdom | Europe | 3.82% |
| Belarus | Europe | 3.65% |
| France | Europe | 3.56% |
| United States | North America | 3.49% |
| Spain | Europe | 3.46% |
| Belgium | Europe | 3.42% |
| South Africa | Africa | 3.41% |
| Poland | Europe | 3.38% |
| Italy | Europe | 3.3% |
| Malaysia | Asia | 3.07% |
| Romania | Europe | 2.78% |
| Russia | Europe/Asia | 2.73% |
| Thailand | Asia | 2.36% |
| Colombia | South America | 2.35% |
| Indonesia | Asia | 2.3% |
| Ukraine | Europe | 2.27% |
| Saudi Arabia | Asia | 2.26% |
| Mexico | North America | 2.2% |
| Argentina | South America | 2.17% |
| Philippines | Asia | 2.08% |
| Brazil | South America | 2.04% |
| Vietnam | Asia | 1.97% |
| Egypt | Africa | 1.96% |
| Turkey | Europe/Asia | 1.94% |
| India | Asia | 1.92% |
And here are three select types of app and their short-term retention statistics as of 2020:
| App Type | Day 1 Retention | Day 7 Retention | Day 30 Retention | Day 1 to Day 30 Drop-Off |
| News | 33.1% | 19.8% | 13.3% | ↓ 19.8% |
| Social | 26.3% | 9.3% | 3.9% | ↓ 22.4% |
| Communication | 22.4% | 10.1% | 5% | ↓ 17.4% |
Source: Business Wire, AppsFlyer, Liftoff
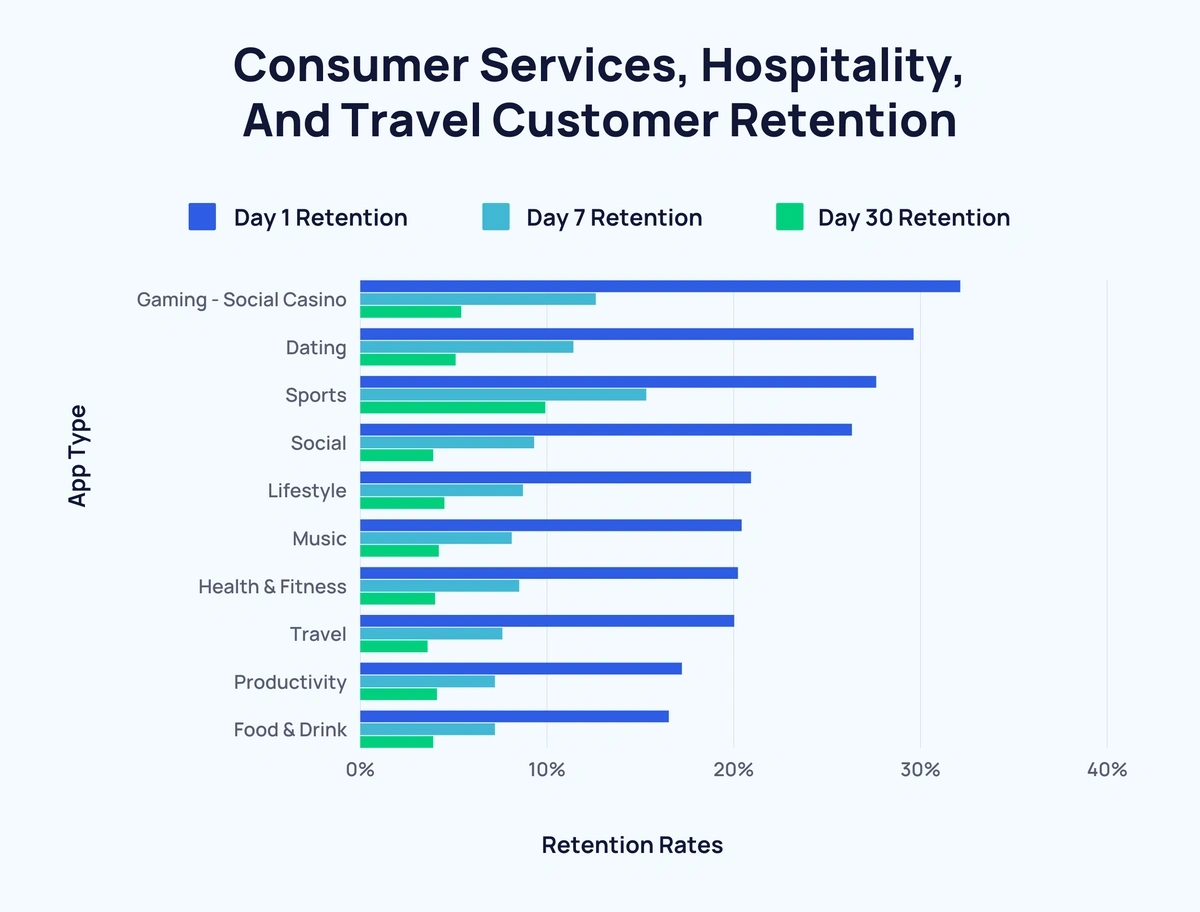
Consumer Services, Hospitality, and Travel Customer Retention
Among the lowest industry averages for customer retention are consumer services (67%) and hospitality, travel, and restaurants (55%).
Hospitality/tourism apps have near-identical retention rates to transportation apps:
| App Type | 30-Day Retention | 90-Day Retention | 1-Year Retention | Day 30 to 1-Year Drop-Off |
| Hospitality/Tourism | 50% | 44% | 31% | ↓ 19% |
| Transportation | 50% | 45% | 33% | ↓ 17% |
But there’s a considerable disparity between different types of consumer and hospitality apps:
| App Type | Day 1 Retention | Day 7 Retention | Day 30 Retention | Day 1 to Day 30 Drop-Off |
| Gaming - Social Casino | 32.1% | 12.6% | 5.4% | ↓ 26.7% |
| Dating | 29.6% | 11.4% | 5.1% | ↓ 24.5% |
| Sports | 27.6% | 15.3% | 9.9% | ↓ 17.7% |
| Social | 26.3% | 9.3% | 3.9% | ↓ 22.4% |
| Lifestyle | 20.9% | 8.7% | 4.5% | ↓ 16.4% |
| Music | 20.4% | 8.1% | 4.2% | ↓ 16.2% |
| Health & Fitness | 20.2% | 8.5% | 4% | ↓ 16.2% |
| Travel | 20% | 7.6% | 3.6% | ↓ 16.4% |
| Productivity | 17.2% | 7.2% | 4.1% | ↓ 13.1% |
| Food & Drink | 16.5% | 7.2% | 3.9% | ↓ 12.6 |
Food & drink apps have the lowest retention after 1 day (16.5%) and 7 days (7.2%). While Travel has the lowest 30-day retention at 3.6%.
Source: Business Wire, Apptentive, Liftoff
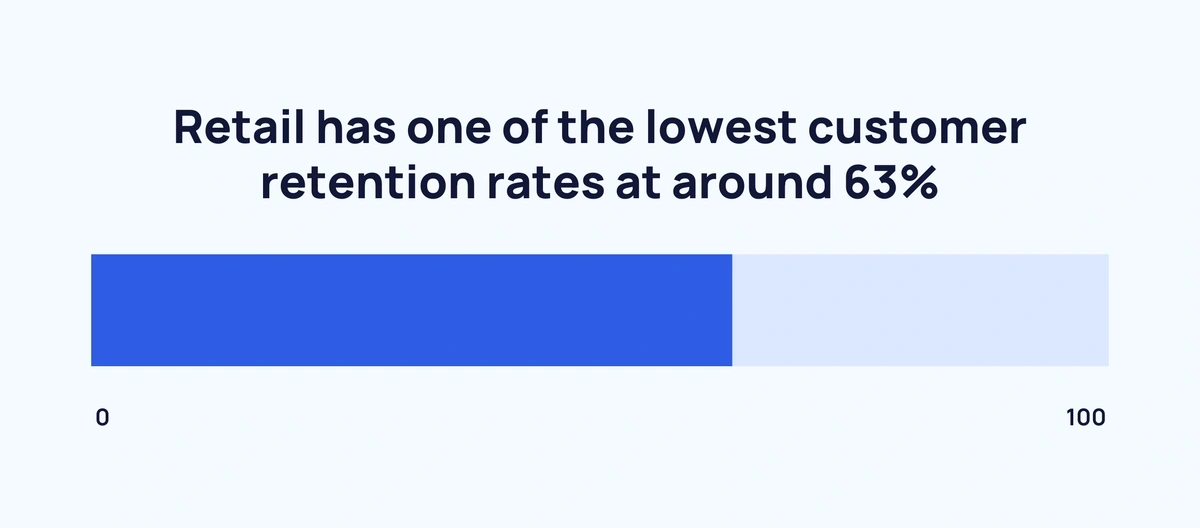
Retail Customer Retention
On average, retail has one of the lowest customer retention rates at around 63%.
Retailers are increasingly reliant on social media to boost sales and customer retention. One of the most popular tools used to engage with customers today is temporary photo/video reels known as ‘stories’.
Instagram stories are an effective way to communicate with customers. Brands that share one story per day have a viewing retention rate of 100%. However, this figure drops by over 40% when brands share 15 stories per day.
Here’s a full breakdown of the retention rate for Instagram brand stories between April 2019 and September 2020:
| Number of Instagram Stories | Retention Rate | Difference Between One Less Story |
| 1 per day | 100% | - |
| 2 per day | 85.21% | ↓ 14.79% |
| 3 per day | 79.04% | ↓ 6.15% |
| 4 per day | 75.71% | ↓ 3.35% |
| 5 per day | 71.79% | ↓ 3.92% |
| 6 per day | 69.03% | ↓ 2.76% |
| 7 per day | 67.51% | ↓ 1.52% |
| 8 per day | 66.18% | ↓ 1.33% |
| 9 per day | 64.6% | ↓ 1.58% |
| 10 per day | 63.2% | ↓ 1.4% |
| 11 per day | 62.17% | ↓ 1.03% |
| 12 per day | 60.11% | ↓ 2.06% |
| 13 per day | 59.28% | ↓ 0.96% |
| 14 per day | 60.92% | ↑ 1.64% |
| 15 per day | 59.4% | ↓ 1.52% |
In the digital age, mobile apps are an imperative retail tool.
Here’s how select types of mobile apps compare in terms of short-term retention:
| App Type | Day 1 Retention | Day 7 Retention | Day 30 Retention | Day 1 to Day 30 Drop-Off |
| Shopping - Marketplace | 33.7% | 16.1% | 8.7% | ↓ 25% |
| Shopping - e-Commerce | 24.5% | 10.7% | 5.6% | ↓ 18.9% |
| Food & Drink | 16.5% | 7.2% | 3.9% | ↓ 12.6% |
Source: Business Wire, Liftoff, Socialinsider
Customer Retention Drivers
Offering positive experiences is an obvious way to ensure a high retention rates.
In fact, the impact of a strong customer experience is enormous.
Customers spend 140% more if their past experience with a business is positive compared to those customers with negative experiences.
Top companies know how important customer experience is in maintaining high retention.
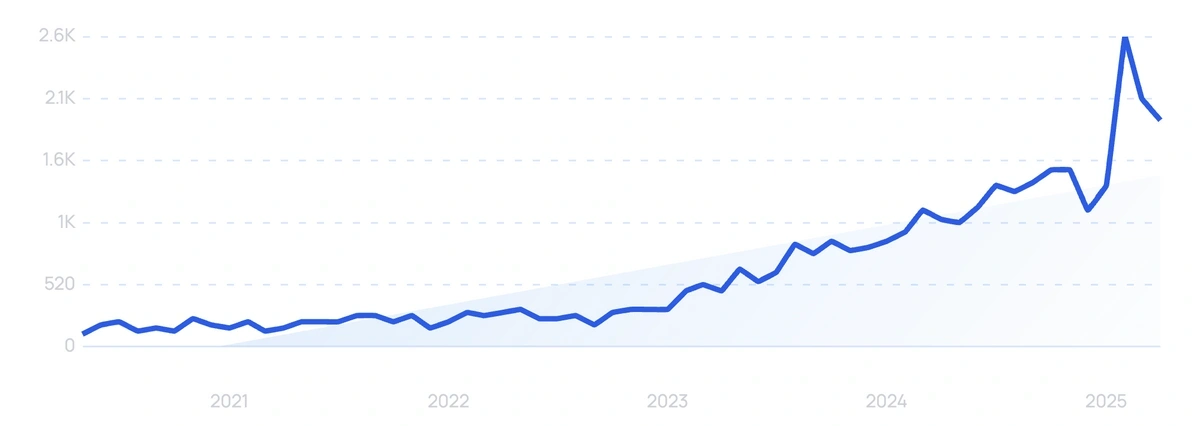
We know this because there's an exponential surge in searches for "ai customer experience" starting in late 2024 and continuing into the first half of 2025 with only a slight relative decline.
In a case study, Tidio shared how they managed an eyewear eCommerce store to boost sales by 25%, largely by leveraging AI to improve customer experience.
With AI tech advancing at a rapid pace, it's easy to foresee a future where AI adoption becomes commonplace for forging strong customer experiences that lead to high retention rates.
Beyond customer experience, companies are also using other means of boosting retention.
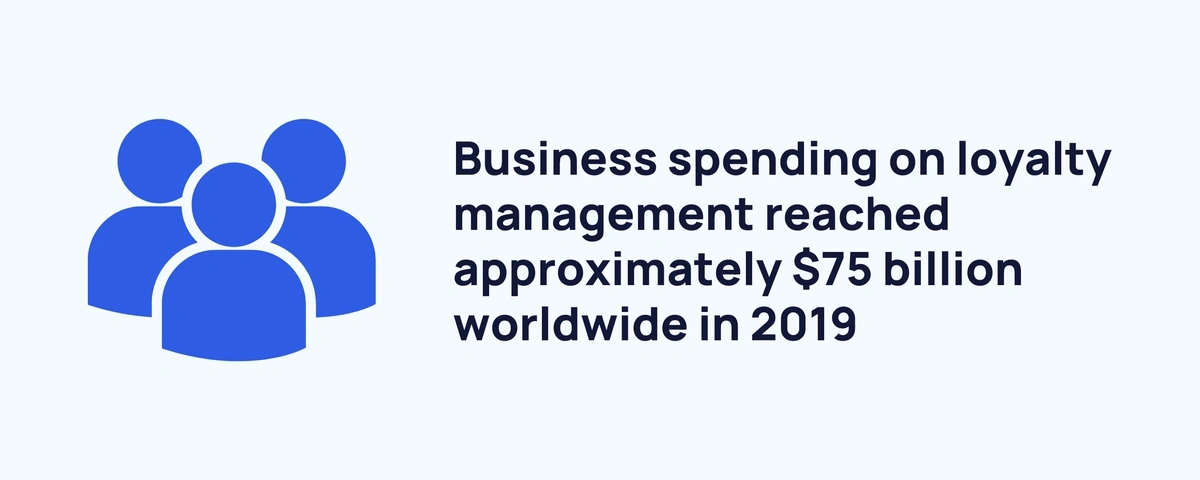
A report revealed that global business spending on loyalty management reached $75 billion in 2019.
The methods employed by companies to boost customer retention can vary greatly.
An older US survey found that email is the number one delivery method used for retention (89%).
Social media engagement (63%) and direct mail (55%) complete the top three.
Television as an institution is said to be on the decline, and that is backed up by the retention data. TV adverts (non-infomercial) and direct response TV ranked bottom of the list with just 7% and 3% of marketers using the method respectively.
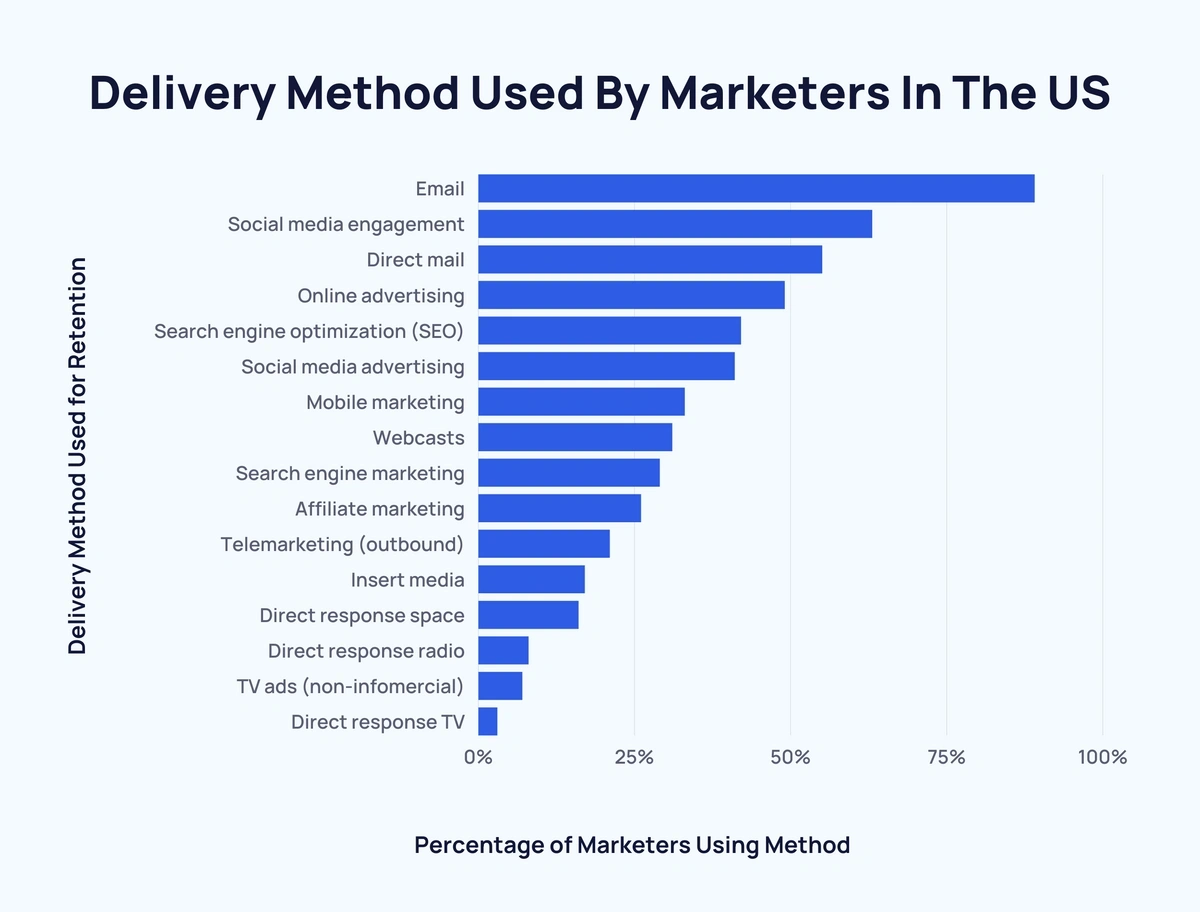
This is the full list of delivery methods used by marketers in the US as of 2015:
| Rank | Delivery Method Used for Retention | Percentage of Marketers Using Method |
| 1 | 89% | |
| 2 | Social media engagement | 63% |
| 3 | Direct mail | 55% |
| 4 | Online advertising* | 49% |
| 5 | Search engine optimization (SEO) | 42% |
| 6 | Social media advertising | 41% |
| 7 | Mobile marketing | 33% |
| 8 | Webcasts | 31% |
| 9 | Search engine marketing | 29% |
| 10 | Affiliate marketing | 26% |
| 11 | Telemarketing (outbound) | 21% |
| 12 | Insert media | 17% |
| 13 | Direct response space | 16% |
| 14 | Direct response radio | 8% |
| 15 | TV ads (non-infomercial) | 7% |
| 16 | Direct response TV | 3% |
*Excluding social media and paid search
Customer service satisfaction plays a large part in customer retention, although the latest data suggests it may be on the decline somewhat.
In 2017, good customer service in the US led to 68% of customers doing more business with that company.
This figure dipped slightly to 66% in 2018. And dropped further to 60% in 2020.
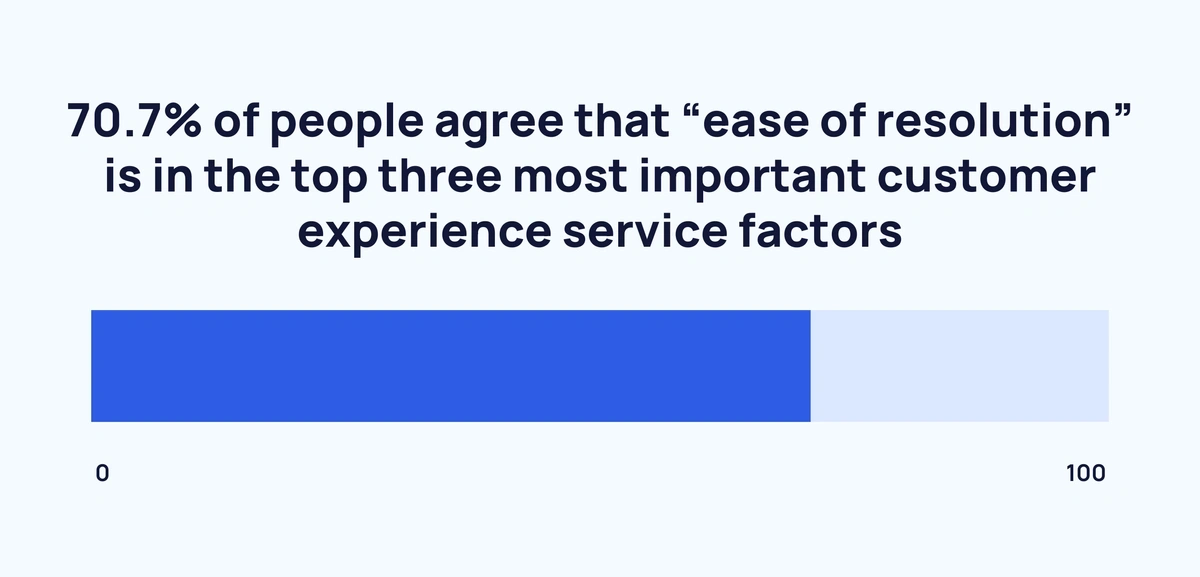
However, the fact that over half of respondents still view customer satisfaction as a key driver to conducting further business is worth noting. Slightly more than 7 in 10 people agree that “ease of resolution” is in the top three most important customer experience service factors.
Here’s the full list of factors impacting customer satisfaction:
| Rank | Factor Impacting Customer Service Satisfaction | Percentage of Respondents Ranking Factor in Top Three Most Important |
| 1 | Ease of resolution (customer effort) | 70.7% |
| 2 | Agent knowledge | 52.5% |
| 3 | Ease of contact (choice/accessibility) | 42.8% |
| 4 | Time taken to resolve queries | 40.5% |
| 5 | Organizational policies | 23.9% |
| 6 | Same issues recur repeatedly/feedback goes unanswered | 22% |
| 7 | Digital channel/function doesn’t work | 16.2% |
| 8 | Preferred channel not available | 10.8% |
| 9 | Can’t trust services will be delivered | 9.2% |
| 10 | Other | 5.9% |
| 11 | Difficult to speak with a human | 3.6% |
Another important driver of customer retention is loyalty programs.
According to business executives in 2019, these are the most important features of a successful loyalty program:
| Loyalty Program Feature | Importance* | Importance in 5 Years* | Difference |
| Exceptional Customer Service | 51% | 50% | ↓ 1% |
| Digital and omnichannel access | 48% | 53% | ↑ 5% |
| Ease of use | 45% | 39% | ↓ 6% |
| Personalized offers | 42% | 45% | ↑ 3% |
| Economic rewards** | 42% | 26% | ↓ 16% |
| Social media engagement | 38% | 27% | ↓ 11% |
| Experiences and emotional brand connection | 33% | 35% | ↑ 2% |
| Social impact/sustainability | 24% | 32% | ↑ 8% |
| Building a community among consumers | 20% | 26% | ↑ 6% |
| Perks and services*** | 19% | 14% | ↓ 5% |
| Forging cross-industry partnerships | 13% | 18% | ↑ 5% |
| Access to expert advice/assistance from humans | 12% | 16% | ↑ 4% |
| Gamification | 10% | 10% | - 0% |
*Percentage of respondents who believe the feature is one of the most important
**Points, miles, cashback, etc
***Concierge service, early access to new products, airline lounge access
Business executives are investing in technology to improve customer loyalty strategies.
Mobile capabilities are the primary area of investment according to a May 2019 survey.
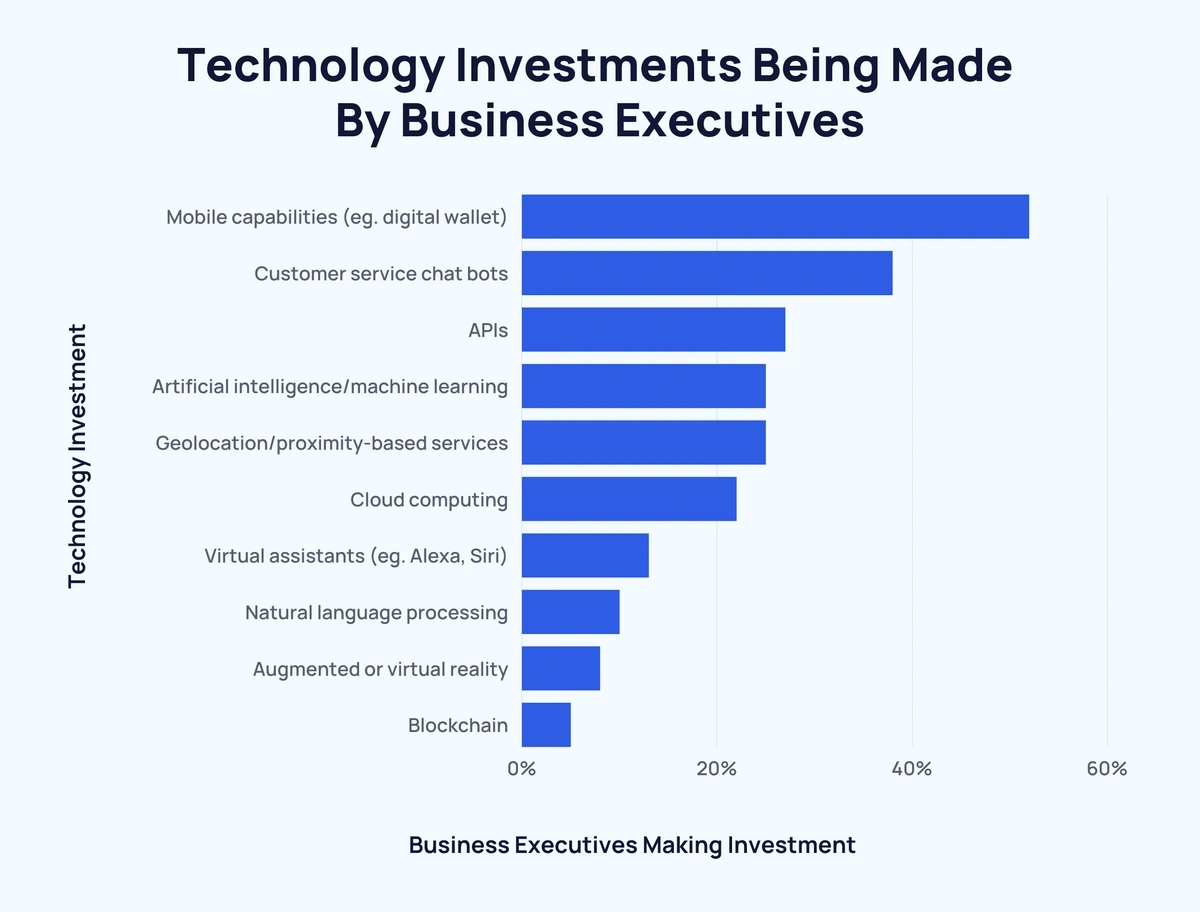
Here’s a rundown of the technology investments being made by business executives in order to improve customer retention:
| Rank | Technology Investment | Business Executives Making Investment |
| 1 | Mobile capabilities (eg. digital wallet) | 52% |
| 2 | Customer service chatbots | 38% |
| 3 | APIs | 27% |
| =4 | Artificial intelligence/machine learning | 25% |
| =4 | Geolocation/proximity-based services | 25% |
| 6 | Cloud computing | 22% |
| 7 | Virtual assistants (eg. Alexa, Siri) | 13% |
| 8 | Natural language processing | 10% |
| 9 | Augmented or virtual reality | 8% |
| 10 | Blockchain | 5% |
The high ranking for customer service chatbots reflects the rise of AI in customer service. Conversational AI searches are up 1900% in the last 5 years.
Source: Business Wire, Statista, Aspect, NTT, Harvard Business Review
Conclusion
Customer retention is incredibly industry-specific and time-sensitive.
Yet, many business executives face an increasingly uphill task when it comes to retention as user demands continually shift. And expectations often evolve regardless of industry.
If you enjoyed these stats, take a look at these related pages: Important Consumer Trends and Notable Customer Experience Startups.
Stop Guessing, Start Growing 🚀
Use real-time topic data to create content that resonates and brings results.

Exploding Topics is owned by Semrush. Our mission is to provide accurate data and expert insights on emerging trends. Unless otherwise noted, this page’s content was written by either an employee or a paid contractor of Semrush Inc.
Share
Newsletter Signup
By clicking “Subscribe” you agree to Semrush Privacy Policy and consent to Semrush using your contact data for newsletter purposes
Written By


Josh is the Co-Founder and CTO of Exploding Topics. Josh has led Exploding Topics product development from the first line of co... Read more