


Get Advanced Insights on Any Topic
Discover Trends 12+ Months Before Everyone Else
How We Find Trends Before They Take Off
Exploding Topics’ advanced algorithm monitors millions of unstructured data points to spot trends early on.

Keyword Research
Performance Tracking
Competitor Intelligence
Fix Your Site’s SEO Issues in 30 Seconds
Find technical issues blocking search visibility. Get prioritized, actionable fixes in seconds.
Powered by data from
Latest Blog Posts
Featured Case Studies
See what's trending before everyone else
Each week, we'll send you our best Exploding Topics. Plus, expert insight and analysis.
51 Employee Productivity & Engagement Stats (2024)

Assuming a 40-hour work week, an employee gives their company 2,000 hours of work every year. Those 2,000 hours can look very different depending on the employee, the company, and the industry. When it comes to actual productivity, the numbers can get tricky.
Unlike profits and losses, productivity can’t be objectively measured for most roles. Each company has its own metrics for evaluating employee output.
If we look at employee productivity from more than one angle, we can start to see a clearer picture. In this report, you’ll see what productivity looks like from an employee and employer perspective. You’ll also learn how engagement, job satisfaction, and technology all affect workplace productivity.
Top Employee Productivity Statistics
Before getting into the full report, here are 5 quick stats to get you started:
- Only 23% of the workforce is engaged at work.
- A single distraction can waste 4.8% of the workday.
- 21% of remote workers report being “burned out”.
- Engaged employees are 44% less likely to experience stress throughout the workday.
- 70% of employees say they would be more productive if they were in fewer meetings.
Next, we’ll look at some of the latest office productivity numbers.
Workplace Productivity Statistics
How much time at work is spent actually being productive? Is there a gap between employees' and management’s perceptions of workplace productivity? These stats examine how time is spent (and wasted) in the workplace.
On average a single distraction wastes 4.8% of the workday (FastCompany)
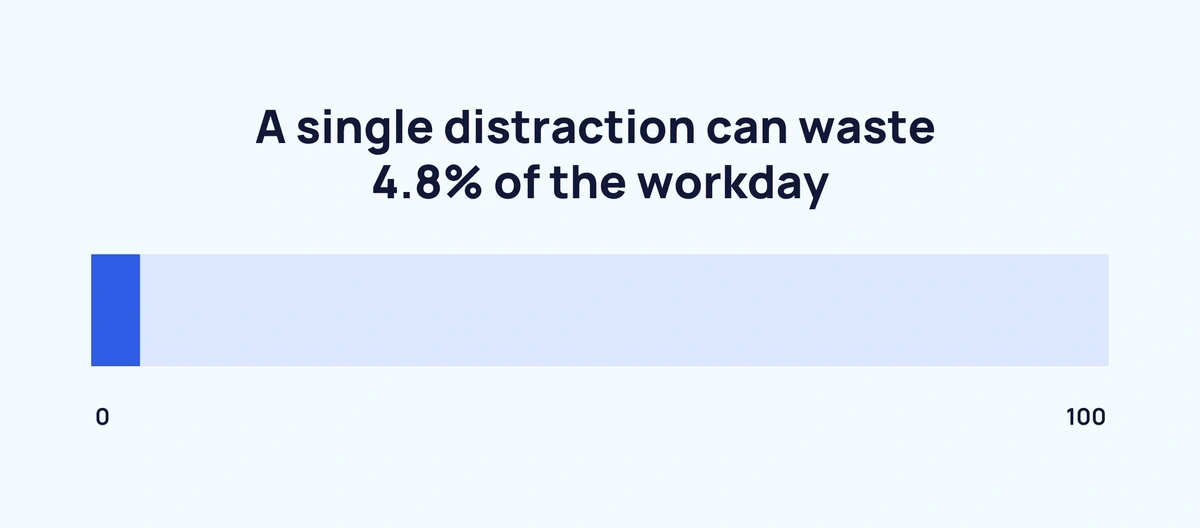
It takes an average of 23 minutes and 15 seconds to resume a task after an interruption, according to a University of California Irvine study. While an interruption might only last a few seconds, that recovery time amounts to 4.8% of an 8-hour day.
Digital workers log an average of 6 hours and 59 minutes of productive time each workday (ActivTrak)
According to ActivTrak’s research involving 134,260 employees, the average digital worker is productive for 94% of their total work time. Here’s a breakdown of the average digital workday in 2022:
- The typical workday spans 10 hours and 7 minutes
- Of that time, 7 hours and 24 minutes (73%) are spent working
- 94% — or 6 hours and 59 minutes—of total work time is “productive time”
- 4 hours and 42 minutes (67%) of productive time is deep, focused work
- 1 hour and 42 minutes (24%) of productive time involved multi-tasking
- 36 minutes (9%) of productive time is spent on collaborative work
On average, Tuesday is the most productive day of the week (ActivTrak)
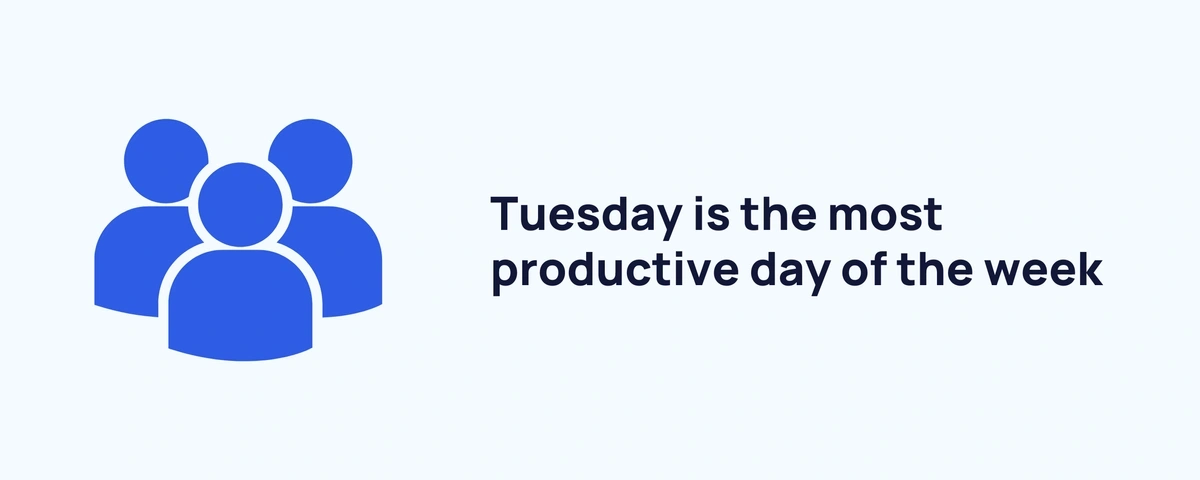
How does productivity change throughout the week? It turns out productivity peaks on Tuesdays, where workers log an average of 6 hours and 59 minutes of productive time. Productivity bottoms out on Fridays at 6 hours and 44 minutes.
You may have heard of the “Monday Blues,” but focus time is actually highest on Mondays: 4 hours and 42 minutes. Friday scores lowest for focus time at 4 hours and 24 minutes.
48% of employees self-report being productive less than 75% of the workday (Wrike)
Is there an engagement-productivity gap? In a survey of 5,000 working adults, 91% self-reported being engaged in the workplace — but only 52% said they were productive at least 75% of the time.
72% of employees believe they could finish at least 30% more work per day with automation tools (Wrike)
Mundane, repetitive tasks can sabotage productivity.
66% of employees claim they spend at least 2 hours per week sending project status update emails and other less-than-productive tasks. 64% say they spend at least 2 hours per week tracking billable hours.
Around 7 in 10 business leaders are pressured by executives to increase employee productivity (Slack)
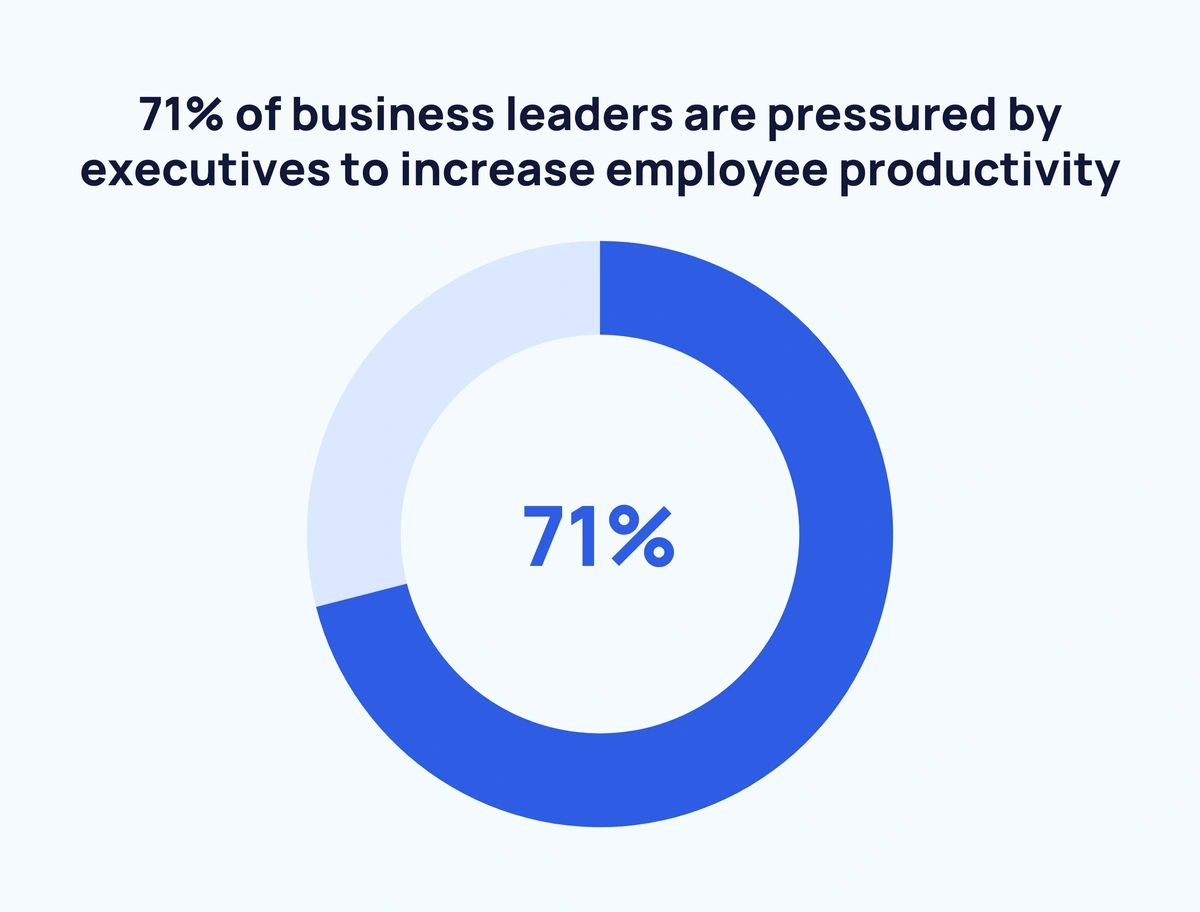
Executives are pushing management teams to get more productivity out of their workers. That pressure is challenging for teams, considering executives use different metrics to measure productivity.
27% of executives use visible activity as their primary productivity metric. 19% use KPIs, objectives, and goals, while 15% use cost metrics to gauge productivity.
Digital workers have strong opinions on how their productivity should be measured. 27% of employees believe KPIs, objectives, and goals should be the gold standard for productivity. 17% think conversations with management should convey productivity levels, while 13% consider hours worked the most important metric.
70% of employees say they would be more productive if they were in fewer meetings (Slack)
Over two-thirds of office workers agree that frequent meetings harm productivity. According to recent data from Dialpad, the average worker attends 12 meetings per month and 83% of workers spend less than a third of their week in meetings.
But 1 in 20 professionals spends 20 hours or more per week in meetings. An additional 12% are in meetings for 12-20 hours each week on average.
The most productive employees are likely to utilize AI and automation in their work (Slack)
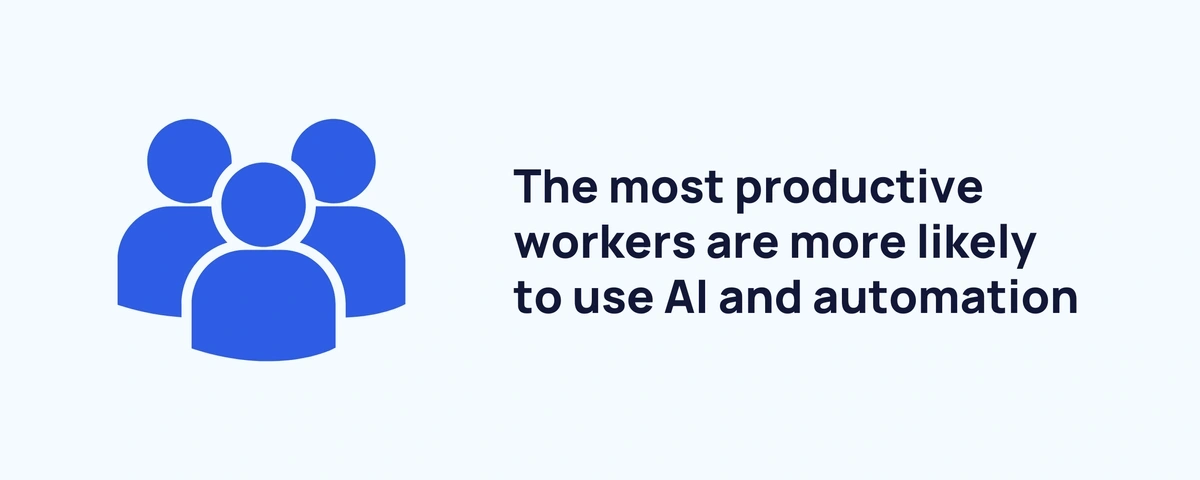
Boosting productivity is one of the top reasons companies introduce new technology in the workplace. The latest productivity numbers show a strong correlation between technology and output.
Productive workers are 242% more likely to use AI and 78% more likely to use automation than their less-productive colleagues. To top it off, workers who use automation can save 3.6 hours per week.
Employee Engagement Statistics
Engagement is the fuel that keeps the productivity train barrelling down the tracks. Engaged employees work more efficiently and effectively than their disengaged counterparts. Here’s a look at the state of employee engagement today.
1 in 8 digital employees spend the majority of the year in an overutilized state (ActivTrak)
When employees spend more time than anticipated on work-related tasks, it’s a sign they’re overutilized — a state that can lead to exhaustion and burnout. ActivTrak’s study found that 12% of employees spend at least 75% of their work year in an overutilized state.
Over 9 in 10 US employees feel engaged at work (Morning Consult)
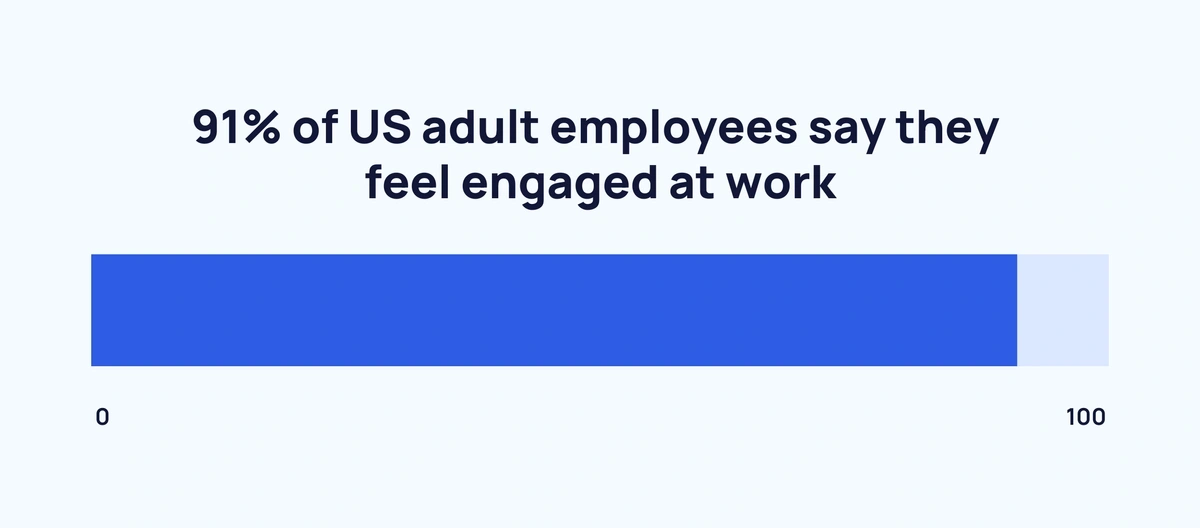
Millions of US workers find ways to stay engaged and productive at work. 79% help co-workers with tasks and find new ways to improve workflows. 65% stay after hours to finish important tasks. 47% even volunteer to do projects outside of their typical work.
Despite that, employees disengage from work in a variety of ways. 52% admit to using a phone or work computer for non-work activities. 41% log off or leave work early. 33% take longer-than-expected breaks.
Engaged employees are 44% less likely to experience stress throughout the workday (Gallup)
As expected, higher engagement leads to higher job satisfaction. 56% of disengaged employees report feeling stress frequently throughout the day. Just 30% of engaged employees feel those same levels of stress.
Engaged employees are also 30% less likely to actively pursue new career opportunities than their disengaged colleagues.
Remote Work Productivity Statistics
The COVID-19 pandemic accelerated the remote work revolution. In the post-pandemic world, many remote employees are returning to the office or doing hybrid work. How do remote workers compare to in-office workers in productivity and engagement?
7 in 10 remote workers find it easier to do focused work while working remotely (Buffer)

Remote workers perceive several aspects of their jobs as easier than they would be if they worked in the office. 65% believe it’s easier to manage stress while working remotely, and 50% find it easier to avoid distractions.
28% of remote workers believe it’s harder to get promoted remotely vs. in-person (Buffer)
Remote work comes with its challenges. 37% say remote work makes it difficult to receive recognition from leadership teams. 30% of remote workers say they struggle to collaborate effectively.
Around 2 in 5 remote workers claim they’re burned out (Buffer)
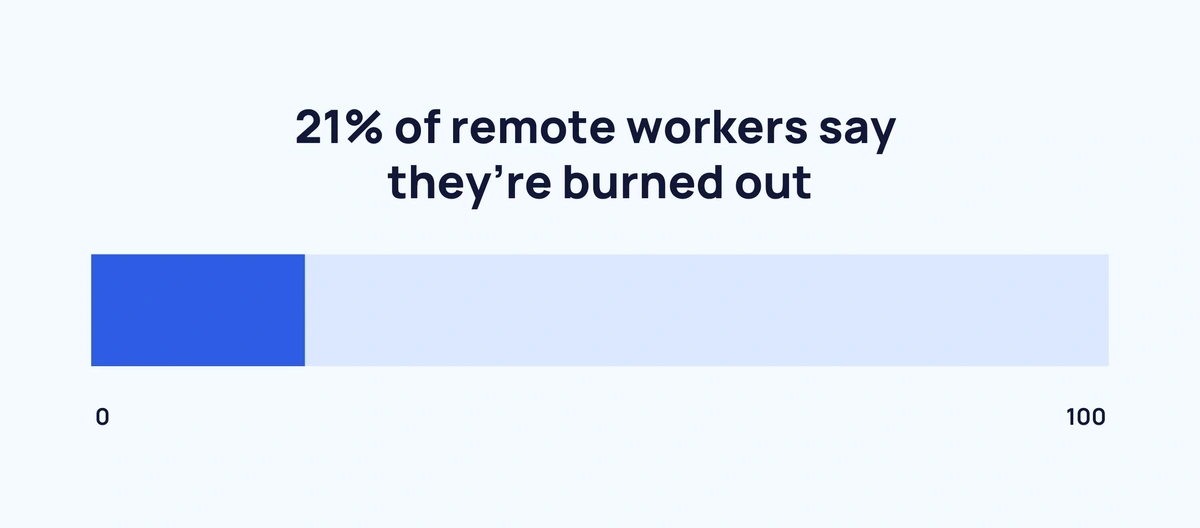
48% of remote workers say they feel energized by their remote work arrangement, but one-fifth are currently experiencing burnout. One possible cause for burnout is increased workloads. 44% of remote workers say they’re putting in more hours this year than they did last year.
One-third of remote workers report feeling “very engaged” at work (Buffer)
It’s hard to be productive if you’re disengaged. Thankfully, 53% of remote workers feel at least some level of engagement. Of those who don’t, 30% report feeling “very disengaged” at work.
Employee Satisfaction Statistics
Business leaders looking to improve productivity should always keep employee satisfaction top-of-mind. Low satisfaction leads to low engagement — one of the biggest productivity killers.
Around 4 in 5 US adults are at least somewhat satisfied with their current employment (Morning Consult)
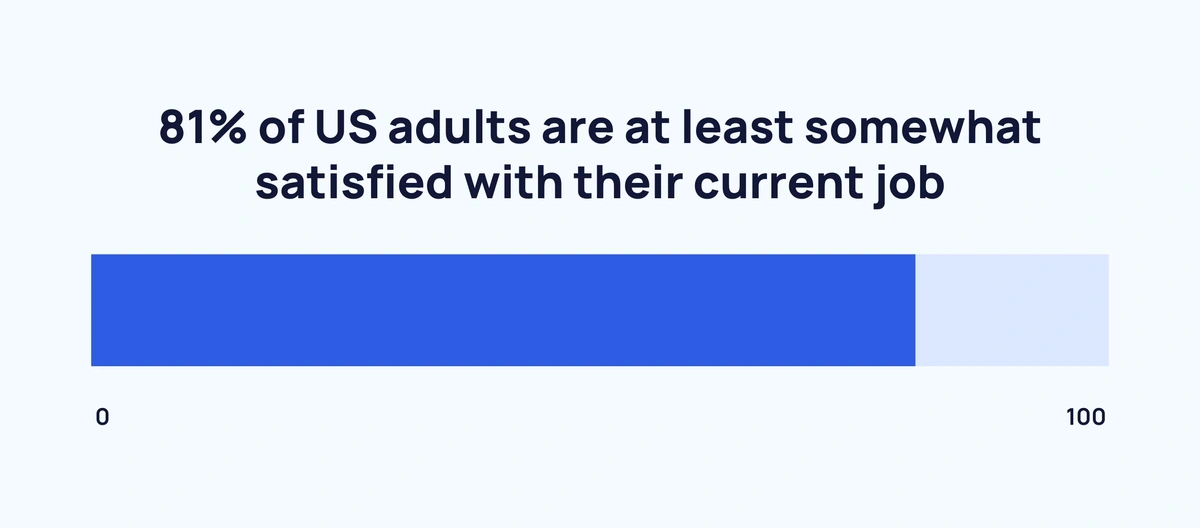
43% of US adult employees — 69 million individuals — say they are “very satisfied” with their current job. An additional 38% say they are “somewhat satisfied.”
On the other hand, 6% of employed adults are “very dissatisfied” and 11% are “somewhat dissatisfied” with their work.
34% of US workers say they want to leave their current job (Morning Consult)
The percentage of employees looking to change jobs went from 43% in 2022 to 34% in 2023. Still, more than one-third of US adult workers want to leave their jobs for one or multiple reasons. Of those who wish to change jobs:
- 46% feel underpaid.
- 39% want a better work-life balance.
- 33% feel burned out.
- 31% want more flexibility, remote or hybrid work.
US workers are most satisfied with job flexibility and most dissatisfied with pay (Morning Consult)
Careers are complex. Some aspects of a job may be attractive while others cause worry and stress. The US workforce is broadly satisfied with their jobs’ flexibility (79%), co-workers (75%), and commute time (73%).
Areas where workers are dissatisfied? Pay (27%), promotion process (27%), and company leadership (24%).
Gen Z workers have lower satisfaction, lower engagement, and higher burnout than the population as a whole (Morning Consult)
Recent numbers show Gen Z is struggling to thrive in today’s work environment. 84% of Gen Z workers feel engaged at work compared to 91% of all workers.
21% say they don’t get enough hours from their job, whereas 15% of all workers say the same.
Gen Z workers are also 11% more likely to feel too tired after work to enjoy their personal life than the average US worker.
Wrap Up
No one is productive 100% of the time. The amount of productive time an employee gives depends on many internal and external factors.
Distractions, excessive meetings, and busy work that can be automated are all external factors that drag down productivity. Internally, low job satisfaction, burnout, and work-life balance issues can all harm productivity, too.
How can leaders improve workplace productivity? By eliminating distractions, automating where possible, and focusing on satisfaction and engagement.
Stop Guessing, Start Growing 🚀
Use real-time topic data to create content that resonates and brings results.

Exploding Topics is owned by Semrush. Our mission is to provide accurate data and expert insights on emerging trends. Unless otherwise noted, this page’s content was written by either an employee or a paid contractor of Semrush Inc.
Share
Newsletter Signup
By clicking “Subscribe” you agree to Semrush Privacy Policy and consent to Semrush using your contact data for newsletter purposes
Written By


Josh is the Co-Founder and CTO of Exploding Topics. Josh has led Exploding Topics product development from the first line of co... Read more