


Get Advanced Insights on Any Topic
Discover Trends 12+ Months Before Everyone Else
How We Find Trends Before They Take Off
Exploding Topics’ advanced algorithm monitors millions of unstructured data points to spot trends early on.

Keyword Research
Performance Tracking
Competitor Intelligence
Fix Your Site’s SEO Issues in 30 Seconds
Find technical issues blocking search visibility. Get prioritized, actionable fixes in seconds.
Powered by data from
Latest Blog Posts
Featured Case Studies
See what's trending before everyone else
Each week, we'll send you our best Exploding Topics. Plus, expert insight and analysis.
38+ Employee Turnover Stats (2024-2027)

Employee turnover costs companies a lot of money. In fact, the US is predicted to lose over $400 billion annually by 2030 due to this.
And resignations remain a leading cause of employee turnover.
Below, we have statistics related to employee turnover including changes over time, demographics, and associated factors.
Contents
- Top Employee Turnover Statistics (2024)
- Employee Attrition Over Time
- US Employee Attrition
- Employee Attrition by Demographic
- Employee Tenure by Demographic
- Turnover Factors
- The Finances of Employee Turnover
Top Employee Turnover Statistics (2024)
- Almost 50% of employees leave or change jobs per year
- Over 4 million Americans quit their job each month
- Nearly 50% of US employees are actively searching for a new job
- More than 1 in 4 US jobs are unfilled after 2 months
- Around 1 in 3 employees quit within 6 months
- The average Italian spends 12.2 years with the same employer
- Resignations make up 70% of all employee turnover
Employee Attrition Over Time
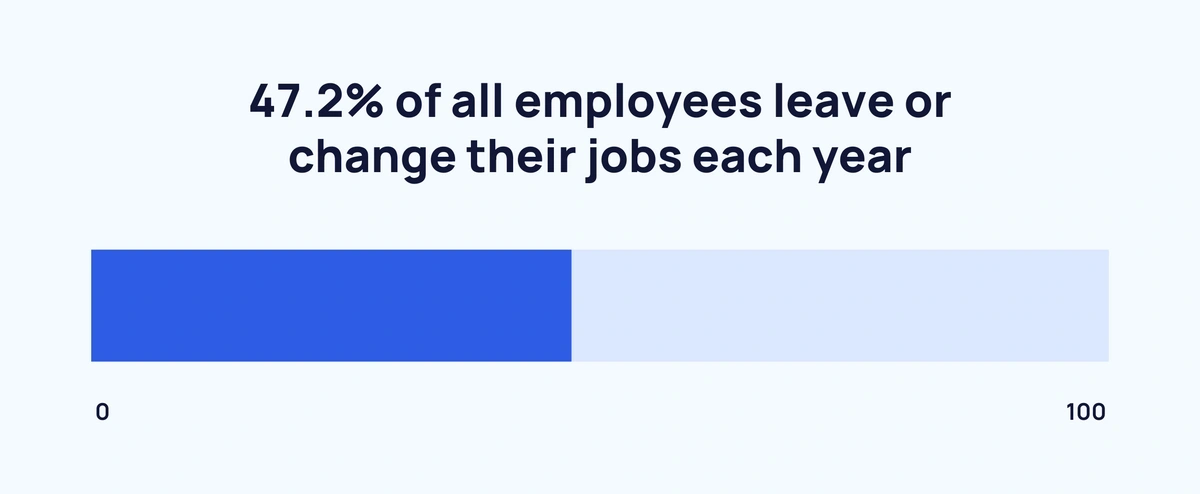
Nearly 50% of employees leave or change jobs each year (Bureau of Labor Statistics)
The latest available data from the Bureau of Labor Statistics shows that 2021’s employee turnover dropped 9.6% from 2020’s 56.8% to 47.2%.
However, this figure is still up from 2019 (45.1%) and 2018 (44.5%).
The global employee attrition rate almost doubled between 2013 and 2021 (Kimble)
In 2013, the employee attrition rate of professional service organizations stood at 8.3%.
By 2021, this figure had grown to 14%.
Here’s how the global employee attrition rate of professional service organizations has changed over time:
|
Year |
Attrition Rate |
Change Over Previous Year |
|
2013 |
8.3% |
- |
|
2014 |
8.9% |
↑ 0.6% |
|
2015 |
12.9% |
↑ 3% |
|
2016 |
13.6% |
↑ 0.7% |
|
2017 |
12.4% |
↓ 1.2% |
|
2018 |
13.9% |
↑ 1.5% |
|
2019 |
13.2% |
↓ 0.7% |
|
2020 |
11.6% |
↓ 1.6% |
|
2021 |
14% |
↑ 2.4% |
US Employee Attrition
4.2 million Americans quit their job every month (Bureau of Labor Statistics)
In 2022, a total of 50.6 million US employees resigned from their jobs.
Monthly, that equates to over 4 million people - 2.5% of the national workforce.

The turnover rate for temporary and contract staff in the US reached 415% in 2021 (American Staffing Association)
The percentage of employees in the workforce who have left in the previous 12 months has seen a general upward trend since 2013.
There has been a general upward trend in the turnover rate for temporary and contract staff in the US since 2013:
|
Year |
Turnover Rate |
Change Over Previous Year |
Average Tenure |
Change Over Previous Year |
|
2000 |
437% |
- |
9.7 weeks |
- |
|
2001 |
411% |
↓ 26% |
10.2 weeks |
↑ 0.5 weeks |
|
2002 |
402% |
↓ 9% |
10.4 weeks |
↑ 0.2 weeks |
|
2003 |
391% |
↓ 11% |
10.6 weeks |
↑ 0.2 weeks |
|
2004 |
374% |
↓ 17% |
11 weeks |
↑ 0.5 weeks |
|
2005 |
359% |
↓ 15% |
11.3 weeks |
↑ 0.3 weeks |
|
2006 |
356% |
↓ 3% |
11.4 weeks |
↑ 0.1 weeks |
|
2007 |
305% |
↓ 51% |
12.8 weeks |
↑ 1.4 weeks |
|
2008 |
317% |
↑ 12% |
12.5 weeks |
↓ 0.3 weeks |
|
2009 |
328% |
↑ 11% |
12.1 weeks |
↓ 0.4 weeks |
|
2010 |
277% |
↓ 51% |
13.8 weeks |
↑ 1.7 weeks |
|
2011 |
361% |
↑ 84% |
11.3 weeks |
↓ 1.5 weeks |
|
2012 |
292% |
↓ 69% |
13.3 weeks |
↑ 2 weeks |
|
2013 |
264% |
↓ 28% |
14.3 weeks |
↑ 1 week |
|
2014 |
359% |
↑ 5% |
11.3 weeks |
↓ 3 weeks |
|
2015 |
383% |
↑ 24% |
10.8 weeks |
↓ 0.5 weeks |
|
2016 |
352% |
↓ 31% |
11.5 weeks |
↑ 0.7 weeks |
|
2017 |
386% |
↑ 34% |
10.7 weeks |
↓ 0.8 weeks |
|
2018 |
420% |
↑ 34% |
10 weeks |
↓ 0.7 weeks |
|
2019 |
415% |
↓ 5% |
10.1 weeks |
↑ 0.1 weeks |
|
2020 |
443% |
↑ 28% |
9.6 weeks |
↓ 0.5 weeks |
|
2021 |
415% |
↓ 28% |
10.1 weeks |
↑ 0.5 weeks |
US voluntary turnover has doubled since 2011 (Work Institute)
In 2011, approximately 25 million people in the US quit their jobs.
By 2021, this figure had doubled to approximately 50 million.
Almost half of all US employees are actively seeking a new job (Jobvite)
As many as 45% of all US employees are actively taking steps to find a new position within the next year.
Of those searching, over half (54%) are not considering their current company for a new role.
Employee Attrition by Demographic
Employee Attrition by Region
Employee attrition rates in the Americas have remained between 11% and 14% since 2015 (Service Performance Insight)
Between 2015 and 2021, the lowest attrition rate of any region was 10.1% for Europe, the Middle East, and Africa in 2015.
While the highest attrition rate in that time period was Asia Pacific’s 16% in 2026.
Here’s the attrition rate for selected regions between 2015 and 2021:
|
Year |
Americas |
Europe, Middle East, Africa |
Asia Pacific |
|
2015 |
13.7% |
10.1% |
13.3% |
|
2016 |
13.9% |
11.6% |
16% |
|
2017 |
12.5% |
10.7% |
12.8% |
|
2018 |
13.9% |
12.3% |
13.4% |
|
2019 |
13.4% |
12% |
13.4% |
|
2020 |
11.4% |
11.4% |
13.9% |
|
2021 |
14.2% |
13.2% |
13.7% |
Over 1 in 4 US jobs remain unfilled after 60 days (Indeed)
According to Indeed, 25.84% of US job vacancies remain unfilled after 60 days.
That figure is almost 2x that of the UK. And more than 18x that of China.
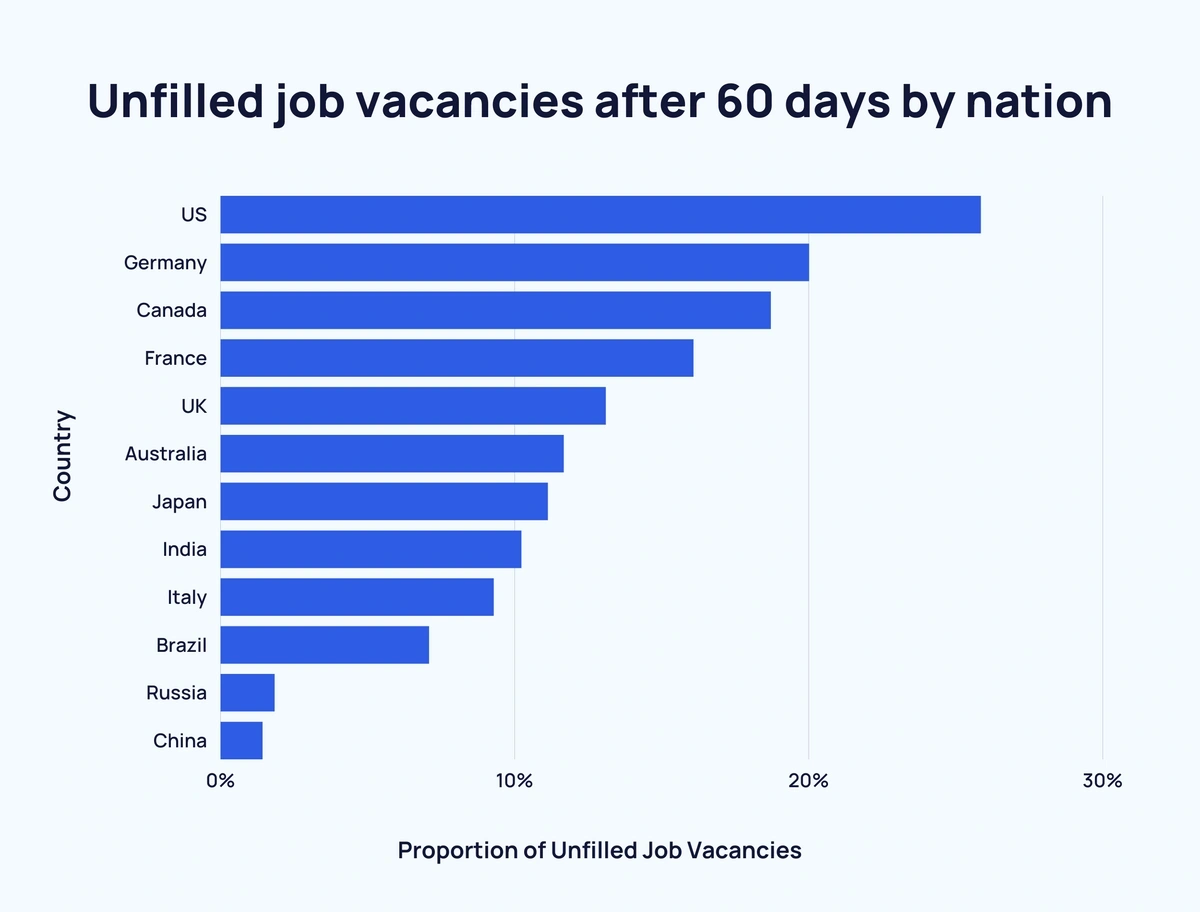
Here are the statistics for unfilled job vacancies after 60 days across various nations:
|
Country |
Proportion of Unfilled Job Vacancies |
|
US |
25.84% |
|
Germany |
20% |
|
Canada |
18.7% |
|
France |
16.07% |
|
UK |
13.09% |
|
Australia |
11.66% |
|
Japan |
11.12% |
|
India |
10.22% |
|
Italy |
9.28% |
|
Brazil |
7.08% |
|
Russia |
1.83% |
|
China |
1.42% |
Employee Attrition by Generation
2 in 5 Gen Zs would like to leave their job in the next 2 years (Deloitte)
As many as 40% of Gen Zs want to leave their current employment in the next 24 months. This figure is down from 2021’s 53%.
By comparison, 25% of Millenials would like to do the same - a dramatic fall from 2019’s 49%.
Over 1/3rd of Millenials plan to stay at their job for 5+ years (Deloitte)
Almost 2 in 5 (38%) Millennials would like to stay in their current job for 5 years or more. That’s a 4% rise from 2021’s 34%.
Gen Z’s figures are considerably lower but have also seen a rise. In 2021, 21% of Gen Zs wanted to stay in their current job for over half a decade. While in 2022, 23% agreed.
Over 1/3rd of Gen Z would leave their job without another lined up (Deloitte)
A recent survey revealed that 35% of Gen Z would be willing to leave their current employment before securing another job.
Similarly, 32% of Millenials agree.
Around half of Gen Zs working in consumer jobs would like to leave (Deloitte)
Public-facing roles appear to be particularly unfavorable among Gen Z.
In total, 49% of Gen Zs employed in consumer-based roles would like to quit in the next two years. Likewise, 48% who work in the retail sector want to leave in the next two years.
Here’s a breakdown of eagerness to leave various job roles by generation:
|
Role |
Gen Z |
Millennials |
Difference |
|
Consumer |
49% |
25% |
+ 24% (Gen Z) |
|
Retail |
48% |
25% |
+ 23% (Gen Z) |
|
Energy/Mining |
46% |
34% |
+ 12% (Gen Z) |
|
Education |
42% |
27% |
+ 15% (Gen Z) |
|
Health Care/Life Science |
41% |
29% |
+ 12% (Gen Z) |
Employee Tenure by Demographic
Around 1 in 3 employees leave their job within the first 6 months (BambooHR)
According to a recent report, around 31% of people depart their jobs within 6 months of starting.
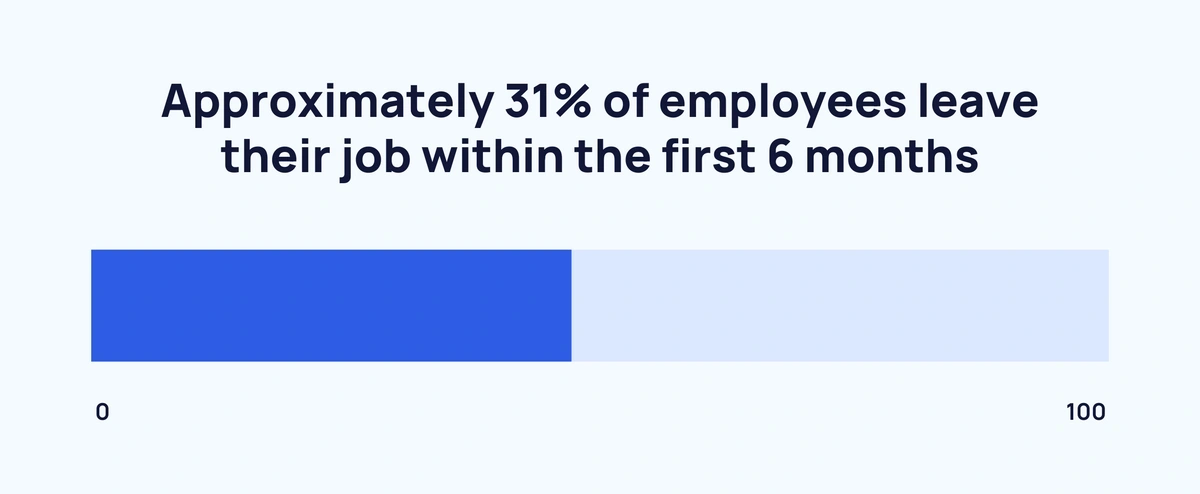
Of those quitting, 68% leave in the first 3 months.
Employee Tenure by Region
US employees have a median company tenure length of 4.1 years (Bureau of Labor Statistics)
As of early 2022, data from the Bureau of Labor Statistics shows that employees average just over 4 years with an employer.
The average Italian spends 12.2 years in the same job (OECD)
Italy tops the charts for the longest average time spent with the same employer in an Organisation for Economic Co-operation and Development (OECD) country.
Here’s how Italy compares to other select OECD countries in terms of time spent in a job:
|
Country |
Time Spent with the Same Employer |
|
Italy |
12.2 years |
|
France |
10.8 years |
|
Germany |
10.2 years |
|
Spain |
10 years |
|
Sweden |
8.1 years |
|
UK |
8 years |
|
Denmark |
7.2 years |
|
South Korea |
5.9 years |
Italy has the best work-life balance of 41 assessed nations (OECD)
Perhaps linked to its long average continuous employment, Italy scores a 9.4 out of 10 for work-life balance.
Here are the top OECD countries by work-life balance score:
|
Country |
Work-Life Balance Score |
Time Spent with Employer |
|
Italy |
9.4 |
12.2 years |
|
Denmark |
8.6 |
7.2 years |
|
Norway |
8.5 |
-* |
|
Spain |
8.4 |
10 years |
|
Netherlands |
8.3 |
-* |
|
France |
8.1 |
10.8 years |
|
Sweden |
8.1 |
8.1 years |
|
Germany |
8.0 |
10.2 years |
* Data unavailable.
Employee Tenure by Gender
The median length of company tenure is 6 months longer for men than women (Bureau of Labor Statistics)
For women, this tenure is 3.8 years. Whereas for men, the median length of single-company employment is 4.3 years.
Employee Tenure by Age
The median length of company tenure is more than 3x longer for 55 to 64-year-olds compared to 25 to 34-year-olds (Bureau of Labor Statistics)
The median length of continuous employment for 55 to 64-year-olds is 9.8 years.
While the median length of employment at the same company is far shorter (2.8 years) for 25 to 34-year-olds.
Over 5x more 60 to 64-year-olds have been employed by the same employer for 10+ years than 30 to 34-year-olds (Bureau of Labor Statistics)
Older employees tend to stay in the same job for longer.
Over half (54%) of workers aged 60 to 64-year-olds have been in the same job for over 10 years. By comparison, this is true for just 9% of 30 to 34-year-olds.
Turnover Factors
Resignations make up 70% of employee turnover (Bureau of Labor Statistics)
For every 10 US job separations in 2022, 7 were resignations.
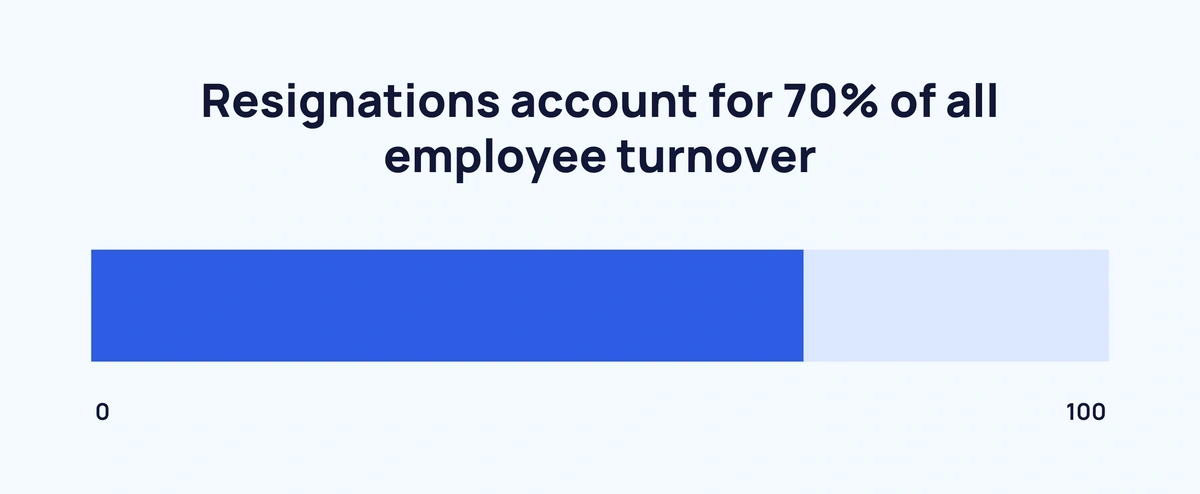
That’s the Bureau of Labor Statistics’ highest annual level on record.
Onboarding
Around 7 in 10 employees are more likely to stick with their company after good onboarding (O.C. Tanner)
In total, 69% of employees are more likely to stay with their current employer for 3+ years after a successful onboarding experience.
E-learning during onboarding can improve retention by 60% (Training Industry)
The components of an onboarding process can have a significant effect on employee retention.
Onboarding that includes e-learning can increase retention by 20-60%.
By comparison, the inclusion of traditional training in the onboarding process improves retention by 8-10%.
Engagement & Appreciation
Around 3 in 4 employees do not feel connected to their company’s mission (Harvard Business School)
Engagement is an important part of job satisfaction and productivity. Yet, just 28% of employees feel connected to their company’s mission.
Around 4 in 5 former employees cite lack of appreciation as a key reason for leaving (O.C. Tanner)
A recent study found that 79% of employees who left their job cited a lack of appreciation from their former employer as a reason for quitting.
Furthermore, 65% of Americans claimed that they weren’t recognized once in the previous 12 months of work.
More than half of quitting workers say their organization could have prevented their departure (Gallup)
52% of employee departures could have been prevented by manager or organization intervention.
In addition, 51% of leaving employees claimed that their manager did not speak to them about job satisfaction in the final three months before departure.
Burnout
Intensity of workload causes burnout for almost half of all employees (Deloitte)
46% of Gen Zs and 45% of Millenials claim they feel burnout from the intensity of their workload.
As a result, 44% of Gen Zs and 43% of Millenials have recently left their job due to burnout.
Over 20% of employees think their employer is not adequately addressing burnout issues (Deloitte)
20% of Gen Zs and 24% of Millenials believe that their current employer is not taking the issue of employee burnout seriously or taking steps to prevent it.
46% of HR leaders claim that employee burnout could be responsible for as much as half of all workforce turnover (Forbes)
Employee burnout is responsible for between 20% and 50% of workforce turnover according to 46% of HR leaders.
Workplace Environment
Co-worker connections are more important than supervisors in terms of employee happiness (TINYpulse)
According to a recent study, the happiness of employees is 23.3% more affected by co-worker relationships than it is by supervisors.
Employees are more likely to leave due to toxic workplace culture than salary issues (HR News)
A toxic workplace environment is 10.4x more likely to cause an employee to quit than salary issues are.
Companies that offer remote work have a 25% lower turnover rate (Owl Labs)
Offering remote work has been shown to reduce turnover.
According to Owl Labs, turnover is 25% lower for companies that offer remote work. And 68% of employees believe they are successful working from home.
Growth & Development
About 3 in 5 companies do not have clear goals for employees (O.C.Tanner)
Setting clear goals is thought to significantly improve customer retention.
However, 60% of companies indicate that they do not include clear employee goals in the hiring process.
Lack of career development is the main reason for quitting a job (McKinsey & Company)
The most common reason people gave for quitting their jobs between April 2021 and April 2022 was a lack of career development/advancement (41%).
This was followed by inadequate compensation (36%) and uncaring/uninspiring leaders (34%).
Here are the full survey results for job resignation reasons:
|
Reason |
Proportion Who Have Resigned |
|
Lack of career development/advancement |
41% |
|
Inadequate compensation |
36% |
|
Uncaring/uninspiring leaders |
34% |
|
Lack of meaningful work |
31% |
|
Unsustainable work expectations |
29% |
|
Unreliable/unsupportive colleagues |
26% |
|
Lack of workplace flexibility |
26% |
|
Lack of support for health/well-being |
26% |
Salary
Almost half of all employees would leave their company for a pay raise (Gallup)
A Gallup study found that 44% of workers would leave their jobs if offered a raise of 20%.
57% agree that rising salary expectations is currently the biggest recruitment/retention challenge (CompTIA)
More than half of respondents (57%) believe that salary expectations are a factor influencing recruitment/retention challenges.
Similarly, 53% of respondents think that work-life balance expectations influence the challenges of recruitment/retention.
Here are the survey results in full:
|
Factor |
Proportion Who Agree This is a Challenge |
|
Salary expectations |
57% |
|
Work-balance expectations |
53% |
|
Remote work expectations |
45% |
|
Competition for well-rounded candidates: technical and soft skills |
41% |
|
Career advancement expectations |
38% |
The Finances of Employee Turnover
9 in 10 HR experts consider retention a high priority (Kronos)
As many as 87% of HR experts believe that retention is among the most important factors to focus on over the next five years.
However, 20% of them admit facing difficulties when it comes to maintaining focus on retention, instead diverting attention and budget elsewhere.
Entry-level departures can cost companies as much as 50% of an employee’s annual wage (GrowthForce)
The importance of employee retention is emphasized by the cost of departures.
Entry-level employees leaving can cost their former employers up to half of their annual salary. And the cost of replacing more senior roles can cost as much as 150% of their yearly wages.
The US is expected to lose over $400 billion annually by 2030 due to low employee retention (Catalyst)
The inability to retain employees is costing the US significantly.
By 2030, it is estimated that the US will suffer losses of around $430 billion due to low talent retention. That’s almost 3x more than China’s predicted figure of $147.1 billion.
Conclusion
Evidently, there are a lot of factors at play when it comes to employee turnover.
What can’t be disputed, is that turnover can have serious financial implications and is something that company executives need to address continually.
For more related statistics, take a look at 40+ Fascinating Remote Work Statistics and 7 Remote Work Trends.
Stop Guessing, Start Growing 🚀
Use real-time topic data to create content that resonates and brings results.

Exploding Topics is owned by Semrush. Our mission is to provide accurate data and expert insights on emerging trends. Unless otherwise noted, this page’s content was written by either an employee or a paid contractor of Semrush Inc.
Share
Newsletter Signup
By clicking “Subscribe” you agree to Semrush Privacy Policy and consent to Semrush using your contact data for newsletter purposes
Written By


Fabio is a research associate at Exploding Topics. Since 2021, Fabio has researched, written, and edited articles for the Explo... Read more