


Get Advanced Insights on Any Topic
Discover Trends 12+ Months Before Everyone Else
How We Find Trends Before They Take Off
Exploding Topics’ advanced algorithm monitors millions of unstructured data points to spot trends early on.

Keyword Research
Performance Tracking
Competitor Intelligence
Fix Your Site’s SEO Issues in 30 Seconds
Find technical issues blocking search visibility. Get prioritized, actionable fixes in seconds.
Powered by data from
Latest Blog Posts
Featured Case Studies
See what's trending before everyone else
Each week, we'll send you our best Exploding Topics. Plus, expert insight and analysis.
How Many Google Searches Are There Per Day? (February 2026)

Despite the rise of AI and alternative search engines, Google remains the king of search in 2026.
The search giant processes billions of search queries daily and is the most visited website in the world.
And so far, it appears that AI search has failed to significantly impact the number of Google searches (although there are one or two early signs that the tide may be turning).
In this report, we’ll do a deep dive into the latest data on how many people use Google and the number of searches they process each day.
People Using Google Stats (Top Picks)
- There are approximately 16.4 billion searches on Google every day
- Google processes 189,815 searches per second
- Google drives the highest percentage of search traffic in Nigeria, at 98.69%
- The United States accounts for 20.98% of all Google traffic
- Google’s global market share among search engines is 89.57%
- The US Google site gets 88.5 billion visits each month, of which 5.6 billion are unique visitors
How Many Google Searches Are There Per Day?
Based on the latest available data for Google users in the US, the search engine processes approximately 16.4 billion searches per day.
(This more or less tallies with Google's latest public claim of "over 5 trillion" searches per year. 5 trillion searches a year would equate to 13.69 billion searches per day.)
16.4 billion searches a day equals 189,815 searches per second or 11.4 million searches per minute on google.com.
The average Google user performs 4.2 searches per day. However, the median is much lower at 1.8 searches per day.
This suggests that there are a small number of searchers who are much more active than the average Google user.
| Timeframe | Number of Searches |
| Every day | 4.2 |
| Every week | 29.4 |
| Every month | 126 |
| Every year | 1,533 |
Search data covers searches for the United States, which constitutes the vast majority of Google usage. However, Google has a significant number of country-specific domains that are not included in these statistics.
Here's an example of Google domains and the number of unique monthly visits they received in February 2026, according to Semrush traffic data.
| Google Domain | Country | Unique Monthly Visits |
| google.com | USA | 5.6 billion |
| google.co.uk | UK | 16.1 million |
| google.co.in | India | 22.6 million |
| google.de | Germany | 20.9 million |
| google.co.kr | Rep. of Korea | 6.9 million |
| google.com.br | Brazil | 26.3 million |
| google.co.jp | Japan | 14.6 million |
| google.ca | Canada | 12.8 million |
| google.ru | Russia | 5.5 million |
| google.com.mx | Mexico | 6.7 million |
| google.co.id | Indonesia | 24.1 million |
| google.com.hk | Hong Kong | 18.2 million |
| google.com.pk | Pakistan | 1.6 million |
| google.com.ng | Nigeria | 581.3 thousand |
| google.cn | China | 1.2 million |
China has banned Google, hence the relatively low number of visits.
It's also important to note that Google searches do not necessarily lead to a click on an ad or an organic search result.
According to Datos statistics, 58.5% of searches in the US do not result in the user clicking on a result in the SERP.
In the EU, the percentage of zero-click searches is slightly higher, at 59.7%.
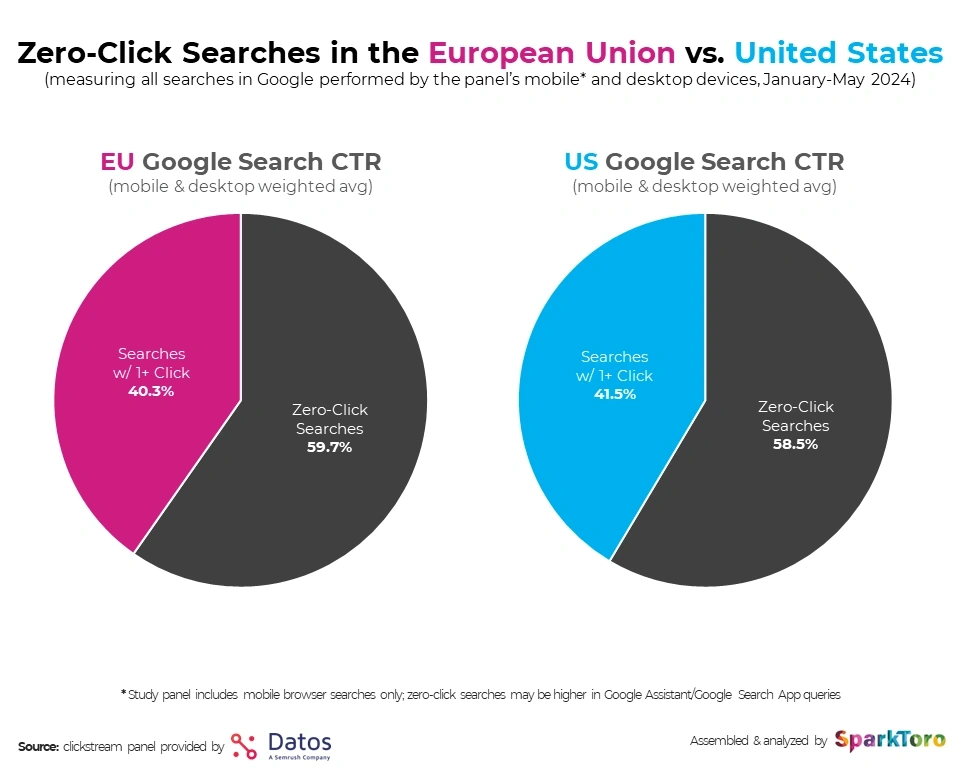
And while AI might not be eating into the number of Google searches just yet, it is certainly fuelling zero-click searches.
Original research by Exploding Topics found that just 7.71% of users will always follow the links provided by AI Overviews. That's despite the fact that only 8.5% of users always trust the information provided in overviews.
These changing dynamics have implications for marketers too. In addition to traditional Google-focused keyword research, AI-first strategies are becoming increasingly important.
Moreover, Google SERPs influence AI visibility. The bilateral relationship between classic SERPs and AI-powered search reinforces the value of strategies that combine both approaches.
See our guide on adapting SEO strategies for LLMs to learn about these strategic shifts.
Number of Google Searches Over Time
In Google’s first year, they processed only 10,000 searches per day. In 2025, Google is projected to handle 13.6 billion searches every day. That equates to almost 5 trillion searches per year.
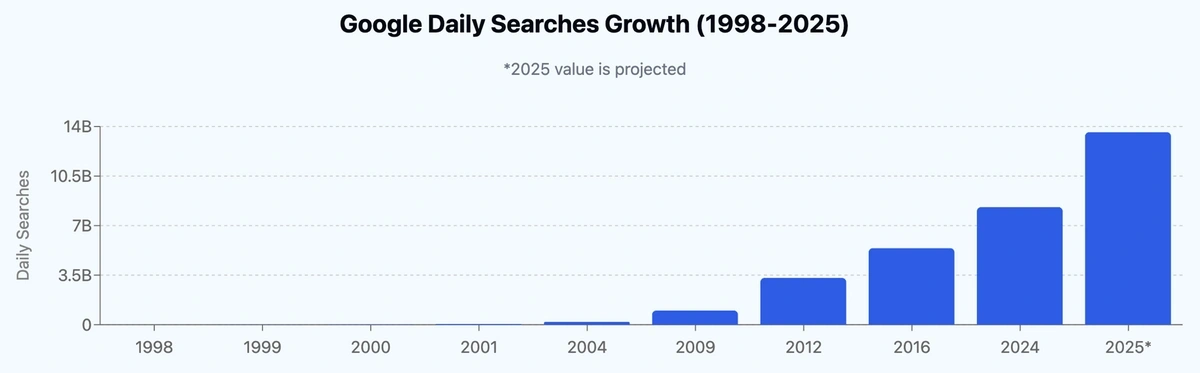
Here's the same data broken down by year, according to available estimates.
| Year | Daily Searches |
| 1998 | 10,000 |
| 1999 | 3,000,000+ |
| 2000 | 18,000,000 |
| 2001 | 55,000,000+ |
| 2004 | 200,000,000 |
| 2009 | 1,000,000,000+ |
| 2012 | 3,300,000,000 |
| 2016 | 5,400,000,000+ |
| 2024 | 8,300,000,000+ |
| 2025 (projected) | 13,600,000,000+ |
In 2024, their global market share was 91.47%. As of July 2025, this had fallen slightly to 89.57%.
With 5.65 billion internet users, that would mean approximately 5.06 billion use Google.
According to Exploding Topics data, Google received 96.5 billion visits in June 2025.
Some countries, such as China, have banned Google for its citizens. With over 1 billion internet users, China’s lack of access is why Google’s estimated user count is lower compared to total internet user estimates.
Other countries, such as Iran (73.14 million internet users) and Syria (6.25 million internet users), have also banned Google.
Want to Spy on Your Competition?
Explore competitors’ website traffic stats, discover growth points, and expand your market share.
Here’s a quick look at Google’s worldwide market share every year since 2015:
| Year | Market Share | Annual Change |
| 2015 | 89.62% | - |
| 2016 | 91.01% | 1.55% |
| 2017 | 92.78% | 1.94% |
| 2018 | 91.74% | -1.12% |
| 2019 | 92.86% | 1.22% |
| 2020 | 92.51% | -0.38% |
| 2021 | 91.86% | -0.70% |
| 2022 | 91.90% | 0.04% |
| 2023 | 92.90% | 1.09% |
| 2024 | 91.47% | -1.43% |
| 2025 | 89.57% | -2.07% |
2025 has seen Google's steepest slide, and its lowest market share in a decade. So while the effects of AI search are not yet overly pronounced, we could be seeing the first signs of an impact on Google's dominance.
That shouldn't be too much of a surprise. Exploding Topics research from August 2025 has found that 84.58% of people are using AI more than they were 12 months ago.
For mobile users, Google is still the preferred search engine. Today, Google owns 93.85% of the mobile search engine market.
Google’s control over the desktop search engine market remains strong but has steadily declined since 2015.
Below is a breakdown of Google’s desktop search engine market share every January since 2015 compared to competitors:
| Year | Google Market Share | Bing Market Share | Yahoo Market Share | Yandex Market Share | Others |
| 2015 | 88.10% | 4.53% | 4.13% | 0.35% | 2.89% |
| 2016 | 88.36% | 4.85% | 3.30% | 0.57% | 2.92% |
| 2017 | 89.06% | 4.59% | 3.08% | 0.58% | 2.66% |
| 2018 | 87.35% | 5.79% | 3.07% | 0.59% | 3.20% |
| 2019 | 89.95% | 3.99% | 2.84% | 0.39% | 2.84% |
| 2020 | 87.35% | 5.53% | 2.83% | 0.42% | 3.89% |
| 2021 | 85.86% | 6.84% | 2.76% | 0.69% | 3.85% |
| 2022 | 85.55% | 7.61% | 2.85% | 1.43% | 2.57% |
| 2023 | 84.69% | 8.85% | 2.59% | 1.31% | 2.56% |
| 2024 | 81.95% | 10.51% | 2.67% | 2.42% | 2.45% |
| 2025 | 79.88% | 11.41% | 3.05% | 2.59% | 3.07% |
| % Change | -9.33% | 151.87% | -26.15% | 640% | 6.22% |
In 2023-2024, Bing Chat was released, and ChatGPT became a mainstream tool for the public.
However, ChatGPT and Perplexity have not made a significant dent in Google usage so far.
Datos reports that, in May 2024:
- Google had more than 290x the number of searches performed in Perplexity
- 99% of people who use LLMs to search continue to use traditional search engines
- Perplexity’s web user base is less than 1% the size of Google's
And a February 2025 study found that while 71.5% of people now use AI tools for search, 79.8% still prefer Google or Bing for general information searches.
Source: Internet Live Stats, Statcounter, Data Reportal, Semrush, Statcounter (2), Search Engine Land, Datos, Search Engine Land (2)
Google Usage By Region
As of July 2025, the United States has the largest Google.com traffic share, at 20.98% of all web traffic.
Japan has the next highest Google traffic, with 6.68%, followed by India (5.59%) and Brazil (4.48%).
This doesn't account for traffic to Google's various country-specific domains.
| Rank | Country | Traffic Share |
| 1 | United States | 20.98% |
| 2 | Japan | 6.68% |
| 3 | India | 5.59% |
| 4 | Brazil | 4.48% |
| 5 | Germany | 3.67% |
While Google is the most used search engine in the world, its dominance and share of search traffic varies by country.
July 2025 data shows that Google is most ubiquitous in Nigeria, where 98.69% of all web traffic referred by search engines comes from Google. Next up is Israel at 98.26% and Hungary at 97.16%.
Although the United States accounts for over a fifth of all Google traffic, the country ranks below the worldwide average when it comes to the level of search dominance Google enjoys.
Here's the top 10:
| Country | Percentage of search traffic driven by Google |
| Nigeria | 98.69% |
| Israel | 98.26% |
| Hungary | 97.94% |
| India | 97.16% |
| Egypt | 96.61% |
| Ghana | 96.59% |
| Saudi Arabia | 96.54% |
| Thailand | 96.12% |
| Kenya | 96.08% |
| Romania | 96.07% |
And here's the data from some other major countries:
| Country | Percentage of search traffic driven by Google |
| Spain | 94.3% |
| South Africa | 93.61% |
| UK | 93.39% |
| Indonesia | 92.98% |
| Australia | 92.33% |
| Brazil | 91.91% |
| Worldwide | 89.57% |
| Canada | 89.53% |
| Mexico | 89.5% |
| France | 87.74% |
| USA | 86.93% |
| Turkey | 60.25% |
| South Korea | 43.02% |
| Russia | 21.72% |
| China | 1.37% |
Source: SimilarWeb, Data Reportal
Google Search User Demographics
Today, around 64% of website traffic comes from people using mobile devices. And much of this traffic comes from Google.
In fact, based on Semrush's latest data, 69.95% of US Google traffic is from mobile devices. Meanwhile, only 30.05% of traffic comes from desktops.
In Japan, the second-largest source of Google.com traffic, 82.92% of all visits come from mobiles.
Get More Search Traffic
Use trending keywords to create content your audience craves.
These figures have remained relatively unchanged in recent months. For further analysis, take a look at our 14-day Semrush Pro free trial here.
While you might expect an even split, Google users are more likely to be male than female. 64.78% of Google traffic is male, while only 35.22% is female. However, the gender split looks very different on some of Google's other country-specific domains.
| Male | Female | |
| Google.com | 64.78% | 35.22% |
| Google.co.uk | 39.57% | 60.43% |
| Google.com.mx | 47.28% | 52.72% |
| Google.com.ng | 62.06% | 37.94% |
| Google.com.pk | 81.54% | 32.17% |
| Google.co.in | 77.11% | 22.89% |
It’s also more likely that someone visiting Google is under the age of 35. In fact, over 55% of Google visitors are 18-34.
Meanwhile, users 55 years and older only represent about 16.13% of Google traffic.
| Age Group | Percentage |
| 18-24 | 27.7% |
| 25-34 | 27.68% |
| 35-44 | 19.01% |
| 45-54 | 12.68% |
| 55-64 | 7.23% |
| 65+ | 4.76% |
Source: Semrush
Types of Google Searches
In a survey conducted by Datos, 44.19% of Google searches were for brands.
When broken down by search intent, the vast majority of Google searches were found to be Informational.
Just 0.69% of queries had transactional intent, meaning the searcher was looking to purchase or sign up for something.
| Search Intent | Volume of Queries |
| Informational | 52.65% |
| Navigational | 32.15% |
| Commercial | 14.51% |
| Transactional | 0.69% |
You can search and sort keywords by search intent using the Semrush Keyword Magic Tool.
Source: SparkToro
Conclusion
Despite the rise of AI and other changes to the search market in recent years, Google is still king.
And AI-driven search has yet to make a truly meaningful impact on Google's market share, although the picture is slowly starting to shift.
If you are interested in learning more about Google search topics, check out these related posts: Top Google Searches and Most Asked Questions On Google.
Stop Guessing, Start Growing 🚀
Use real-time topic data to create content that resonates and brings results.

Exploding Topics is owned by Semrush. Our mission is to provide accurate data and expert insights on emerging trends. Unless otherwise noted, this page’s content was written by either an employee or a paid contractor of Semrush Inc.
Share
Newsletter Signup
By clicking “Subscribe” you agree to Semrush Privacy Policy and consent to Semrush using your contact data for newsletter purposes
Written By


Josh is the Co-Founder and CTO of Exploding Topics. Josh has led Exploding Topics product development from the first line of co... Read more