


Get Advanced Insights on Any Topic
Discover Trends 12+ Months Before Everyone Else
How We Find Trends Before They Take Off
Exploding Topics’ advanced algorithm monitors millions of unstructured data points to spot trends early on.

Keyword Research
Performance Tracking
Competitor Intelligence
Fix Your Site’s SEO Issues in 30 Seconds
Find technical issues blocking search visibility. Get prioritized, actionable fixes in seconds.
Powered by data from
Latest Blog Posts
Featured Case Studies
See what's trending before everyone else
Each week, we'll send you our best Exploding Topics. Plus, expert insight and analysis.
Number of Google Employees (2025)

Since its founding in 1998, Google has grown from a small startup to a global tech company, and the number of employees has expanded dramatically alongside its success.
Today, Google employs thousands of people around the world. But exactly how many work for this search engine giant?
In this report, we dive deeper into the latest Google employee stats, data, and trends.
Top Google Employees Statistics
- Google has 183,323 full-time employees.
- Since 2001, Google has increased its workforce by 183,039 employees, or 64,450%.
- Around 2 out of 3 (65.9%) Google employees are male.
- 91% of Google’s total workforce is White or Asian.
How Many People Work At Google?
According to the latest available data, there are 183,323 total full-time Alphabet (Google) employees.
Despite being one of the world's most valuable companies, Google is not ranked in the top 100 in terms of total employees.
Source: Stock Analysis, Statista
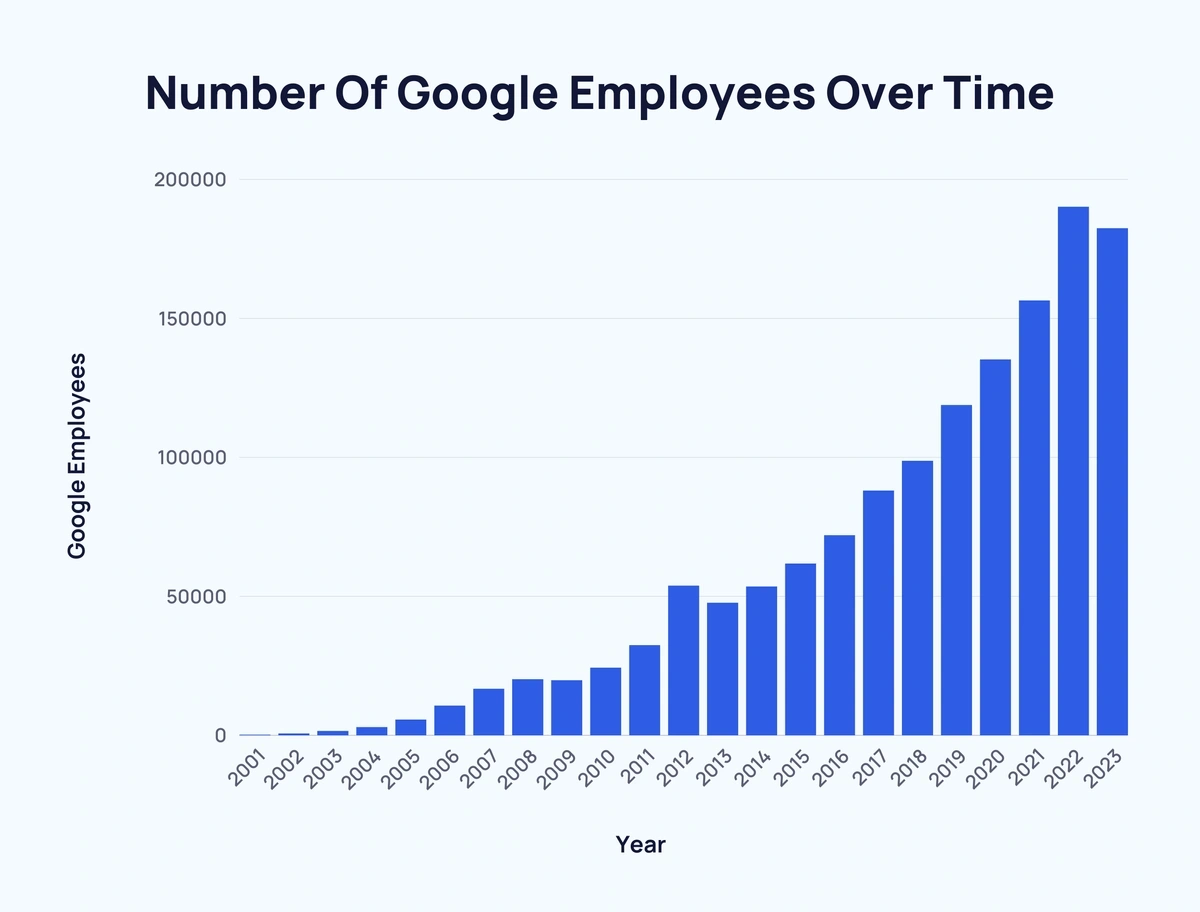
Number Of Google Employees Over Time
Between 2001 and 2010, the number of Google employees increased by approximately 24,200, from 284 to 24,400.
However, this figure exploded over the next ten years. From 2010 to 2020, Google added an additional 110,900 employees.
Since Google was founded in 1998, the company’s employee headcount has only experienced three yearly declines in 25 years.
Since 2001, the number of Google employees has increased by over 183,000, or 64,450%.
Here’s a more detailed breakdown of the number of Google employees over time:
| Year | Google Employees | YoY Change | YoY Change (%) |
| 2001 | 284 | - | - |
| 2002 | 682 | 398 | 140.1% |
| 2003 | 1,628 | 946 | 138.7% |
| 2004 | 3,021 | 1,393 | 85.6% |
| 2005 | 5,680 | 2,659 | 88.0% |
| 2006 | 10,700 | 5,020 | 88.4% |
| 2007 | 16,805 | 6,105 | 57.1% |
| 2008 | 20,222 | 3,417 | 20.3% |
| 2009 | 19,835 | -387 | -1.9% |
| 2010 | 24,400 | 4,565 | 23.0% |
| 2011 | 32,467 | 8,067 | 33.1% |
| 2012 | 53,861 | 21,394 | 65.9% |
| 2013 | 47,756 | -6,105 | -11.3% |
| 2014 | 53,600 | 5,844 | 12.2% |
| 2015 | 61,814 | 8,214 | 15.3% |
| 2016 | 72,053 | 10,239 | 16.6% |
| 2017 | 88,110 | 16,057 | 22.3% |
| 2018 | 98,771 | 10,661 | 12.1% |
| 2019 | 118,899 | 20,128 | 20.4% |
| 2020 | 135,301 | 16,402 | 13.8% |
| 2021 | 156,500 | 21,199 | 15.7% |
| 2022 | 190,234 | 33,734 | 21.6% |
| 2023 | 182,502 | -7,732 | -4.1% |
| 2024 | 183,323 | 821 | 0.45% |
Similar to Google's total employees, the company's website traffic has grown over time.
in 2024, Google's total traffic hit XYZ visits. Here's a look at Google's yearly traffic over since 2019:
| Year | Total Visits | YoY Change (%) |
| 2019 | 852.4 billion | - |
| 2020 | 941.4 billion | 10.44% |
| 2021 | 1.5 trillion | 59.35% |
| 2022 | 1.1 trillion | -26.67% |
| 2023 | 1.2 trillion | 9.09% |
| 2024 | 1.3 trillion | 8.33% |
You can look up traffic data for any website using our Free Website Checker tool.
Source: Stock Analysis, Statista, Semrush
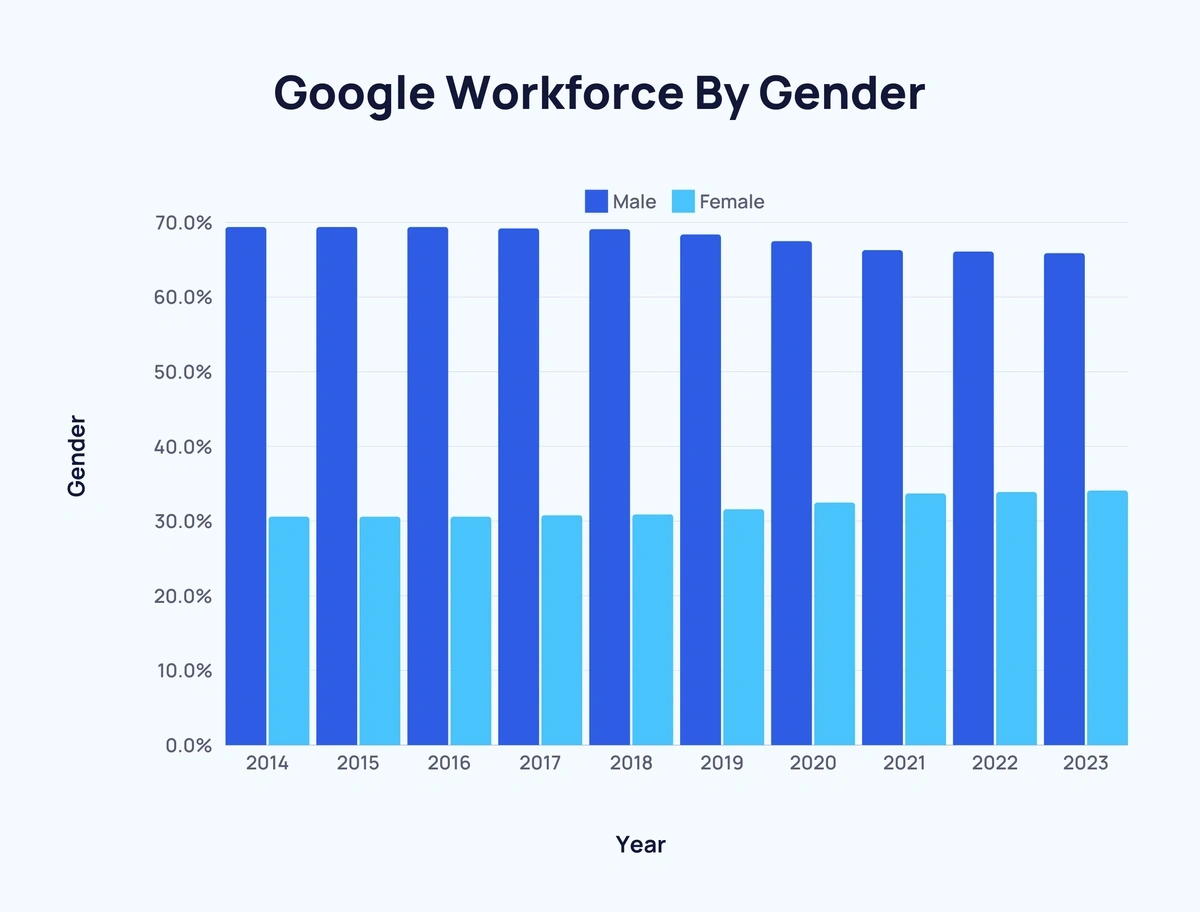
Google Workforce By Gender
For every woman who works for Google, there are approximately 2 men employed.
However, Google’s female workforce has grown steadily over the last ten years. Based on the latest 2023 data, 65.9% of Google’s workforce is male, while 34.1% is female.
Want to Spy on Your Competition?
Explore competitors’ website traffic stats, discover growth points, and expand your market share.
In 2014, the figure was much lower. Males accounted for 69.4% of the company’s workforce, while females made up 30.6%.
Below, you can find more details on Google's workforce by gender over time:
| Year | Male | Change Over Year | Female | Change Over Year |
| 2014 | 69.4% | - | 30.6% | - |
| 2015 | 69.4% | 0.0% | 30.6% | 0.0% |
| 2016 | 69.4% | 0.0% | 30.6% | 0.0% |
| 2017 | 69.2% | -0.2% | 30.8% | 0.2% |
| 2018 | 69.1% | -0.1% | 30.9% | 0.1% |
| 2019 | 68.4% | -0.7% | 31.6% | 0.7% |
| 2020 | 67.5% | -0.9% | 32.5% | 0.9% |
| 2021 | 66.3% | -1.2% | 33.7% | 1.2% |
| 2022 | 66.1% | -0.2% | 33.9% | 0.2% |
| 2023 | 65.9% | -0.2% | 34.1% | 0.2% |
Source: Statista
Google Workforce By Ethnicity
According to Google's latest available data, the largest % of Google employees are white at 46.2%.
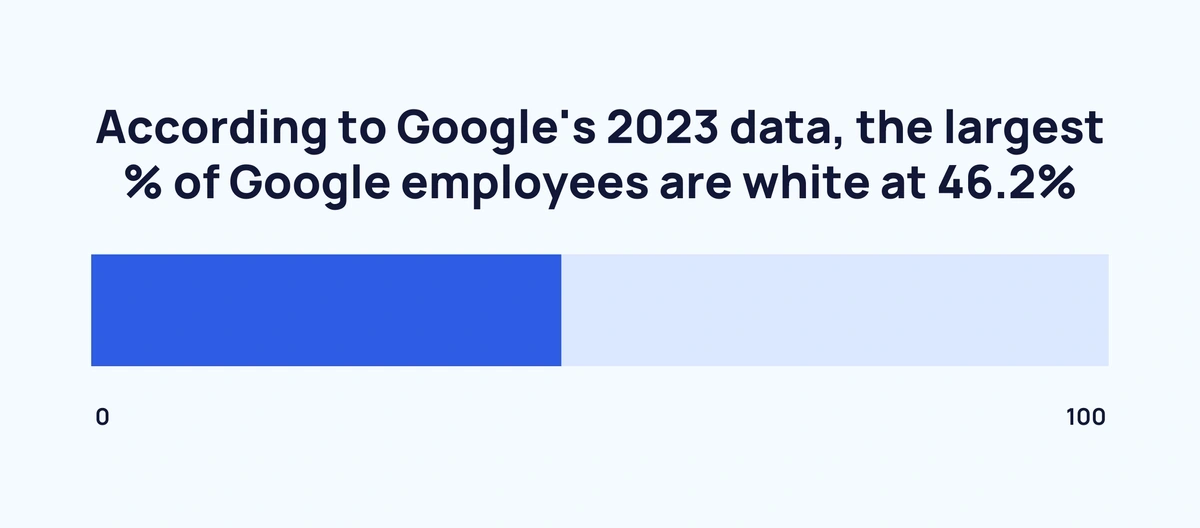
Asian Google employees make up 44.8% of the company's workforce, while Hispanic/Latino account for 7.3%.
Below, we take a closer look at how Google's employees by ethnicity have changed since 2017:
| Ethnicity | 2017 | 2018 | 2019 | 2020 | 2021 | 2022 | 2023 |
| Asian | 36.30% | 38.10% | 39.80% | 41.90% | 42.30% | 43.20% | 44.80% |
| African American | 2.80% | 3% | 3.30% | 3.70% | 4.40% | 5.30% | 5.60% |
| Latino | 5.30% | 5.30% | 5.70% | 5.90% | 6.40% | 6.90% | 7.30% |
| Native American | 0.80% | 0.30% | 0.80% | 0.80% | 0.80% | 0.80% | 0.80% |
| White | 58.50% | 56.60% | 54.40% | 51.70% | 50.40% | 48.30% | 46.20% |
And here’s a breakdown of Google’s workforce by ethnicity and department according to the latest available data.
| Ethnicity | Tech | Non-tech | Leadership |
| Asian | 50.90% | 25.80% | 32.30% |
| African American | 4.10% | 10.60% | 5.20% |
| Hispanic/Latino | 6.20% | 10.80% | 4.30% |
| Native American | 0.70% | 1.40% | 0.80% |
| White | 42.20% | 58.20% | 60.30% |
Google Workforce by Role
The distribution of gender and ethnicity at Google varies depending on an individual's job role and department.
Build a winning strategy
Get a complete view of your competitors to anticipate trends and lead your market
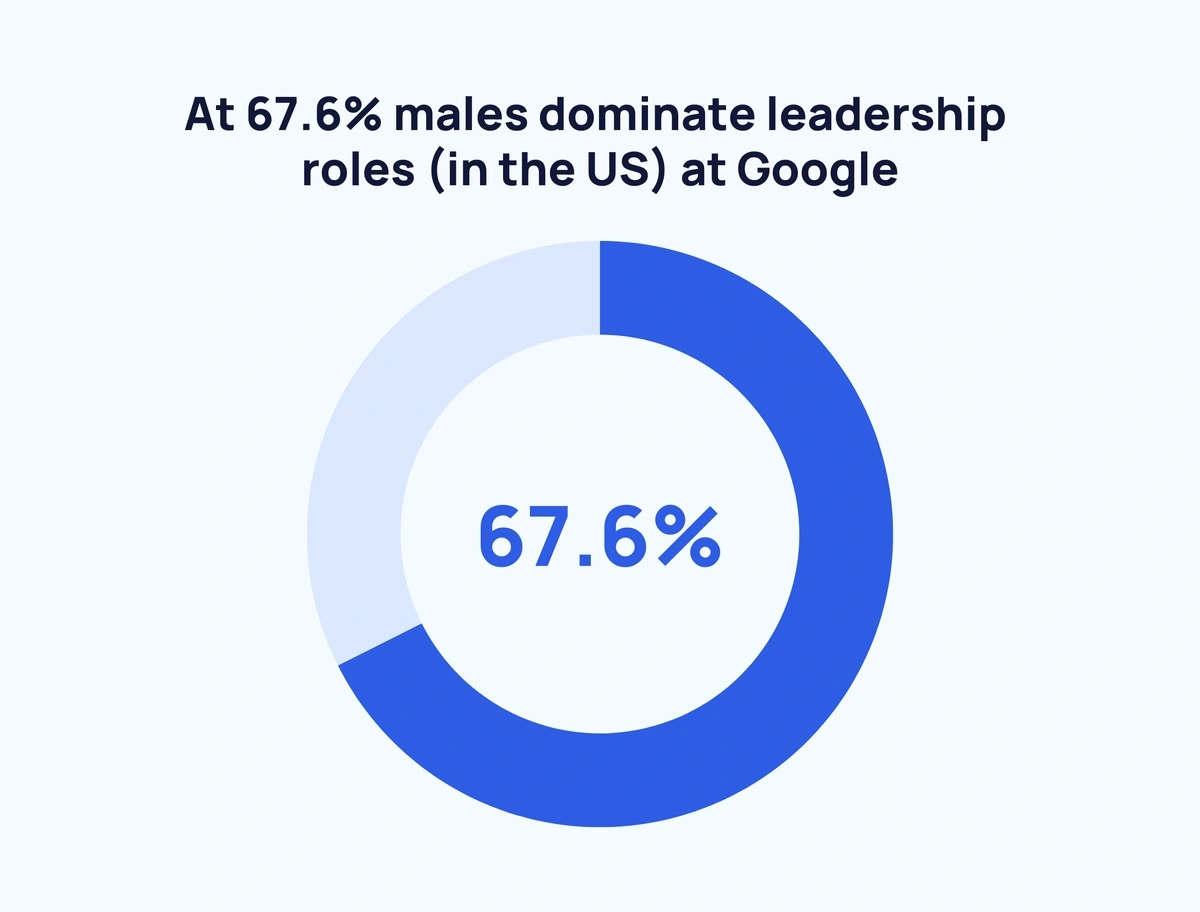
For example, males (67.6%) dominate leadership roles (in the US) at Google. And approximately 59.6% of Google employees in leadership roles are White.
Below, we list Google's overall workforce representation data by ethnicity and gender since 2017:
| 2017 | 2018 | 2019 | 2020 | 2021 | 2022 | 2023 | 2024 | |
| Male (US) | 70.50% | 70.20% | 69.00% | 68.40% | 67.80% | 66.50% | 66.10% | 66.20% |
| Female (US) | 29.50% | 29.80% | 31.00% | 31.60% | 32.20% | 33.50% | 33.90% | 33.80% |
| Male (Global) | 69.20% | 69.10% | 68.40% | 68.00% | 67.50% | 66.10% | 65.90% | 65.90% |
| Female (Global) | 30.80% | 30.90% | 31.60% | 32.00% | 32.50% | 33.90% | 34.10% | 34.10% |
| White | 58.50% | 56.60% | 54.40% | 51.70% | 50.40% | 48.30% | 46.20% | 45.30% |
| Asian | 36.30% | 38.10% | 39.80% | 41.90% | 42.30% | 43.20% | 44.80% | 45.70% |
| African American | 2.80% | 3.00% | 3.30% | 3.70% | 4.40% | 5.30% | 5.60% | 5.70% |
| Latino | 5.30% | 5.30% | 5.70% | 5.90% | 6.40% | 6.90% | 7.30% | 7.50% |
| Native American | 0.80% | 0.80% | 0.80% | 0.80% | 0.80% | 0.80% | 0.80% | 0.90% |
And here’s how Google’s workforce has changed by department between 2017 and 2024:
Tech
| 2017 | 2018 | 2019 | 2020 | 2021 | 2022 | 2023 | 2024 | |
| Male (US) | 79.40% | 78.30% | 76.90% | 76.00% | 75.20% | 73.90% | 73.40% | 72.80% |
| Female (US) | 20.60% | 21.70% | 23.10% | 24.00% | 24.80% | 26.10% | 26.70% | 27.20% |
| Male (Global) | 80.20% | 79.20% | 77.90% | 77.10% | 76.30% | 75.10% | 74.70% | 74.10% |
| Female (Global) | 19.80% | 20.80% | 22.10% | 23.00% | 23.70% | 24.90% | 25.30% | 25.90% |
| White | 55.90% | 53.50% | 51.10% | 48.20% | 46.80% | 44.50% | 42.40% | 41.50% |
| Asian | 40.90% | 42.90% | 45.00% | 47.30% | 47.90% | 49.20% | 50.90% | 51.40% |
| African American | 1.80% | 2.00% | 2.20% | 2.50% | 3.10% | 3.70% | 4.10% | 4.20% |
| Latino | 4.20% | 4.40% | 4.70% | 4.80% | 5.40% | 5.90% | 6.20% | 6.50% |
| Native American | 0.60% | 0.60% | 0.60% | 0.60% | 0.60% | 0.60% | 0.70% | 0.70% |
Non-Tech
| 2017 | 2018 | 2019 | 2020 | 2021 | 2022 | 2023 | 2024 | |
| Male (US) | 47.50% | 47.50% | 45.90% | 45.20% | 45.60% | 44.40% | 43.70% | 43.70% |
| Female (US) | 52.50% | 52.50% | 54.10% | 54.80% | 54.40% | 55.60% | 56.30% | 56.30% |
| Male (Global) | 50.60% | 50.10% | 49.00% | 48.60% | 48.90% | 47.60% | 46.90% | 46.90% |
| Female (Global) | 49.50% | 49.90% | 51.00% | 51.40% | 51.10% | 52.50% | 53.10% | 53.20% |
| White | 65.50% | 65.00% | 63.70% | 62.30% | 61.30% | 59.50% | 58.20% | 58.00% |
| Asian | 24.70% | 24.60% | 24.90% | 25.60% | 25.50% | 25.60% | 25.80% | 26.10% |
| African American | 5.60% | 5.90% | 6.60% | 7.30% | 8.50% | 10.00% | 10.60% | 10.60% |
| Latino | 8.20% | 8.50% | 9.10% | 9.40% | 9.60% | 10.10% | 10.80% | 10.90% |
| Native American | 1.30% | 1.30% | 1.50% | 1.40% | 1.30% | 1.30% | 1.40% | 1.30% |
Leadership
| 2017 | 2018 | 2019 | 2020 | 2021 | 2022 | 2023 | 2024 | |
| Male (US) | 75.80% | 74.70% | 73.60% | 73.10% | 71.90% | 69.50% | 67.80% | 67.60% |
| Female (US) | 24.20% | 25.30% | 26.40% | 26.90% | 28.10% | 30.50% | 32.20% | 32.40% |
| Male (Global) | 75.50% | 74.50% | 73.90% | 73.30% | 71.90% | 69.40% | 67.80% | 67.20% |
| Female (Global) | 24.50% | 25.50% | 26.10% | 26.70% | 28.10% | 30.60% | 32.20% | 32.80% |
| White | 69.60% | 68.90% | 66.60% | 65.90% | 65.50% | 62.00% | 60.30% | 59.60% |
| Asian | 27.10% | 27.30% | 28.90% | 29.60% | 29.40% | 31.20% | 32.30% | 33.30% |
| African American | 2.00% | 2.40% | 2.60% | 2.60% | 3.00% | 4.70% | 5.20% | 5.10% |
| Latino | 2.40% | 2.70% | 3.30% | 3.70% | 3.90% | 4.10% | 4.30% | 4.30% |
| Native American | 0.80% | 0.80% | 0.70% | 0.50% | 0.60% | 0.70% | 0.80% | 0.80% |
Source: Google
Conclusion
Despite a recent drop in Google's employee numbers, past trends point to a growing workforce at one of the world's largest and most valuable companies. It's still also the most visited website in the world.
To learn about more statistics on related topics, take a look at our Number of Amazon Employees and Number of Nvidia Employees posts.
Stop Guessing, Start Growing 🚀
Use real-time topic data to create content that resonates and brings results.

Exploding Topics is owned by Semrush. Our mission is to provide accurate data and expert insights on emerging trends. Unless otherwise noted, this page’s content was written by either an employee or a paid contractor of Semrush Inc.
Share
Newsletter Signup
By clicking “Subscribe” you agree to Semrush Privacy Policy and consent to Semrush using your contact data for newsletter purposes
Written By


Josh is the Co-Founder and CTO of Exploding Topics. Josh has led Exploding Topics product development from the first line of co... Read more