Get Advanced Insights on Any Topic
Discover Trends 12+ Months Before Everyone Else
How We Find Trends Before They Take Off
Exploding Topics’ advanced algorithm monitors millions of unstructured data points to spot trends early on.

Features
Keyword Research
Performance Tracking
Competitor Intelligence
Fix Your Site’s SEO Issues in 30 Seconds
Find technical issues blocking search visibility. Get prioritized, actionable fixes in seconds.
Powered by data from
Number of Nvidia Employees (2024)
Since being established in 1993, Nvidia’s workforce has grown significantly.
And today, thousands of people across the globe are employed by the multinational corporation.
Below, we’ll dive into the latest Nvidia employee stats and data:
Contents
- Top Nvidia Employees Statistics
- How Many Nvidia Employees Are There?
- Number Of Nvidia Employees Over Time
- Nvidia Workforce By Gender
- Nvidia Workforce By Ethnicity
- Nvidia Workforce By Region
Top Nvidia Employees Statistics
- Nvidia employs around 30 thousand people
- Since 1996, Nvidia’s workforce has expanded by over 700x
- Around 4 in 5 Nvidia employees are male
- Approximately half of Nvidia employees are Asian/Indian
- About 50% of Nvidia’s workforce is based in the Americas
How Many Nvidia Employees Are There?
According to the latest available data, there are 29,600 total Nvidia employees.
Source: Stock Analysis
Number of Nvidia Employees Over Time
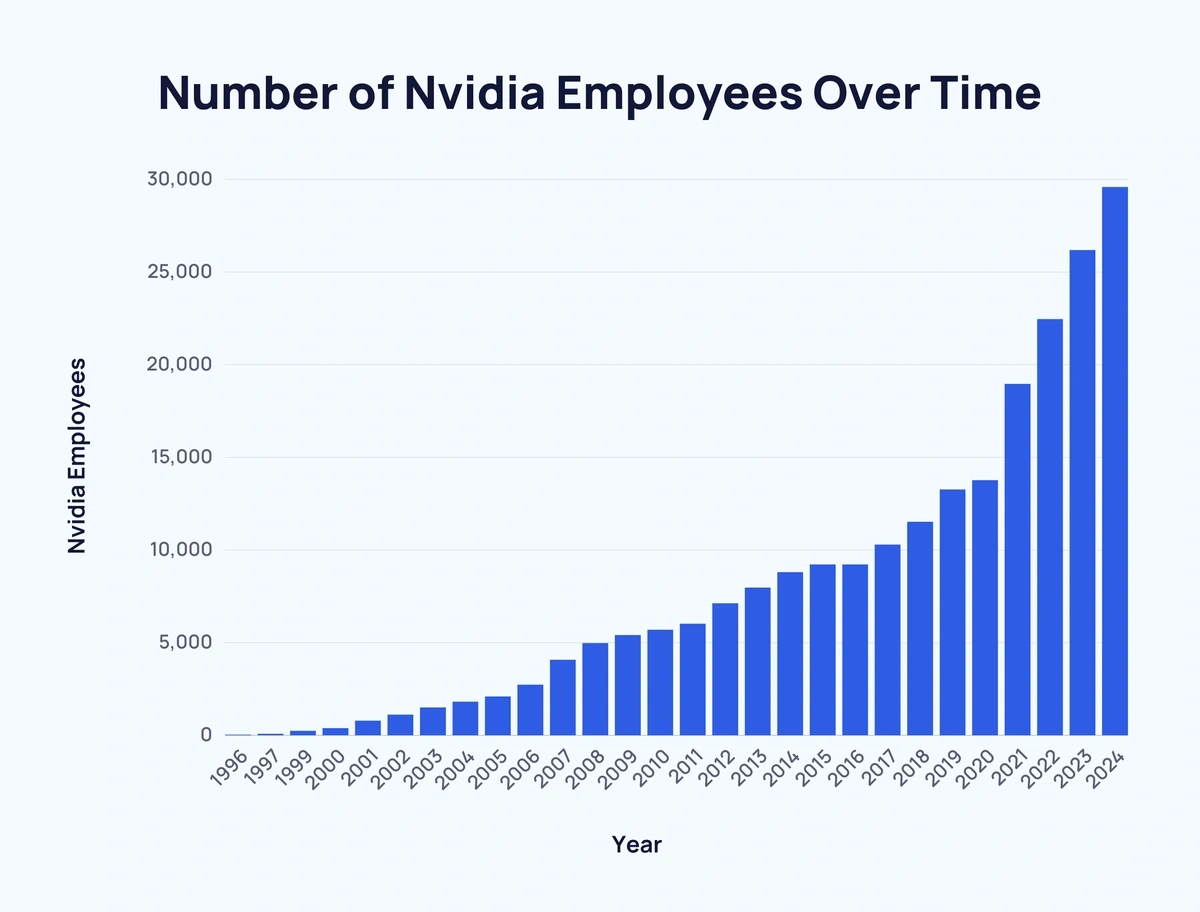
Between 2005 and 2015, the number of Nvidia employees increased by around 7,000.
However, between 2015 and 2024, Nvidia employees grew by over 20,000.
In fact, the number of Nvidia employees has only dropped once (by 1) since 1996.
Since 1996, the number of Nvidia employees has increased by over 700x.
Here’s a breakdown of the number of employees that work at Nvidia over time:
| Year | Nvidia Employees | Change Over Previous Year | Change Over Previous Year (%) |
| 1996 | 42 | - | - |
| 1997 | 92 | ↑ 50 | ↑ 119.05% |
| 1999 | 248 | ↑ 156 | ↑ 169.57% |
| 2000 | 392 | ↑ 144 | ↑ 58.06% |
| 2001 | 796 | ↑ 404 | ↑ 103.06% |
| 2002 | 1,123 | ↑ 327 | ↑ 41.08% |
| 2003 | 1,513 | ↑ 390 | ↑ 34.73% |
| 2004 | 1,825 | ↑ 312 | ↑ 20.62% |
| 2005 | 2,101 | ↑ 276 | ↑ 15.12% |
| 2006 | 2,737 | ↑ 636 | ↑ 30.27% |
| 2007 | 4,083 | ↑ 1,346 | ↑ 49.18% |
| 2008 | 4,985 | ↑ 902 | ↑ 22.09% |
| 2009 | 5,420 | ↑ 435 | ↑ 8.73% |
| 2010 | 5,706 | ↑ 286 | ↑ 5.28% |
| 2011 | 6,029 | ↑ 323 | ↑ 5.66% |
| 2012 | 7,133 | ↑ 1,104 | ↑ 18.31% |
| 2013 | 7,974 | ↑ 841 | ↑ 11.79% |
| 2014 | 8,808 | ↑ 834 | ↑ 10.46% |
| 2015 | 9,228 | ↑ 420 | ↑ 4.77% |
| 2016 | 9,227 | ↓ 1 | ↓ 0.01% |
| 2017 | 10,299 | ↑ 1,072 | ↑ 11.62% |
| 2018 | 11,528 | ↑ 1,229 | ↑ 11.93% |
| 2019 | 13,277 | ↑ 1,749 | ↑ 15.17% |
| 2020 | 13,775 | ↑ 498 | ↑ 3.75% |
| 2021 | 18,975 | ↑ 5,200 | ↑ 37.75% |
| 2022 | 22,473 | ↑ 3,498 | ↑ 18.43% |
| 2023 | 26,196 | ↑ 3,723 | ↑ 16.57% |
| 2024 | 29,600 | ↑ 3,404 | ↑ 12.99% |
Source: Stock Analysis
Nvidia Workforce by Gender
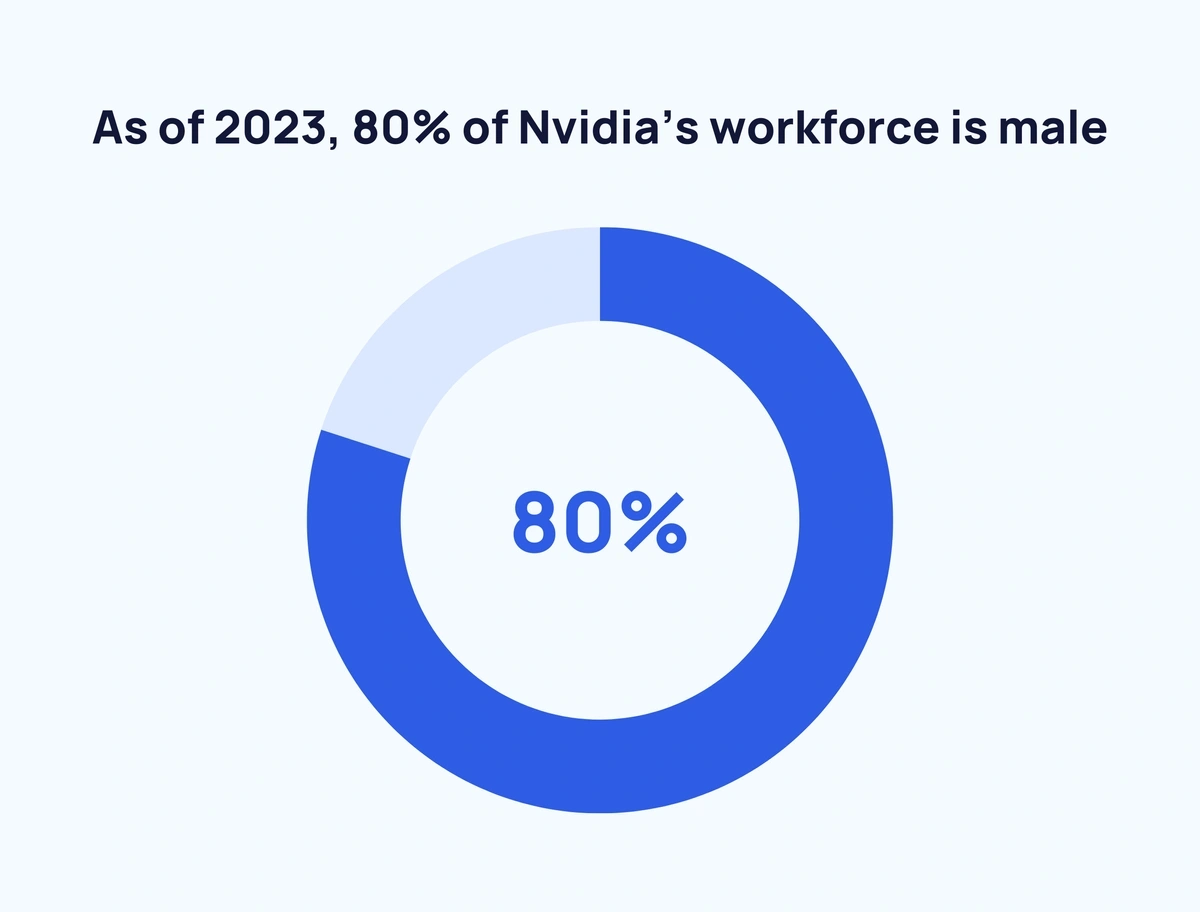
For every woman who works for Nvidia, there are 4 men employed.
As of 2023, 80% of Nvidia’s workforce is male, while 19.2% is female. And 0.8% did not declare.
Here’s a closer look at the Nvidia workforce by gender over time:
| Year | Male | Change Over Year | Female | Change Over Year |
| 2020 | 80.5% | - | 18.9% | - |
| 2021 | 80.3% | ↓ 0.2% | 19.1% | ↑ 0.2% |
| 2022 | 80.4% | ↑ 0.1% | 19% | ↓0.1% |
| 2023 | 80% | ↓ 0.4% | 19.2% | ↑ 0.2% |
Source: Nvidia
Nvidia Workforce by Ethnicity
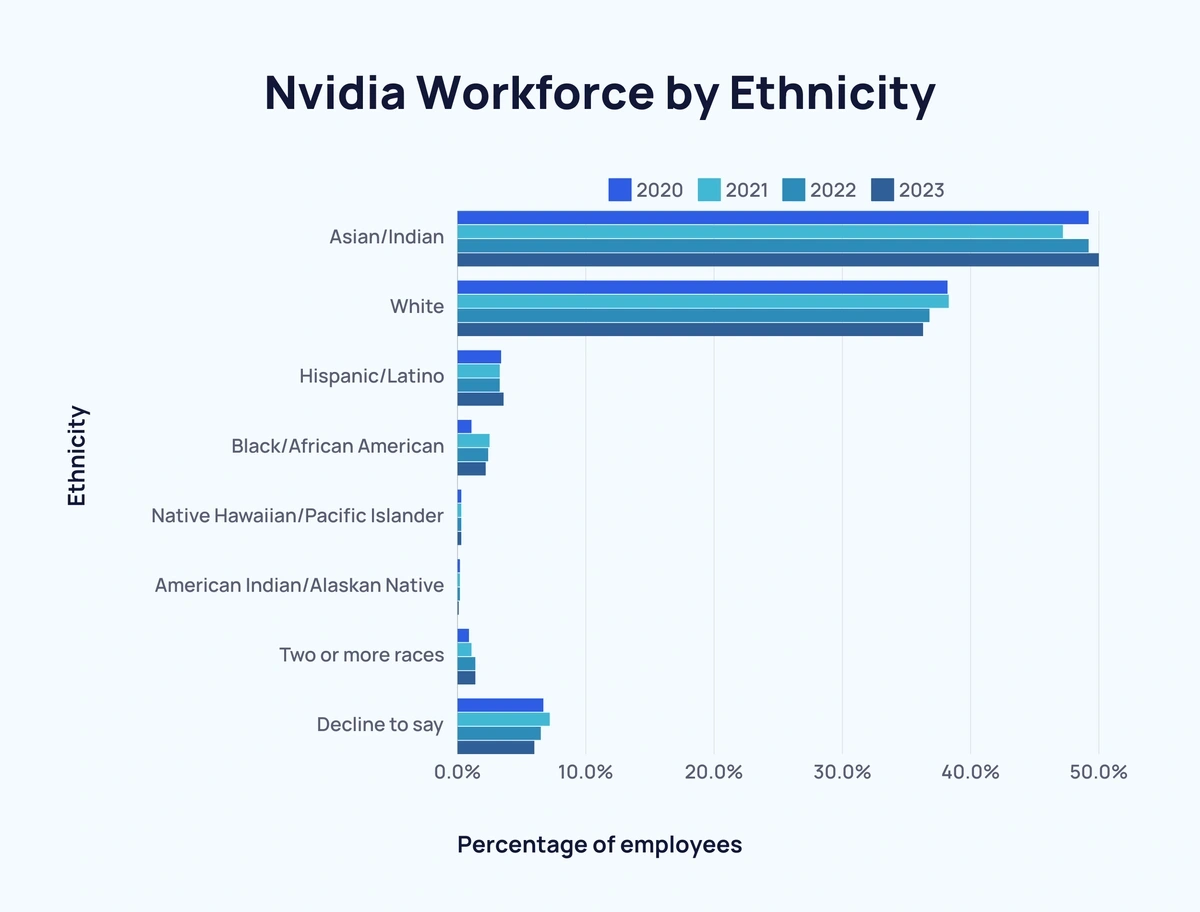
According to Nvidia, approximately 1 in 2 (50%) Nvidia employees are Asian/Indian.
White Nvidia employers make up 36.3% and 3.6% are Hispanic/Latino.
Here’s a closer look at Nvidia employees by ethnicity over time:
| Ethnicity | 2020 | 2021 | 2022 | 2023 |
| Asian/Indian | 49.2% | 47.2% | 49.2% | 50% |
| White | 38.2% | 38.3% | 36.8% | 36.3% |
| Hispanic/Latino | 3.4% | 3.3% | 3.3% | 3.6% |
| Black/African American | 1.1% | 2.5% | 2.4% | 2.2% |
| Native Hawaiian/Pacific Islander | 0.3% | 0.3% | 0.3% | 0.3% |
| American Indian/Alaskan Native | 0.2% | 0.2% | 0.2% | 0.1% |
| Two or more races | 0.9% | 1.1% | 1.4% | 1.4% |
| Decline to say | 6.7% | 7.2% | 6.5% | 6% |
And here’s how the makeup of Nvidia’s workforce has changed between 2020 and 2023:
| Ethnicity | Change |
| Asian/Indian | ↑ 0.8% |
| White | ↓ 1.9% |
| Hispanic/Latino | ↑ 0.2% |
| Black/African American | ↑ 1.1% |
| Native Hawaiian/Pacific Islander | - |
| American Indian/Alaskan Native | ↓ 0.1% |
| Two or more races | ↑ 0.5% |
| Decline to say | ↓ 0.7% |
Source: Nvidia
Nvidia Workforce by Region
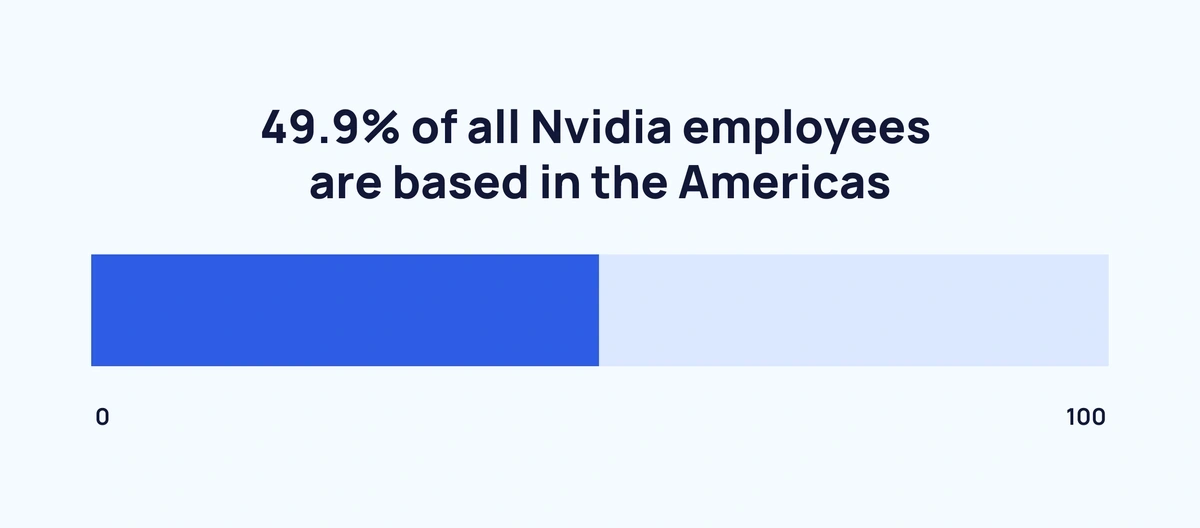
Around half (49.9%) of all Nvidia employees are based in the Americas.
Europe, the Middle East, and Africa combined make up over 19% of all Nvidia employees.
India alone contributes just under 15% of Nvidia employees.
Here’s a breakdown of Nvidia employees by region:
| Region | Nvidia Employees | Proportion of Nvidia Employees |
| Americas | 12,979 | 49.9% |
| EMEA | 4,999 | 19.2% |
| APAC | 4,361 | 16.8% |
| India | 3,693 | 14.2% |
Source: Nvidia
Conclusion
Looking at the data, the size of Nvidia’s workforce is set to continue to grow each year.
For more statistics on similar topics, take a look at Number of Amazon Employees and Workplace Trends to Watch.
Stop Guessing, Start Growing 🚀
Use real-time topic data to create content that resonates and brings results.
Exploding Topics is owned by Semrush. Our mission is to provide accurate data and expert insights on emerging trends. Unless otherwise noted, this page’s content was written by either an employee or a paid contractor of Semrush Inc.
Share
Newsletter Signup
By clicking “Subscribe” you agree to Semrush Privacy Policy and consent to Semrush using your contact data for newsletter purposes
Written By


Fabio is a research associate at Exploding Topics. Since 2021, Fabio has researched, written, and edited articles for the Explo... Read more


