


Get Advanced Insights on Any Topic
Discover Trends 12+ Months Before Everyone Else
How We Find Trends Before They Take Off
Exploding Topics’ advanced algorithm monitors millions of unstructured data points to spot trends early on.

Keyword Research
Performance Tracking
Competitor Intelligence
Fix Your Site’s SEO Issues in 30 Seconds
Find technical issues blocking search visibility. Get prioritized, actionable fixes in seconds.
Powered by data from
Latest Blog Posts
Featured Case Studies
See what's trending before everyone else
Each week, we'll send you our best Exploding Topics. Plus, expert insight and analysis.
How to Identify Market Trends: 6 Effective Strategies

Most people identify trends by reading industry publications, talking to other professionals, and following influencers on social media.
However, there a handful of untapped ways to find trends before they take off.
In this guide we'll cover 6 actionable ways to identify trends early on.
1. Use a Trend Discovery Tool
One of the easiest ways to identify market trends is to use a trend discovery tool that tracks under-the-radar trends in your industry.
We built Exploding Topics specifically for this use case.
The flagship product is the Trends Database that you can filter by category (health, beauty, travel, pets, marketing, finance, etc.) and growth status (exploding, regular, and peaked) to find thousands of under-the-radar trends.
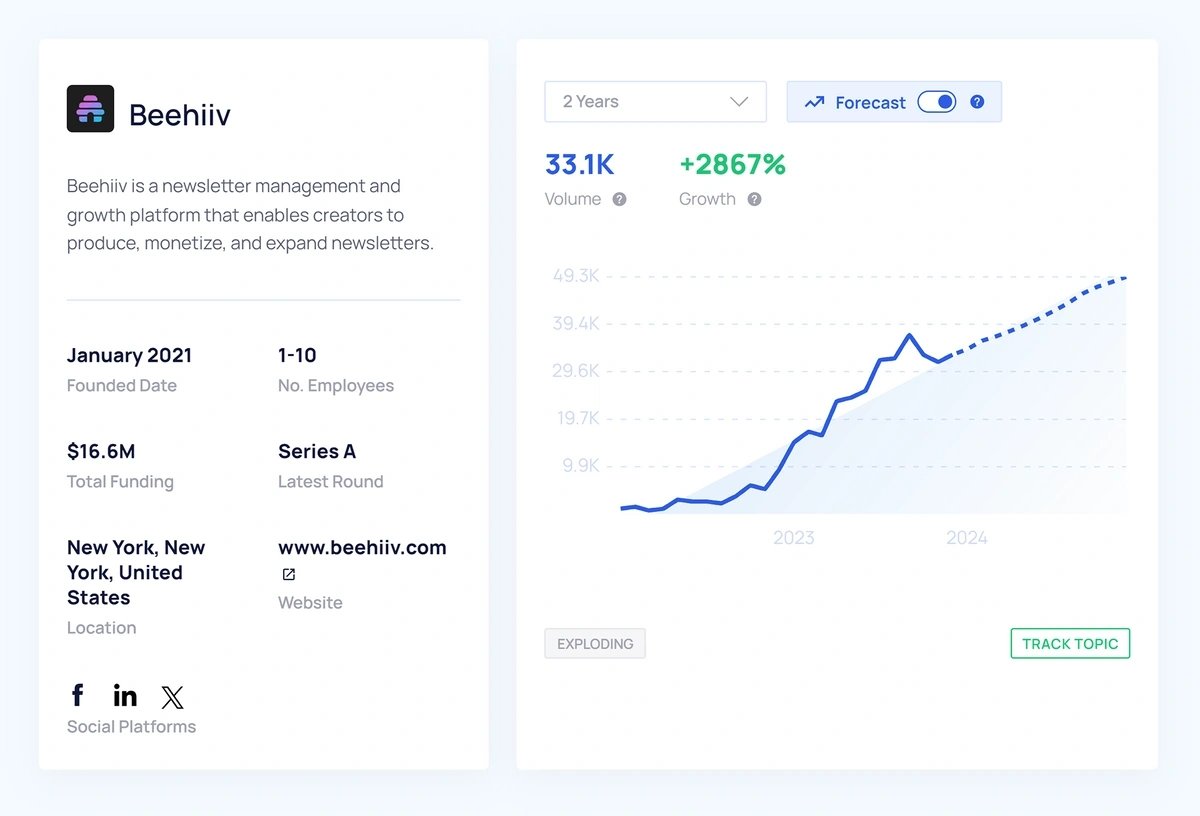
Each trend is a product, brand, or industry term, and you'll see a graph of that keyword's search volume trend over time to gauge consumer interest and future growth potential.
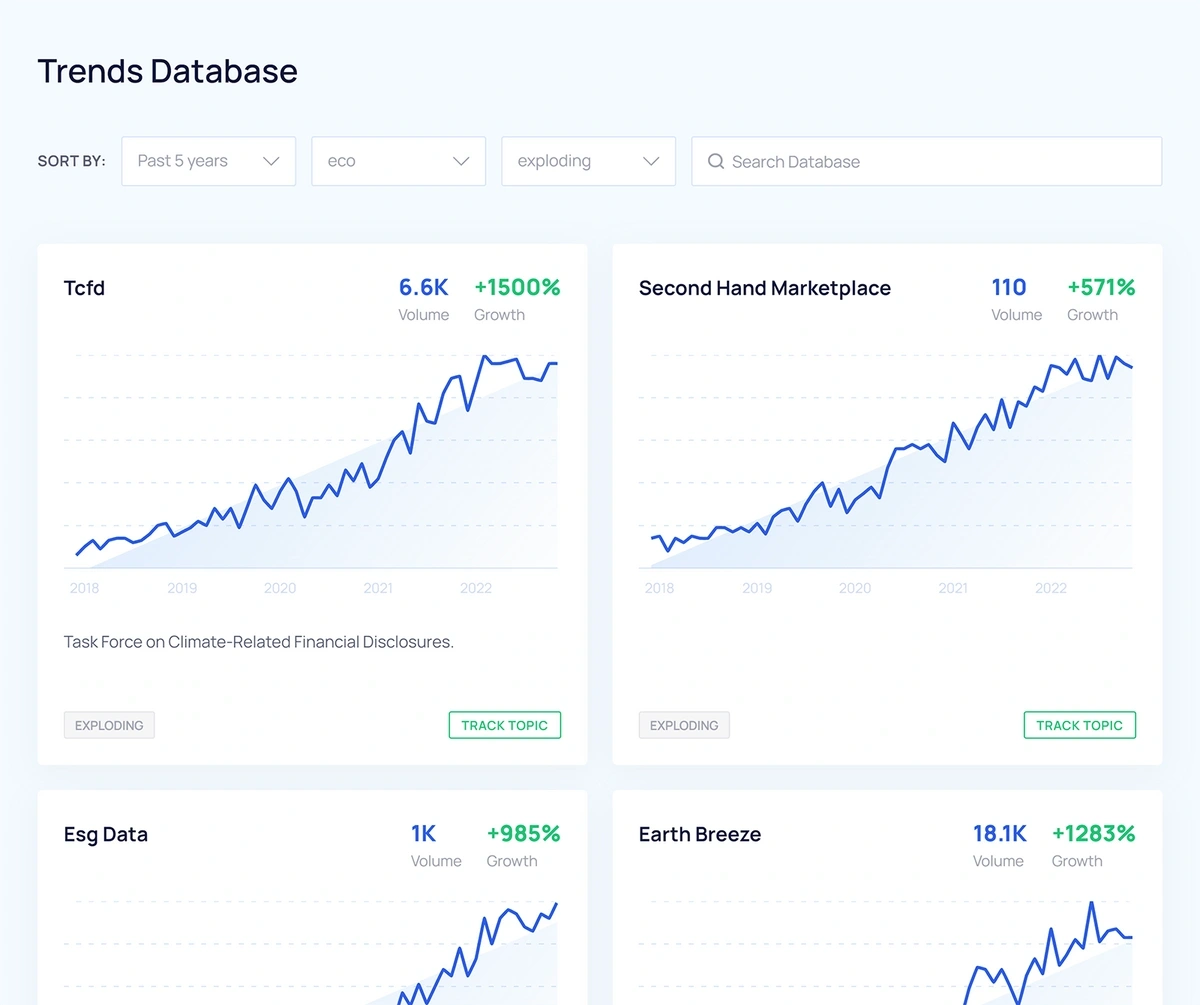
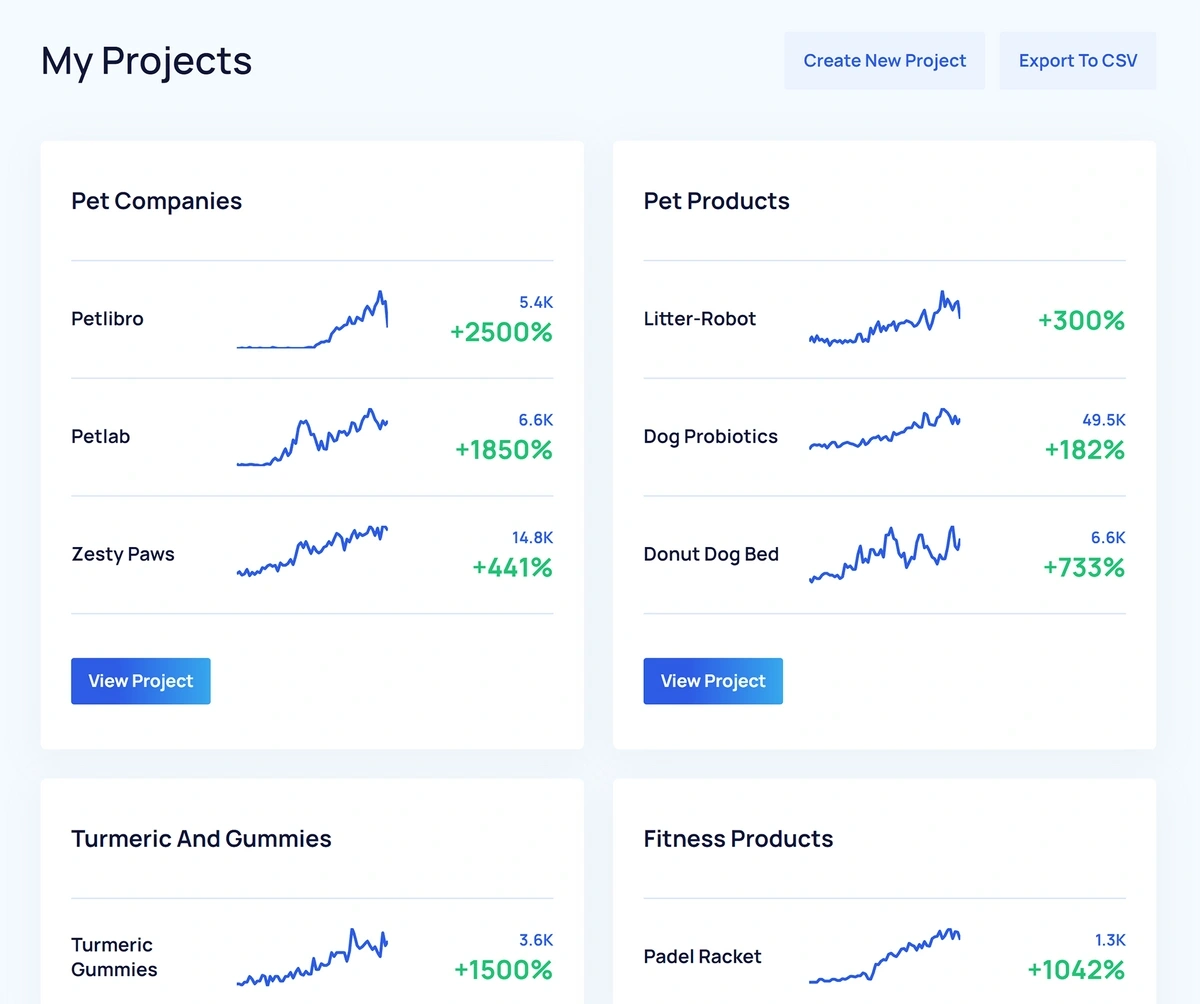
When you find an interesting trend, click "Track Topic" and add it to a Project.
Projects are personalized folders you can create to save and track trends over time. You can name Projects anything you like (e.g., "Exploding Pet Brands," "Peaked Travel Companies"), and they live inside the Exploding Topics dashboard so that you can easily monitor trends at a glance.
A key differentiator that sets Exploding Topics apart from most other trend discovery tools is the massive amounts of data we use to qualify trends

The Trends Database is excellent for discovering new trends you've never heard of.
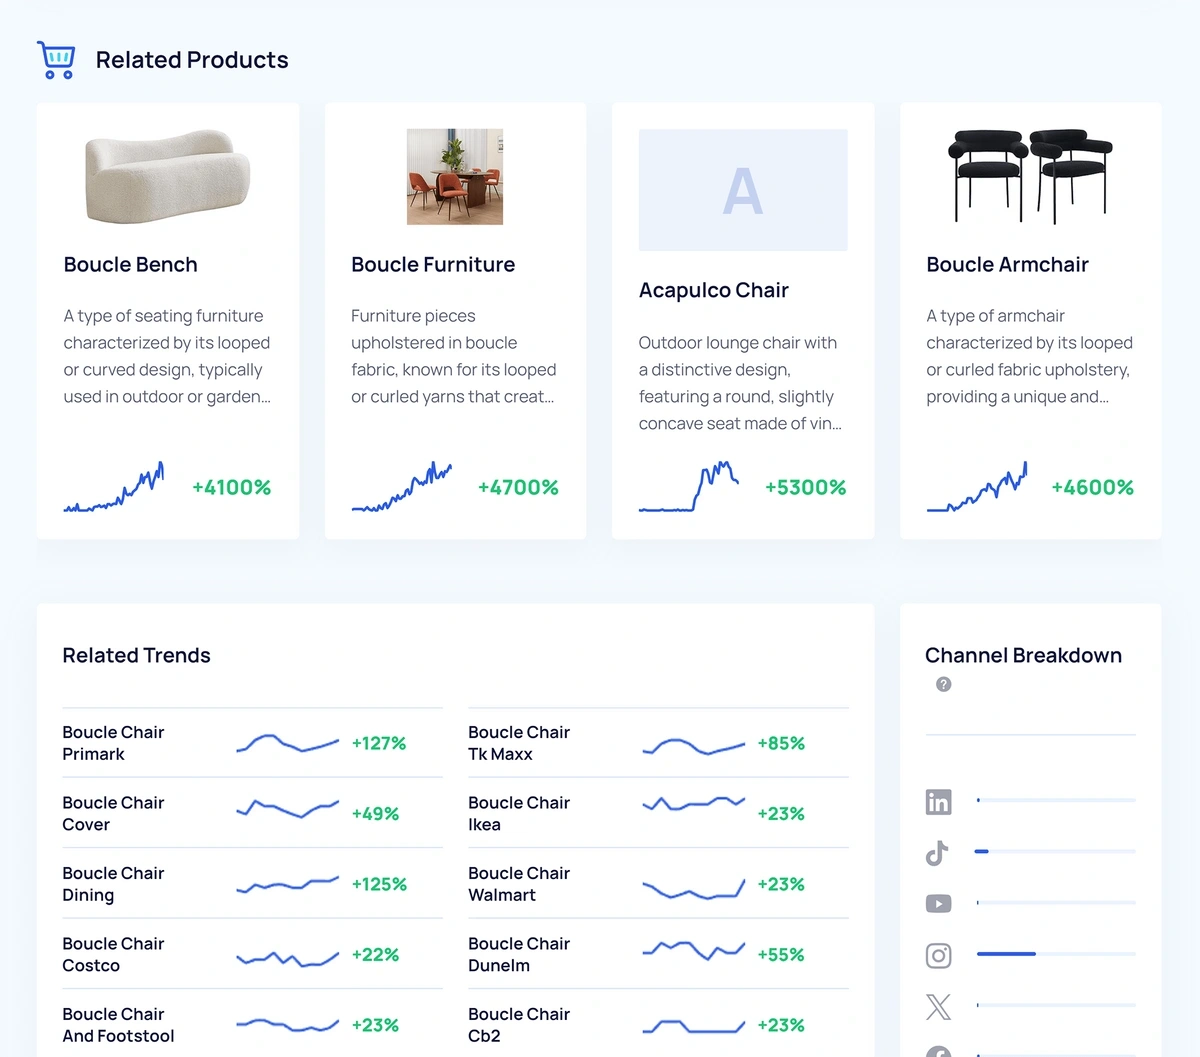
However, if you already know about a trend and want to gauge its growth potential and stability, you can type the keyword into the Trends Search feature and see a graph of its growth.
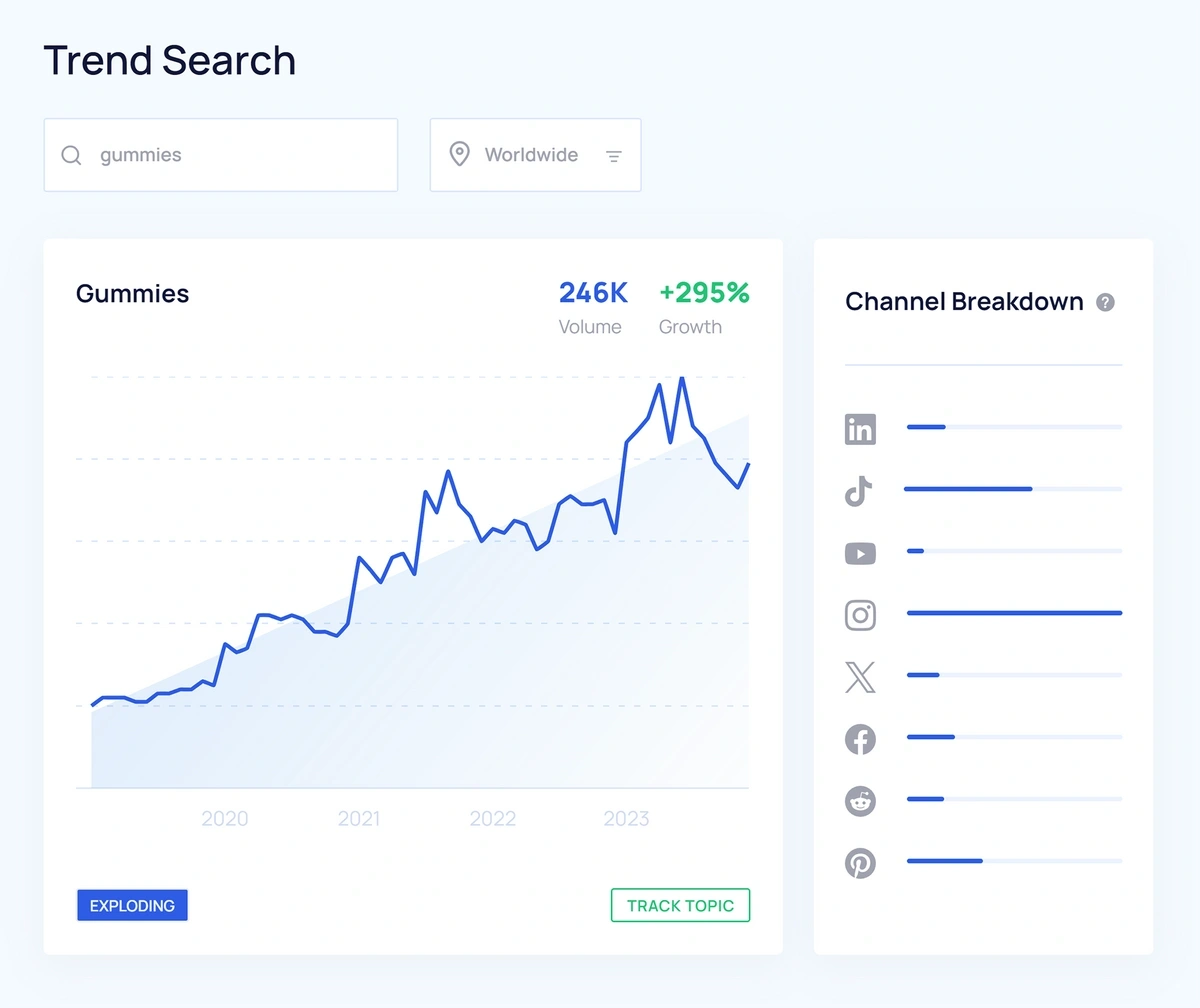
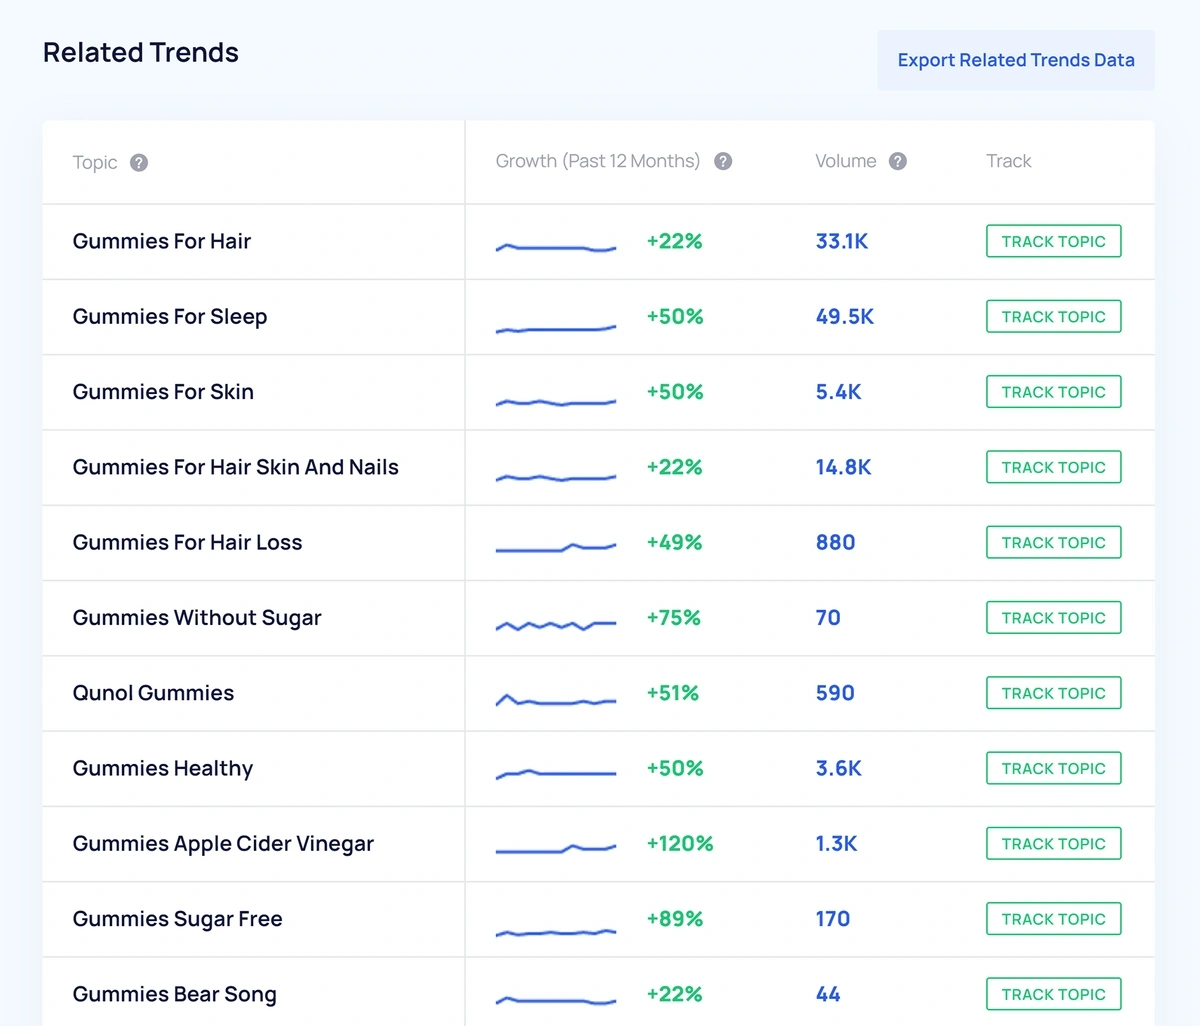
Trends Search also offers a selection of related trending topics.
Another way to identify trends is to look for growing products and brands within a growing space.
To make it easy to identify growing niches within a broader market, we built the Meta Trends database. When you find a meta trend that interests you, click on it to view trending brands, products, and search terms within that niche.
For example, Functional Pet Food is a meta trend within the broader pet food market, and the Meta Trends database shows various growing brands in that niche, including Butternut Box, Petlab, and Front of The Pack.
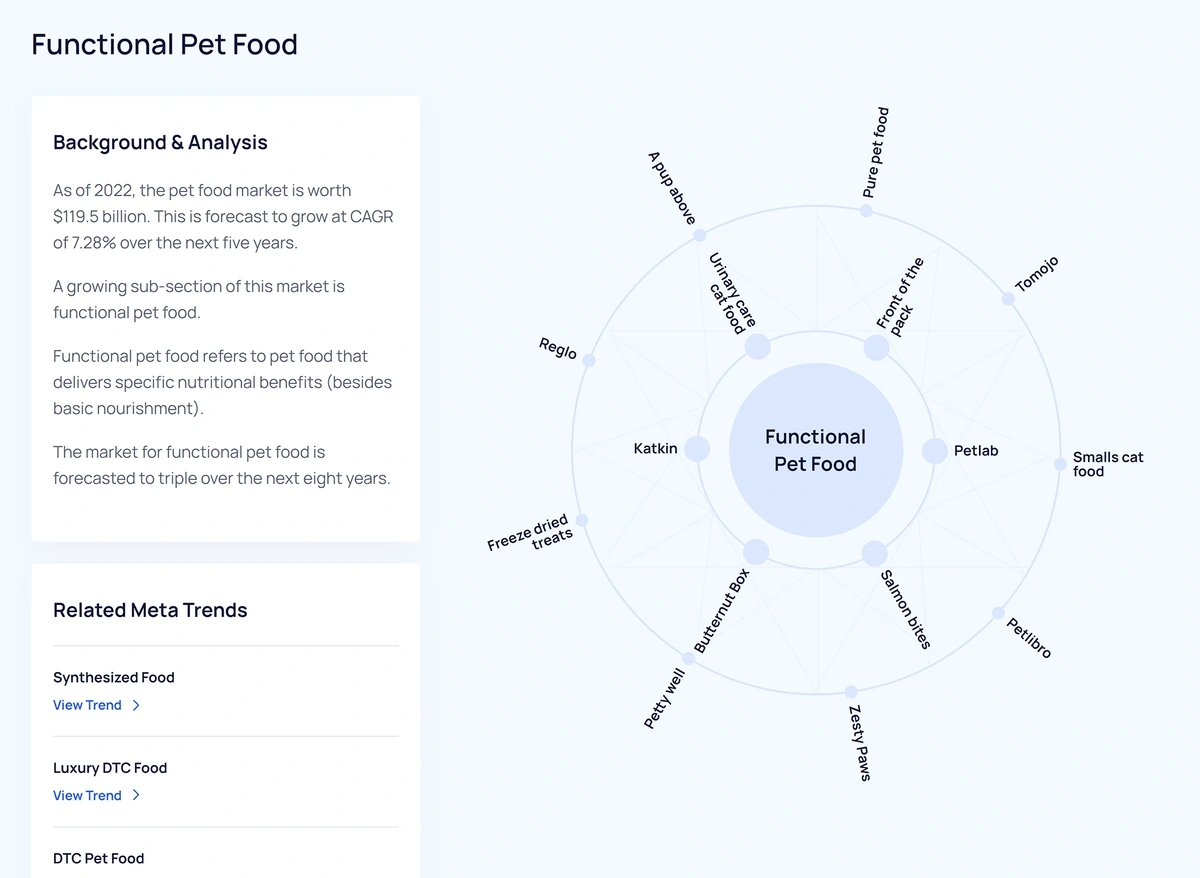
You'll see that the Meta Trends database also provides a list of other related meta trends you can explore.
There are other trend discovery tools on the market, but Exploding Topics is the only trend discovery tool we've found that offers all three of the following key benefits:
- Quickly find trends: It's structured as a searchable database of trending topics, meaning you can find trends in seconds rather than spending hours reading content to extract trends.
- Trend suggestions are based on reliable data: Rather than relying on an analyst or researcher's opinion, trends in the database are added based on a data-driven qualification process.
- Identify long-term trends: As we provide a graph of each trend's historical Google searches, it's easy to weed out fads and gauge a topic's stability and growth potential.
We've done a number of deep dives into how Exploding Topics measures up to other market trend discovery tools. For example, here's our guide to Inlinks Market Trends vs Exploding Topics.
2. Track Trending Startups and Products
One of the best ways to identify profitable E-commerce niches and trends is to see where consumers are spending their money.
While you can't look directly at consumers' bank statements, the next best method is tracking trending products and startups, as their growth is often a good indicator that people are willing to pay money for a solution.
To find trending startups, you can use the Trending Startups database in Exploding Topics and filter the results by category (design, gaming, food, beauty, etc.), total funding, latest round, number of employees, and location.
It also provides a graph of the Google searches for that brand, and you can even filter results by historical search volume growth status (exploding, regular, or peaked).
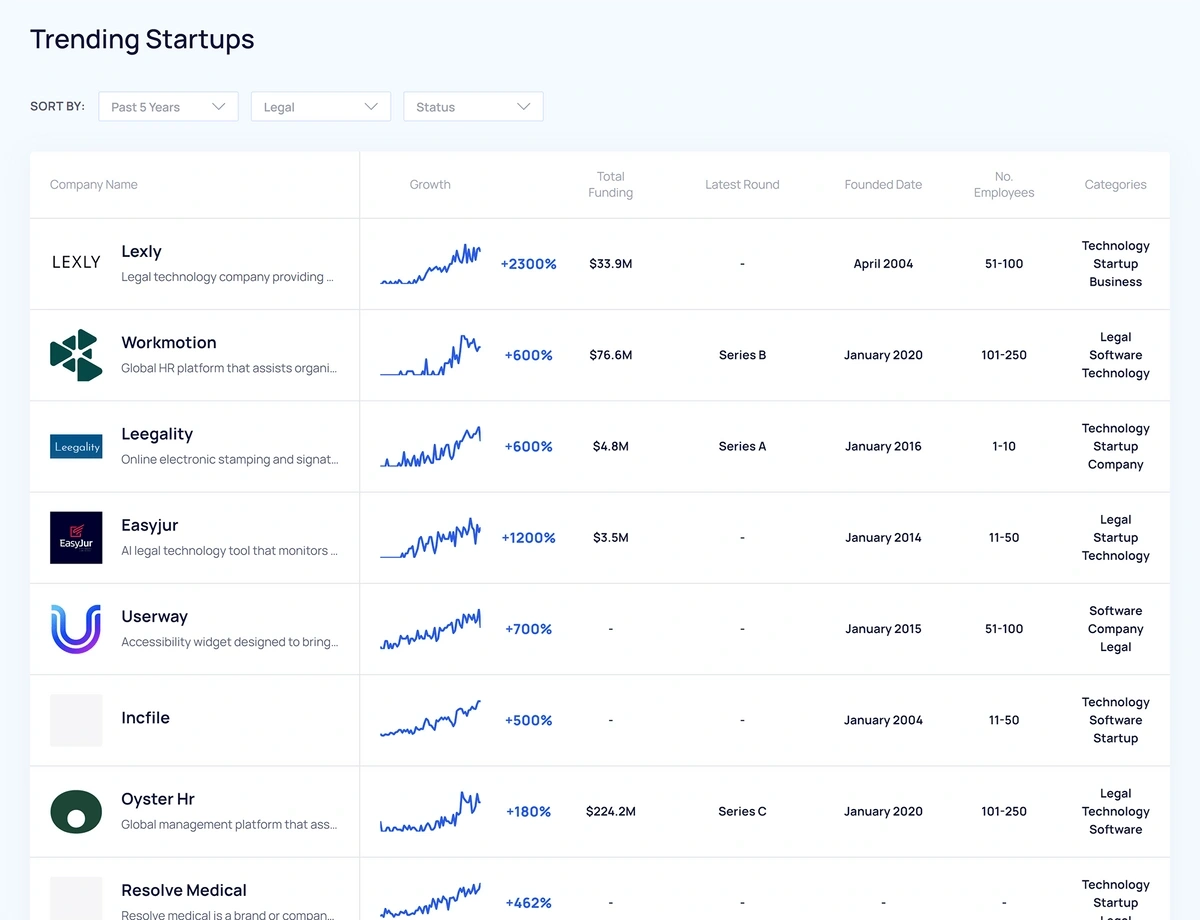
When you find an interesting startup, you can click on it to view more detailed information and other related topics.
Exploding Topics also has a Trending Products database. It contains thousands of DTC products that are steadily growing in popularity, and you can filter the database by category (fitness, travel, home, pets, etc.), revenue, profit, best seller ranking (BSR), monthly sales, and review rating.
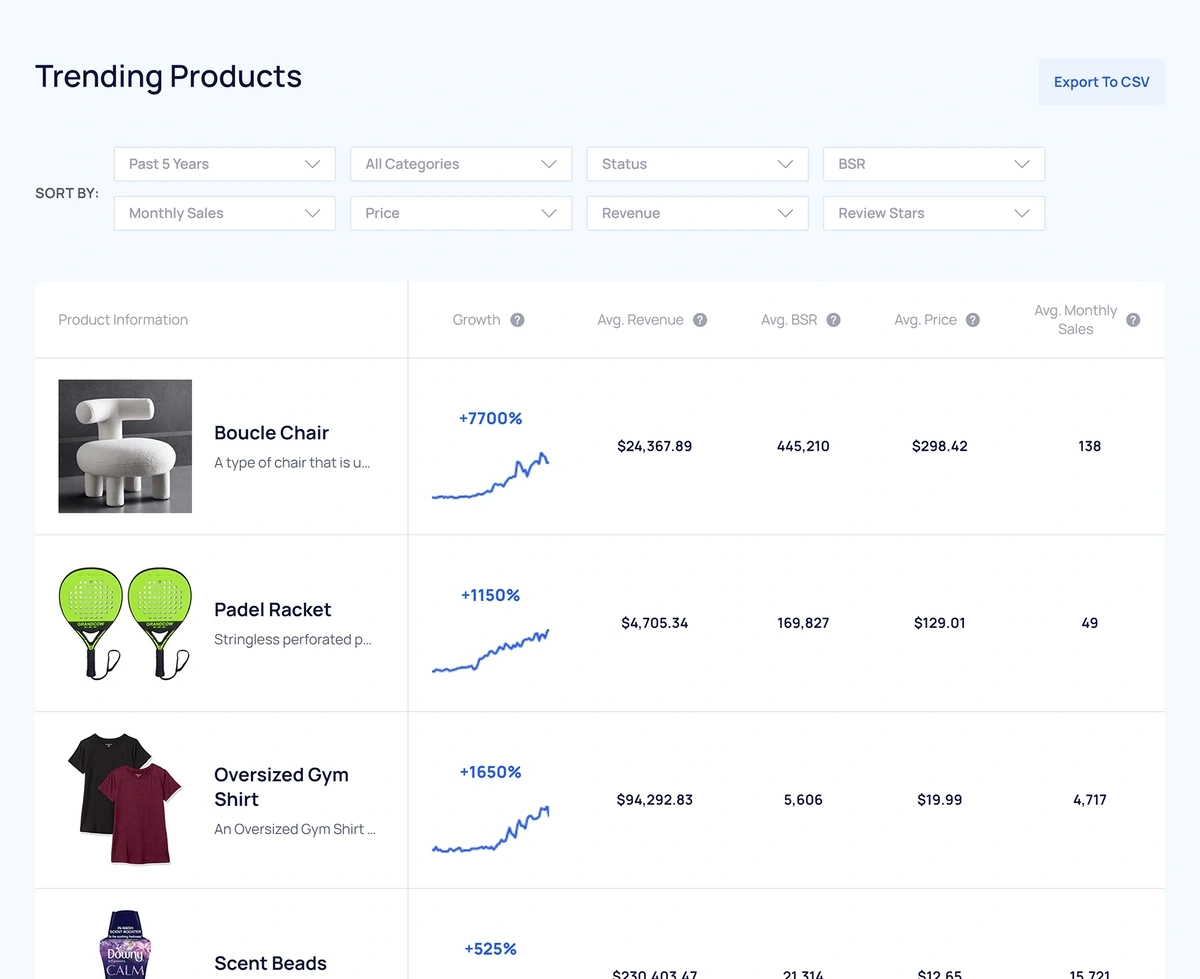
One key differentiator between the Exploding Topics Trending Products database and other product discovery tools is that it provides a graph of the product keyword's historical Google Search volume.
This data is valuable because it helps you distinguish fad products with short-term demand from more stable products with long-term growth potential.
When you find an interesting product, you can click on it to view more detailed information and other related trending products.
3. Leverage Social Listening Tools
There are plenty of industry trends on social media. However, the main problem with using social media as a trend tracking method is that there's more noise than signal.
You could easily spend hours scrolling through your newsfeed and never find a single noteworthy trend.
To solve this problem and quickly identify new trends on social media, use a social listening tool.
Social listening tools (sometimes called audience intelligence tools) allow you to track specific brands, keywords, and hashtags and then provide a list of the most popular content mentioning those terms.
For example, here's a list of the most popular social media posts mentioning the term "social listening:"
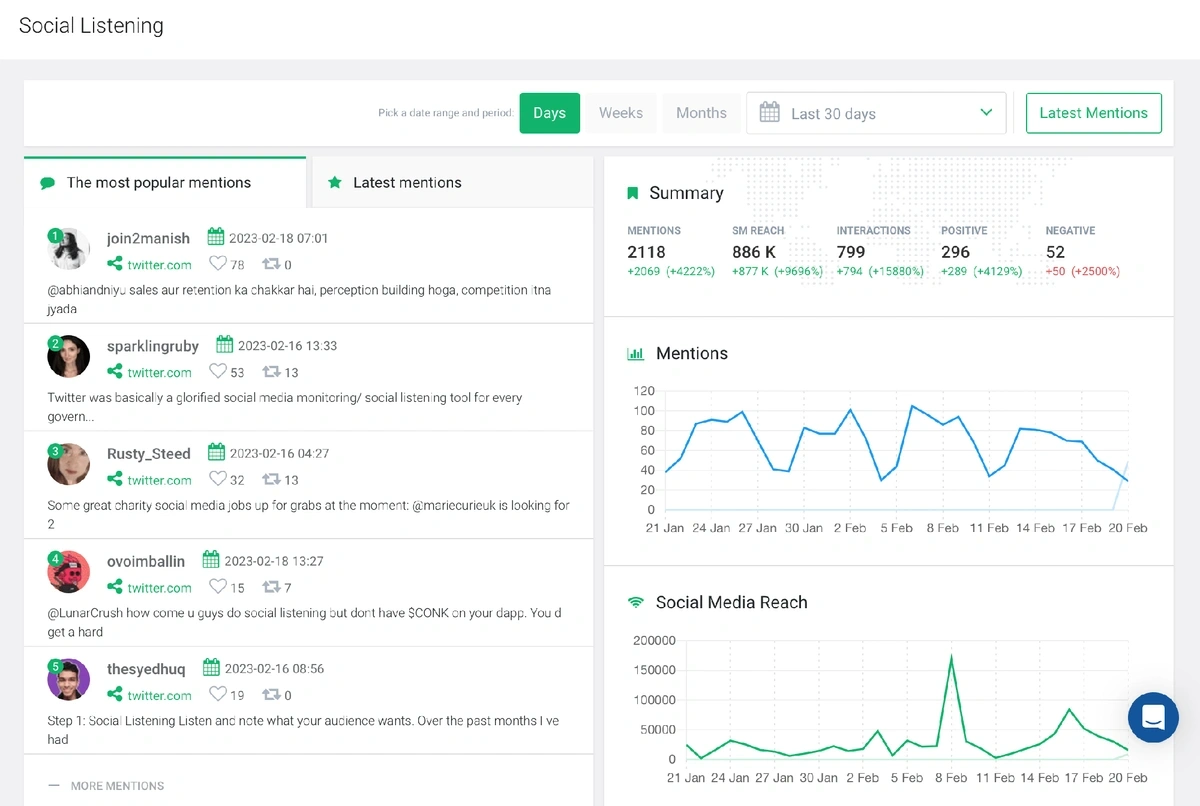
Social listening tools make it easy to track trending industry discussions without scrolling through irrelevant social media posts.
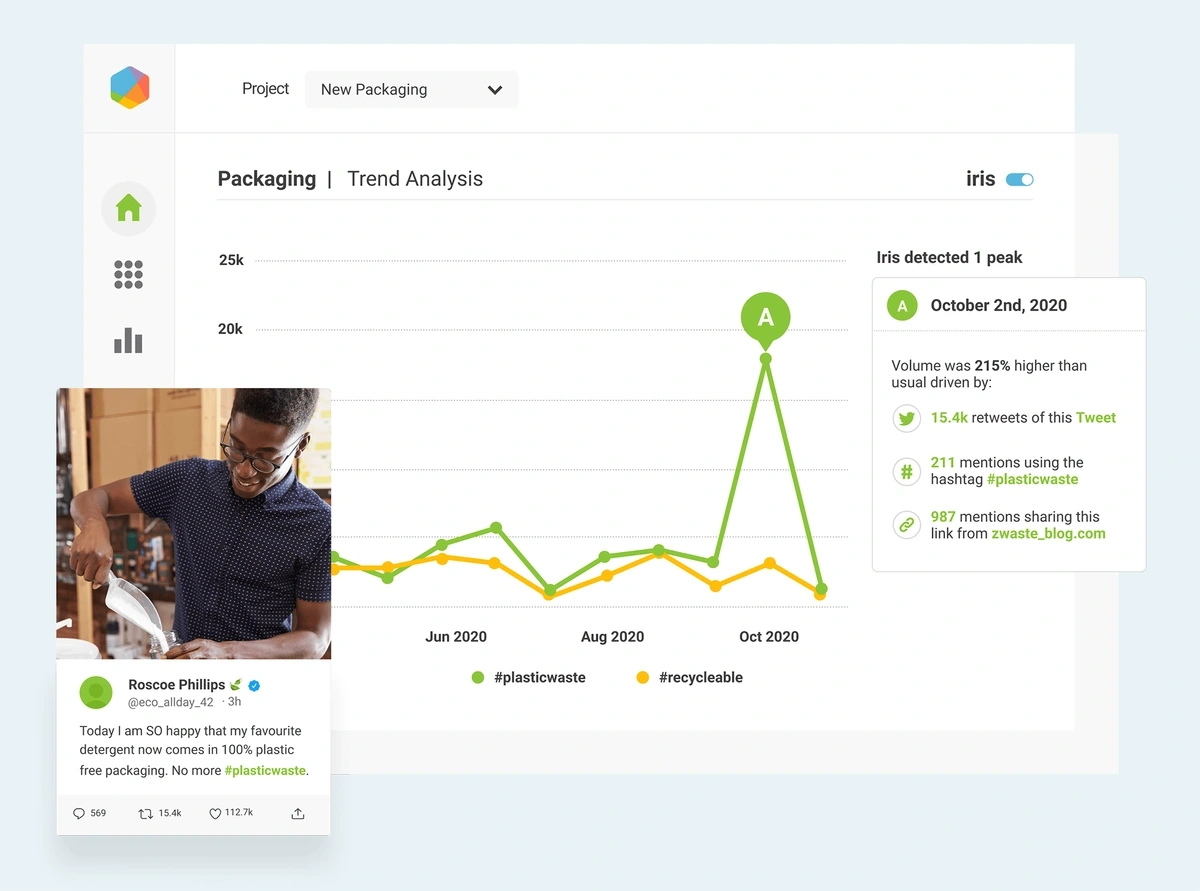
Some social listening tools also provide a graph of the keyword or hashtag's mention volume over a specified time period, which allows you to gauge the trend's popularity and stability over time.
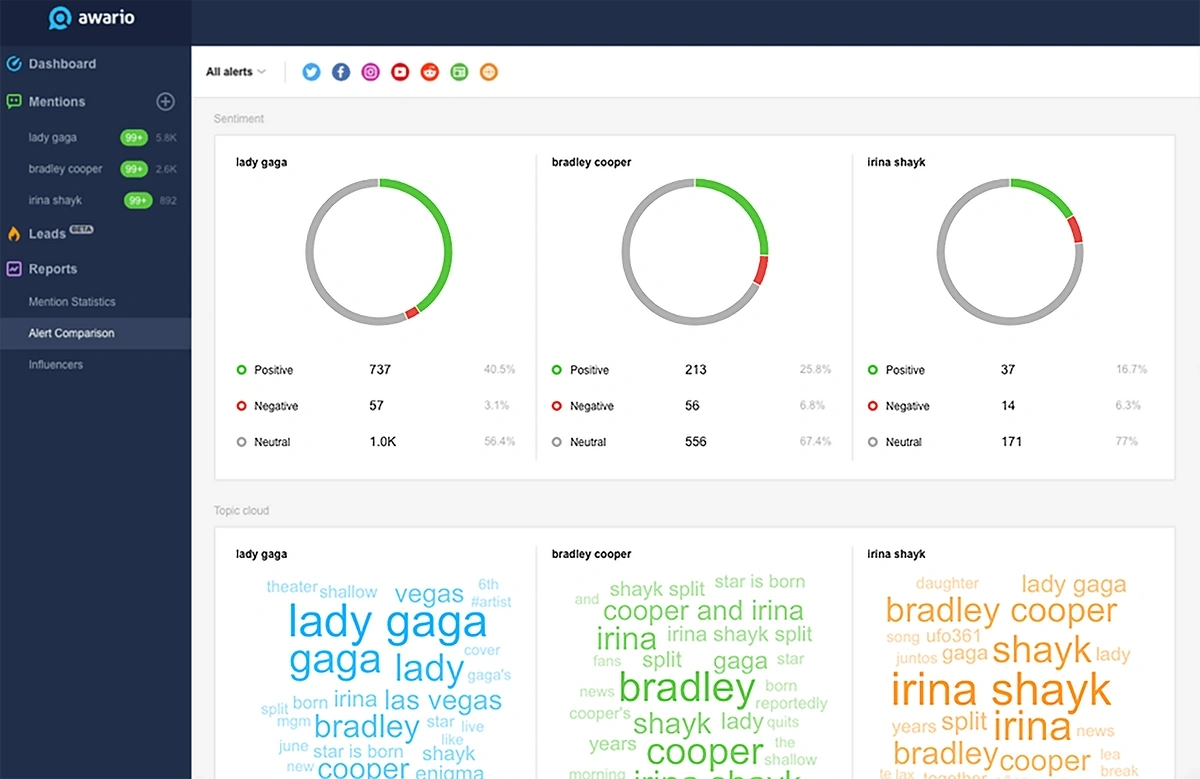
Most tools also offer sentiment analysis, which helps identify customer complaints with existing products and brands so that you can identify gaps in the market and offer a better product or service.
Some advanced social listening tools even allow you to track a specific audience group (like millennial moms in the United States) and provide insights on the most popular topics they discuss.
As social listening tools are designed to surface the most popular conversations on social media, they're excellent at uncovering current trending topics. However, you probably won't discover under-the-radar trends as, by definition, emerging trends aren't yet widely discussed online.
4. Survey Customers
Historical data and forecast models can help you predict trends, but customers actually bring trends to life.
If customers aren't willing to spend money on the product or service, the trend likely isn't worth pursuing.
Therefore, one of the best ways to gauge demand is to listen to what customers say about a specific market trend.
If you already have an existing customer base, you can create a survey with a tool like SurveyMonkey and ask for their feedback on the market trend you're exploring.
If you don't yet have a customer base, you can use SurveyMonkey's Audience Panel or Pollfish, as these services allow you to create a survey, and then they collect responses from your ideal audience for you.
For example, a recent meta trend from Exploding Topics is "organ meats supplements."
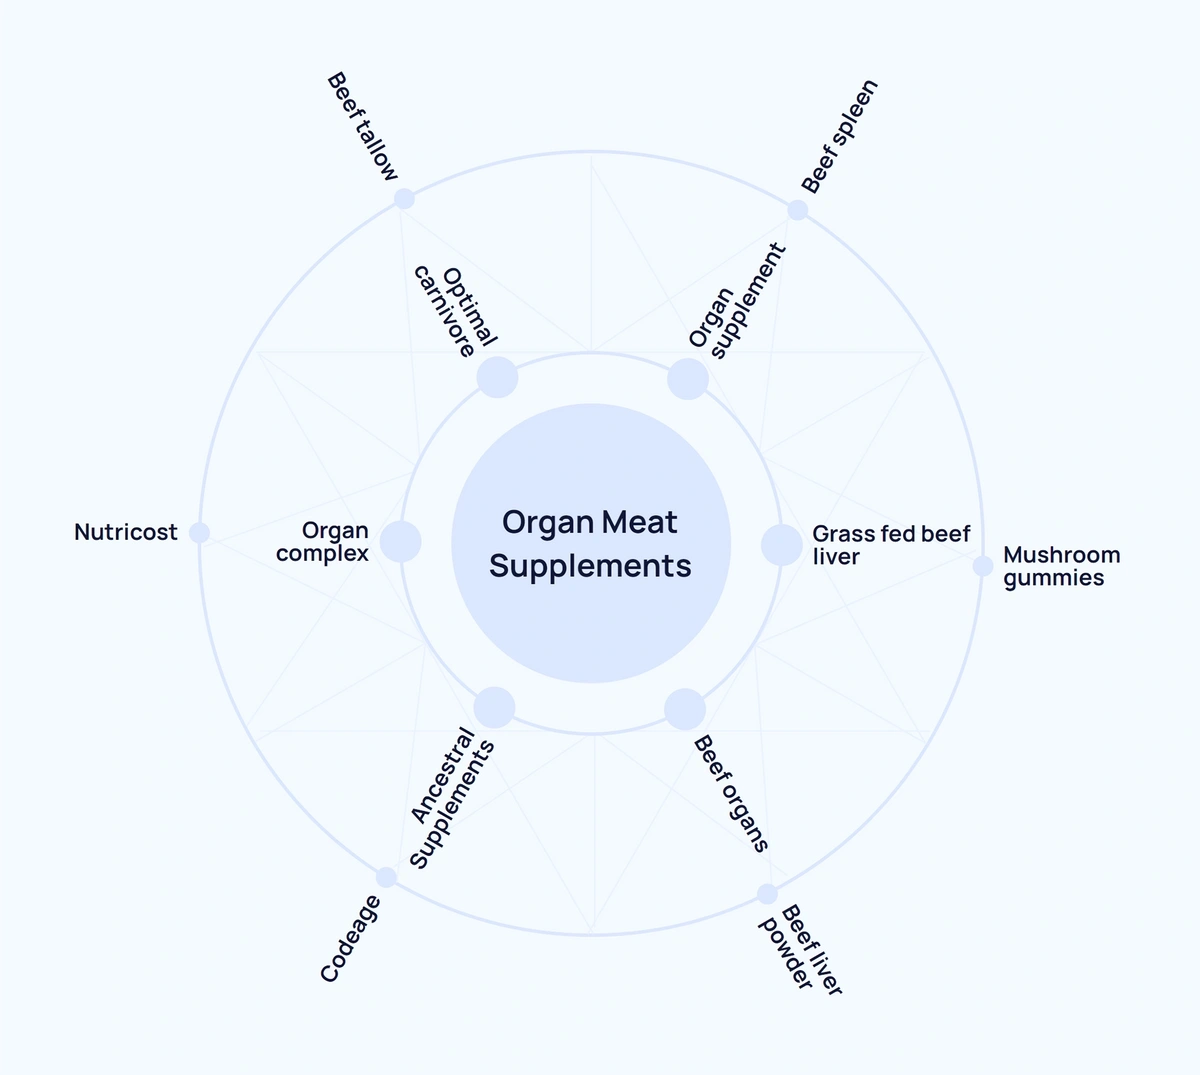
If you're interested in this trend, you could survey customers that currently use organ meat supplements and ask them questions like:
- How long have you been taking organ meat supplements, and how satisfied are you?
- Do you plan to continue using this product in the future?
- What issues did you face before taking organ meat supplements, and what pushed you to try them? Did it solve those issues?
- What reservations (if any) did you have about trying organ meat supplements?
- How did you research various organ meat supplements, and what made you choose the brand you currently use?
- If you could change anything about your current organ meat supplement, what would it be and why?
Reading reviews can also provide additional trend insights and answer some of the questions above.
For example, when I looked up reviews for organ meat supplements, this reviewer explains exactly why they used this particular product and what was different about it that made it the best:

Many of the other reviewers had similar stories, which confirms the trend likely has long-term growth potential and demand as it's clearly solving a key problem that other products failed to solve.
This customer research information can also help you identify gaps in the market as you begin creating your own product.
The only drawback with this strategy is that it's more of a market trend analysis strategy than a trend discovery strategy, as you must first know the trend exists to survey the market.
If you're purely interested in trend discovery and already have an audience, you can ask them the following questions in a survey:
- What industry trends are you interested in at the moment?
- What are similar products or services you've recently purchased, and why did you purchase them?
- What are some new related products on the market that you're interested in?
- What pain points do you have with your current solution?
These answers might not give you perfect trend suggestions, but they can point you in the right direction to uncover new trends.
5. Monitor Competitor Movement
Chasing the wrong trends or fads hurts your business's growth, but how do you distinguish fads from critical trends?
Instead of guessing and hoping you pick the right trend, look at the trends your competitors are already investing in.
If multiple competitors are tapping into a trend, you can assume that they've done thorough research and have strong data forecasting that the trend has long-term growth potential.
Watching your competitors also gives you the unique opportunity to see how the market responds to the trend before investing a cent.
That way, you can learn from their execution mistakes to deliver a better solution and a smoother launch.
Monitoring competitor movement from the sidelines may seem like a reactive strategy, and you may worry that you'll be too late if you don't immediately execute on new trends.
While executing on important trends early is essential, you don't need to be the very first company to invest in a trend.
In fact, if you consider social networks, many of the earliest versions, like MySpace, no longer exist. Instead, it was the second movers that learned from the early social networks and ultimately became the biggest brands in the space.
As long as you execute quickly on proven trends, monitoring competitor movement is an excellent method to select the best trends to invest in.
So how do you monitor competitor movement to identify trends?
Below we'll discuss how you can track competitor movement in the following areas to identify trends they're investing in:
- Hiring activity
- Messaging
- Press releases
- Content topics (social media and blog posts)
Hiring Activity
If a company is hiring new employees to chase a specific trend, that's a good indicator that they firmly believe in that trend and are actively investing in it.
So look at positions they're offering on job sites like Indeed, as well as their website and LinkedIn jobs page.
For example, the pet toy subscription company, BARK, is hiring a VP of Pet Consumables and a Planning Manager for Consumables. If you click on the job descriptions, it states that they're expanding into dental and food product markets.
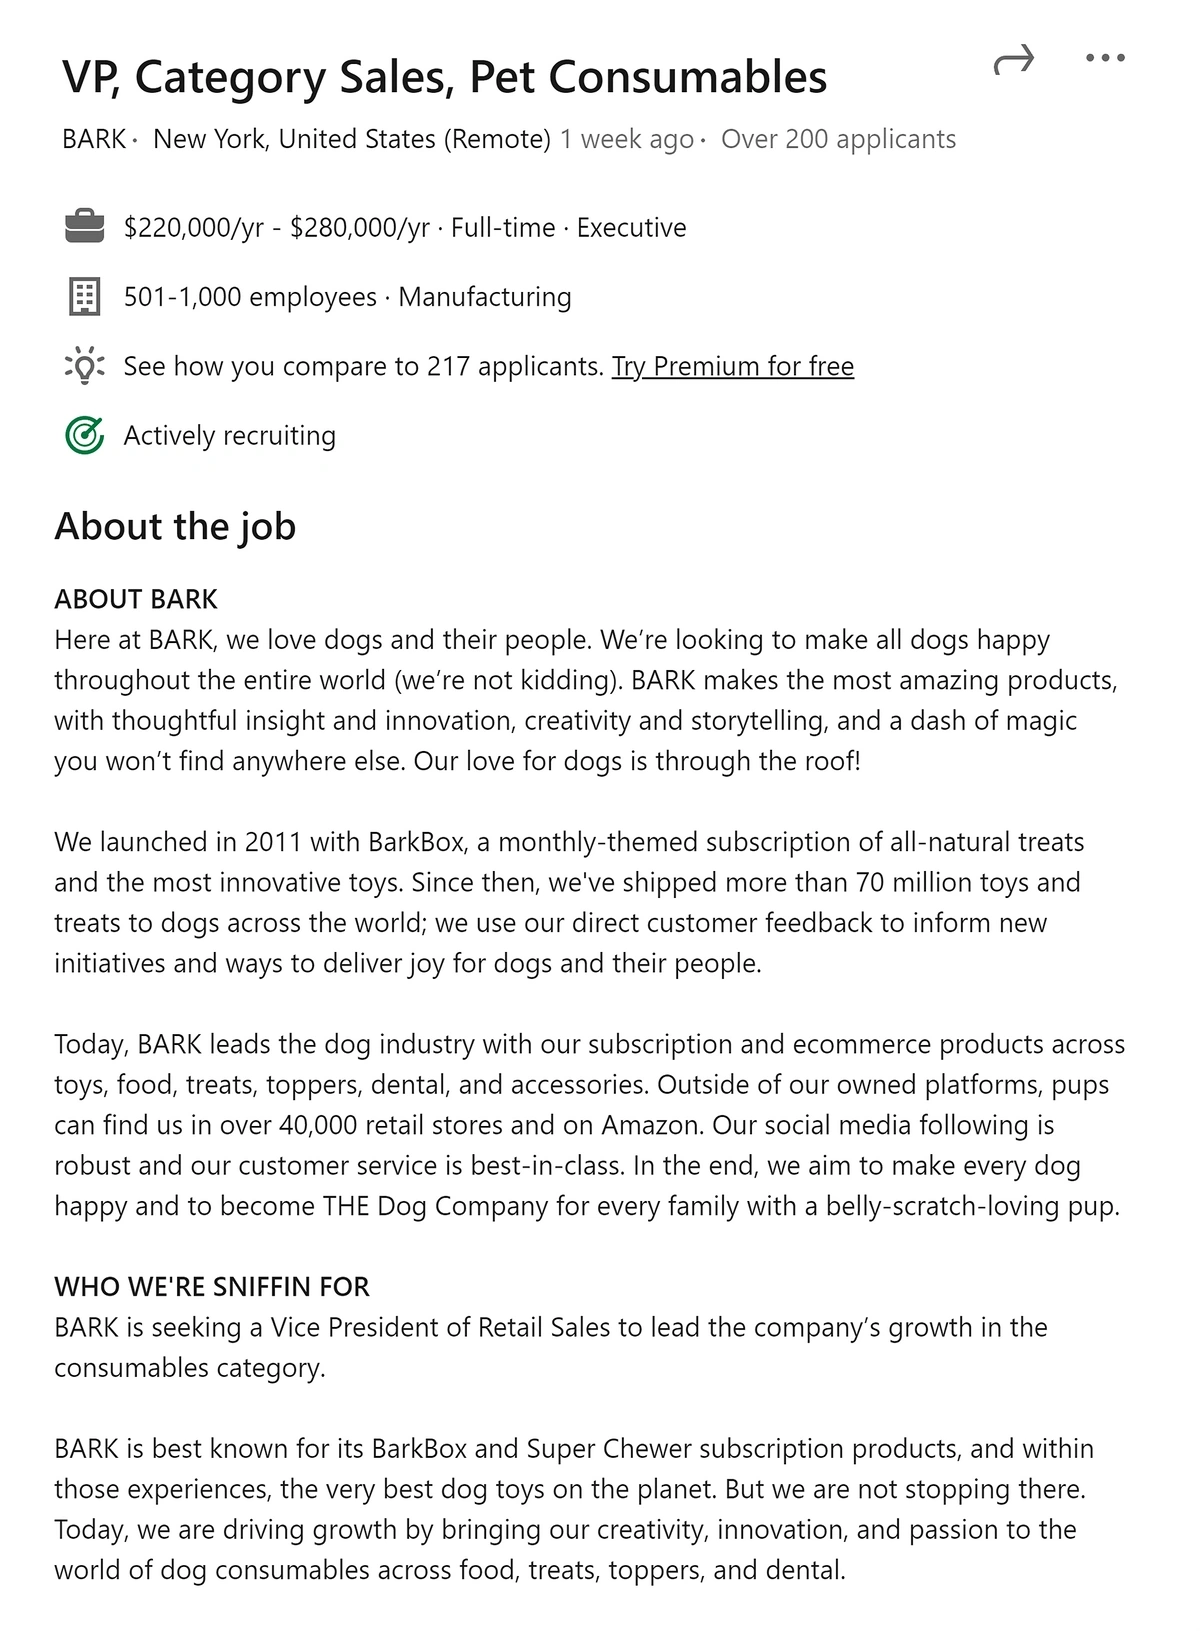
So if BARK is a key competitor, you may want to do some market research on the dog dental treat industry.
You can also look for new executive hires as this can give you an idea of new departments they’re developing.
Messaging
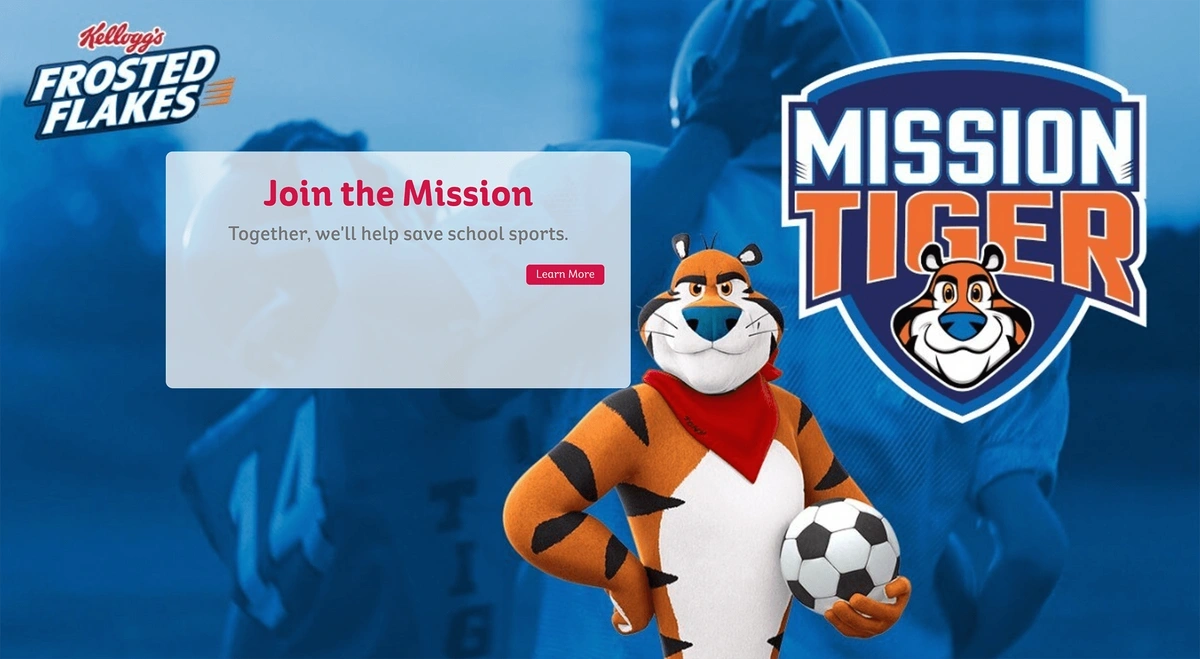
If a company changes the messaging on its homepage to reflect a new trend, there's a good chance you should also invest in that trend.
For example, looking at Kellogg's homepage from 2020 in the Wayback Machine, you can see that the featured product is its high-sugar cereal, Frosted Flakes, and it's promoting its efforts to aid the community and save sports.
In 2023, the homepage reflects sustainability and plant-based wellbeing trends.
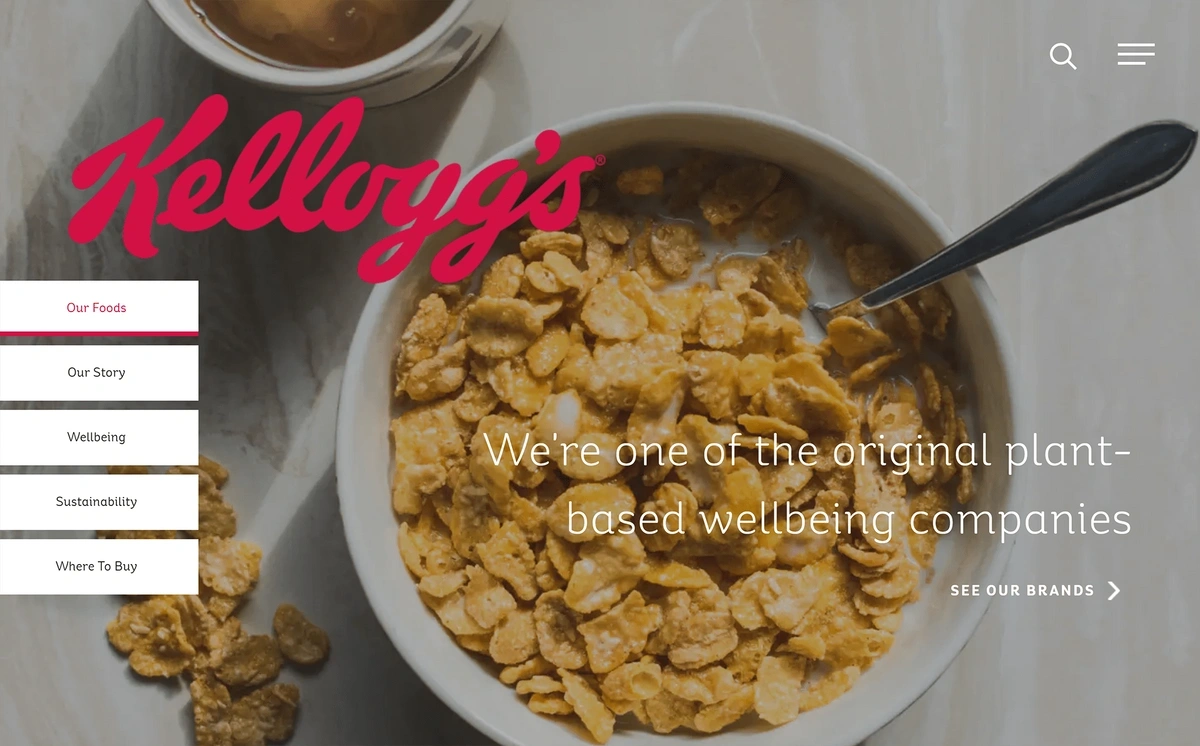
So if Kellogg is your competitor, sustainability and wellbeing are clearly important trends to incorporate into your branding and business strategy.
You can manually track your competitors' messaging by browsing their websites every few weeks.
Press Releases
Your competitors will probably publish a press release if they have a major feature launch or raise funding, and they usually provide a glimpse into the trends they're investing in.
For example, Snowflake recently announced it acquired the AI startup, Neeva.
The TechCrunch article reveals that Snowflake acquired it to incorporate more generative AI into their business to improve the user experience:
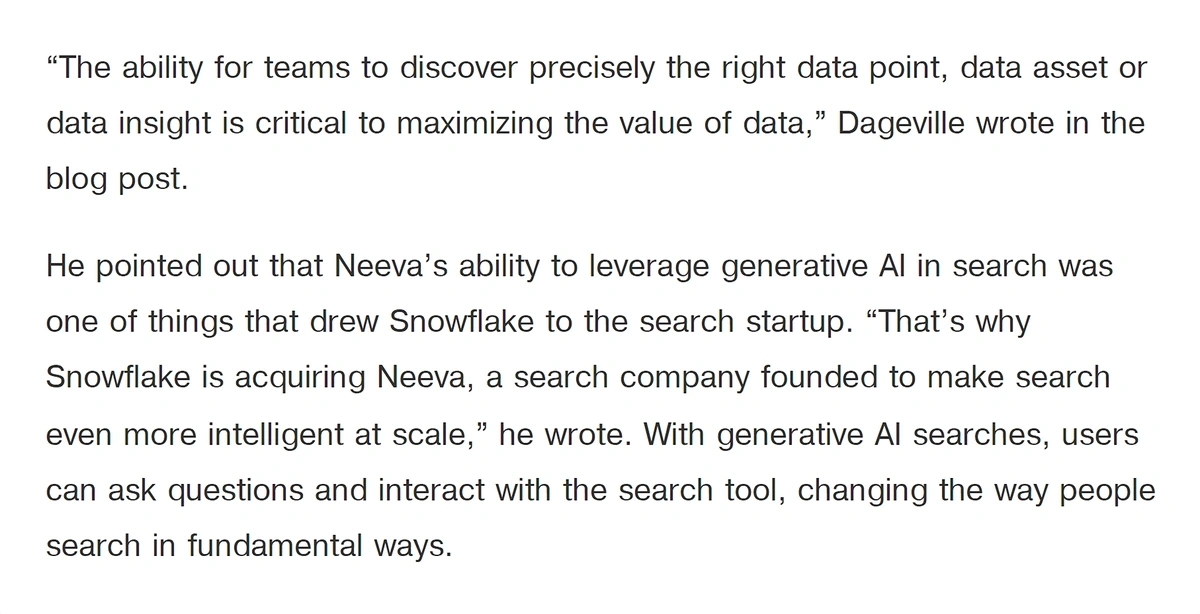
This press release is a goldmine of information for Snowflake competitors that want to stay up-to-date with AI trends in the industry and incorporate AI into their products.
To find press releases on your competitors, you can watch their blogs and regularly browse sites like TechCrunch.
Content Topics
Competitors often create content around new trends they're investing in, so browsing their blogs and social media content is another great method to track trends.
If you don't have time to browse your competitors' content consistently, you can use a social listening tool to alert you of new popular content published by your competitors.
You can also connect your competitors' content feeds (blogs, social channels, etc.) in a tool like Feedly, which gives you a consolidated view of all your competitors' recent content.
Finally, if you don't want to manually monitor your competitors' activity, you can use a competitor intelligence (CI) tool to do the work for you. Most CI tools use AI to monitor recent changes in hiring activity, messaging, press releases, and content, and alert you of important updates.
6. Subscribe To Trend Newsletters
Industry publications typically have plenty of trend ideas, but most people find it too time-consuming to read through industry publications daily.
So instead, subscribe to trend newsletters that provide the latest industry news in bite-sized formats so that you can stay up-to-date in five minutes or less.
You can find the best industry newsletters on Substack or do a quick Google search for your industry and the keyword "newsletters."
Efficiently Identify Important Market Trends Early
Identifying the right trend early on can help propel your business to the top of the industry, but investing in the wrong trend (or the right trend at the wrong time) can be a costly distraction and put your business further behind,
So rather than browsing social media or industry publications for trend ideas and then using your gut instinct to choose a trend to invest in, use the trend identification strategies above to identify and analyze quality trends.
While any trend strategies above are effective, our favorite strategy is simply using a trend discovery tool that does all of the work for you.
There are several trend discovery tools on the market, but we built Exploding Topics because we couldn't find one that does all of the following:
- Identifies emerging trends before they peak thanks to AI scanning billions of web pages.
- Uses quality, objective data from a large sample size (Google Search volume) to qualify trends with long-term growth potential and weed out fads.
- Allows you to identify trends in seconds by scanning a database of topics rather than spending hours reading articles.
Whether you're developing a new product or just want to keep an eye on new industry trends, you can use Exploding Topics for free today.
Stop Guessing, Start Growing 🚀
Use real-time topic data to create content that resonates and brings results.

Exploding Topics is owned by Semrush. Our mission is to provide accurate data and expert insights on emerging trends. Unless otherwise noted, this page’s content was written by either an employee or a paid contractor of Semrush Inc.
Share
Newsletter Signup
By clicking “Subscribe” you agree to Semrush Privacy Policy and consent to Semrush using your contact data for newsletter purposes
Written By


Josh is the Co-Founder and CTO of Exploding Topics. Josh has led Exploding Topics product development from the first line of co... Read more