


Get Advanced Insights on Any Topic
Discover Trends 12+ Months Before Everyone Else
How We Find Trends Before They Take Off
Exploding Topics’ advanced algorithm monitors millions of unstructured data points to spot trends early on.

Keyword Research
Performance Tracking
Competitor Intelligence
Fix Your Site’s SEO Issues in 30 Seconds
Find technical issues blocking search visibility. Get prioritized, actionable fixes in seconds.
Powered by data from
Latest Blog Posts
Featured Case Studies
See what's trending before everyone else
Each week, we'll send you our best Exploding Topics. Plus, expert insight and analysis.
Internet Traffic from Mobile Devices (July 2025)

Internet use and mobile use are components of everyday life for billions of people.
In fact, for many, the two now go hand in hand.
With the new “mobile-first” world in mind, here’s a breakdown of what we’ll cover about the current state of website traffic from mobile devices in 2025:
Mobile Device Internet Usage Stats (Top Picks)
- Over 64% of website traffic comes from mobile devices in 2025.
- 96.3% of internet users access the internet using a mobile phone.
- There are approximately 4.32 billion active mobile internet users.
- Africa has the highest proportion of internet traffic from mobile devices – 69.13%.
- There will be over 1 billion 5G connections worldwide by 2025.
What Percentage of Internet Traffic Comes From Mobile Devices?
As of May 2025, people using mobile devices contribute to 64.35% of all website traffic.
Back in 2011, this figure sat at 6.1%. In 2015, this was up to 38.59%.
The percentage of people accessing the internet via mobile devices has increased year-over-year. Q1 2017 was the first time mobile traffic surpassed traffic from desktop computers.
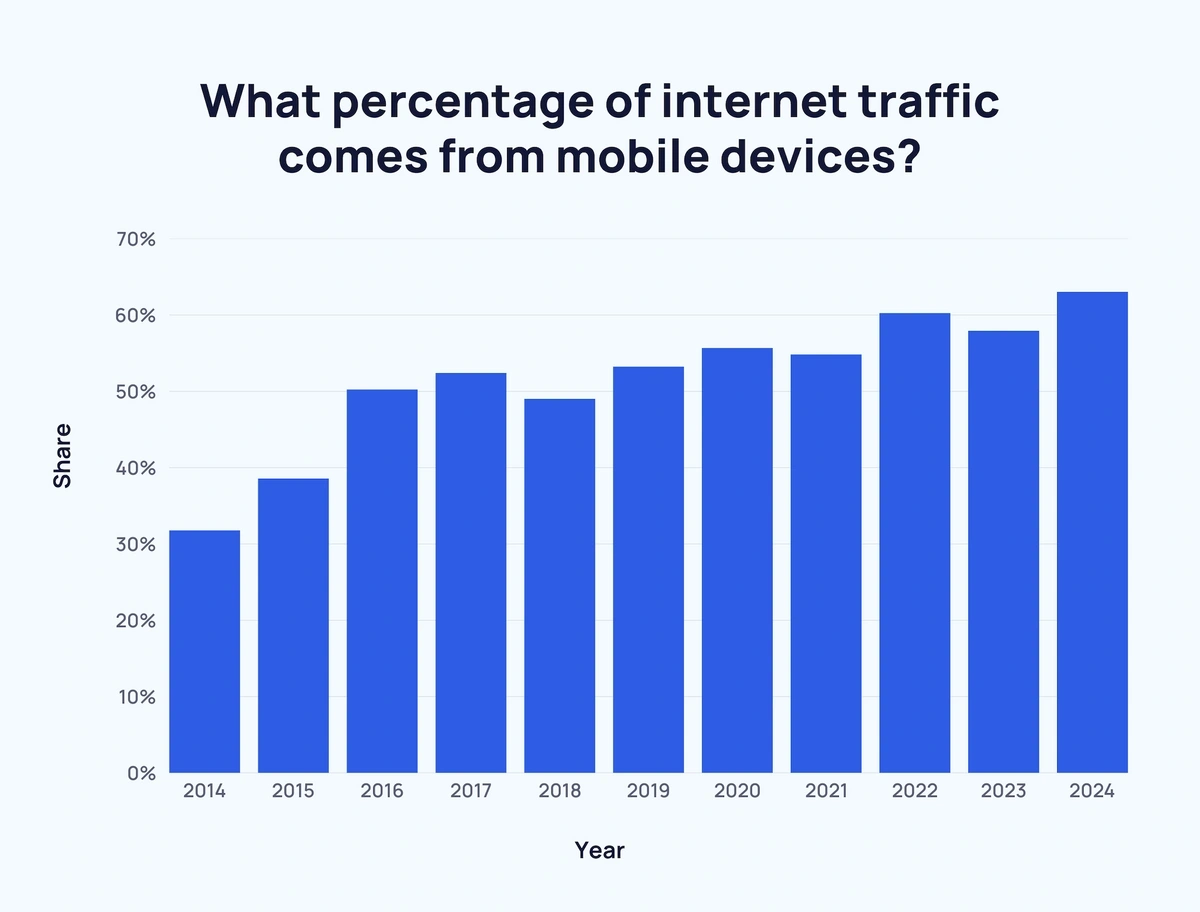
Here’s a quick look at mobile internet traffic share since December 2014 to December 2024:
| Year | Share | Annual Change |
| Dec 2014 | 31.79% | – |
| Dec 2015 | 38.59% | ↑ 21.39% |
| Dec 2016 | 50.25% | ↑ 30.26% |
| Dec 2017 | 52.40% | ↑ 4.28% |
| Dec 2018 | 49.02% | ↓ 6.45% |
| Dec 2019 | 53.25% | ↑ 8.63% |
| Dec 2020 | 55.69% | ↑ 4.59% |
| Dec 2021 | 54.84% | ↓ 1.53% |
| Dec 2022 | 60.28% | ↑ 9.91% |
| Dec 2023 | 57.94% | ↓ 3.88% |
| Dec 2024 | 63.05% | ↑ 8.83% |
Over the last five years, website traffic from mobile devices has fluctuated somewhat. However, there has been a steady upward trend.
People access the internet using different devices at different times. A recent survey of internet usage split these into 10 categories (some of which overlap).
The data revealed that around 96.3% of internet users access the internet using a mobile phone of some kind.
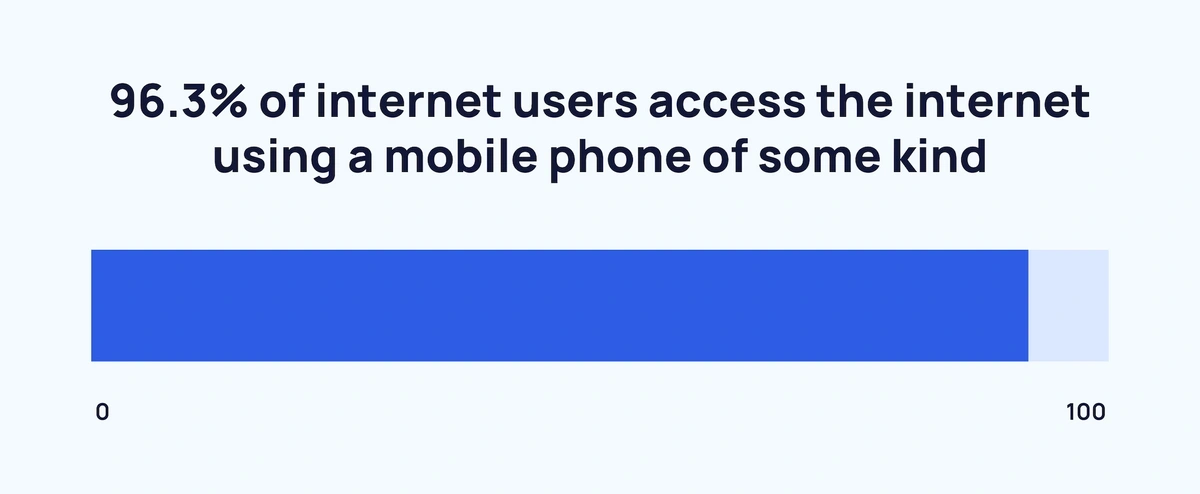
By comparison, 61.5% use the more traditional laptop or desktop.
Here's the latest data on internet traffic distribution by device:
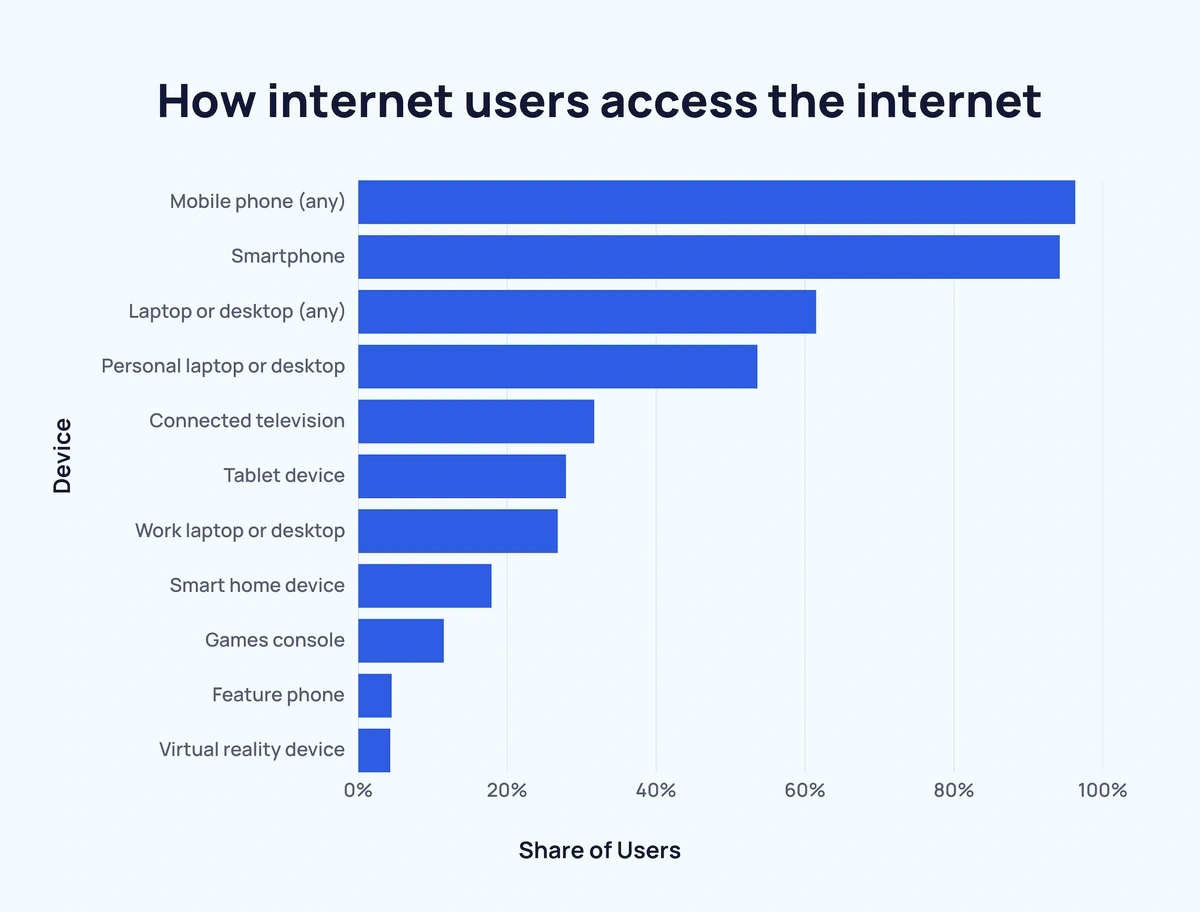
Here is a full breakdown of the findings:
| Device | Share of Users |
| Mobile Phone (Any) | 96.3% |
| Smartphone | 94.2% |
| Laptop or Desktop (Any) | 61.5% |
| Personal Laptop or Desktop | 53.6% |
| Connected Television | 31.7% |
| Tablet Device | 27.9% |
| Work Laptop or Desktop | 26.8% |
| Smart Home Device | 17.9% |
| Games Console | 11.5% |
| Feature Phone | 4.5% |
| Virtual Reality Device | 4.3% |
Cellular data traffic has increased quarter-over-quarter since Q1 2017.
The amount of monthly cellular data consumed by the average smartphone worldwide has grown from 9.68 EB in Q1 2017 to 133.68 EB in Q2 2023.
The monthly cellular data consumed by the average smartphone now stands at 21.1 GB.
Here's how mobile network data traffic has changed over time:
| Quarter, Year | Monthly Average Global Mobile Network Data Traffic (Upload and Download) in Exabytes |
| Q1 2017 | 9.68 EB |
| Q2 2017 | 10.63 EB |
| Q3 2017 | 11.69 EB |
| Q4 2017 | 13.6 EB |
| Q1 2018 | 15.94 EB |
| Q2 2018 | 18.37 EB |
| Q3 2018 | 21.78 EB |
| Q4 2018 | 26.54 EB |
| Q1 2019 | 29.02 EB |
| Q2 2019 | 32.66 EB |
| Q3 2019 | 36.49 EB |
| Q4 2019 | 39.56 EB |
| Q1 2020 | 45.16 EB |
| Q2 2020 | 50.03 EB |
| Q3 2020 | 54.79 EB |
| Q4 2020 | 58.44 EB |
| Q1 2021 | 66.14 EB |
| Q2 2021 | 72.2 EB |
| Q3 2021 | 77.81 EB |
| Q4 2021 | 84.16 EB |
| Q1 2022 | 92.75 EB |
| Q2 2022 | 100.42 EB |
| Q3 2022 | 107.58 EB |
| Q4 2022 | 118.21 EB |
| Q1 2023 | 126 EB |
| Q2 2023 | 133.86 EB |
| Q3 2023 | 143.14 EB |
Android dominates the share of mobile web traffic with 73.49%. Together with Apple (26.04%), the two make up 99.53% of all mobile web traffic.
Here's a breakdown of mobile web traffic share:
| Rank | Device Type | Share | Change Over Previous Year |
| 1 | Android | 73.49% | +3.01% |
| 2 | Apple | 26.04% | -2.76% |
| 3 | Samsung | 0.31% | -0.6% |
| 4 | KAI | 0.03% | -0.11% |
| 5 | Other | 0.13% | -0.8% |
Sources: StatCounter, DataReportal
Mobile Device Internet Usage by Region
Mobile computing is one of the most significant technology trends of the 21st century.
However, there is a significant disparity between mobile internet traffic usage across the globe.
Africa is the region with the highest proportion of internet traffic coming from mobile devices (69.13%).
On the other end of the spectrum, Oceania is the world’s least mobile-centric region for internet traffic (39.51%).
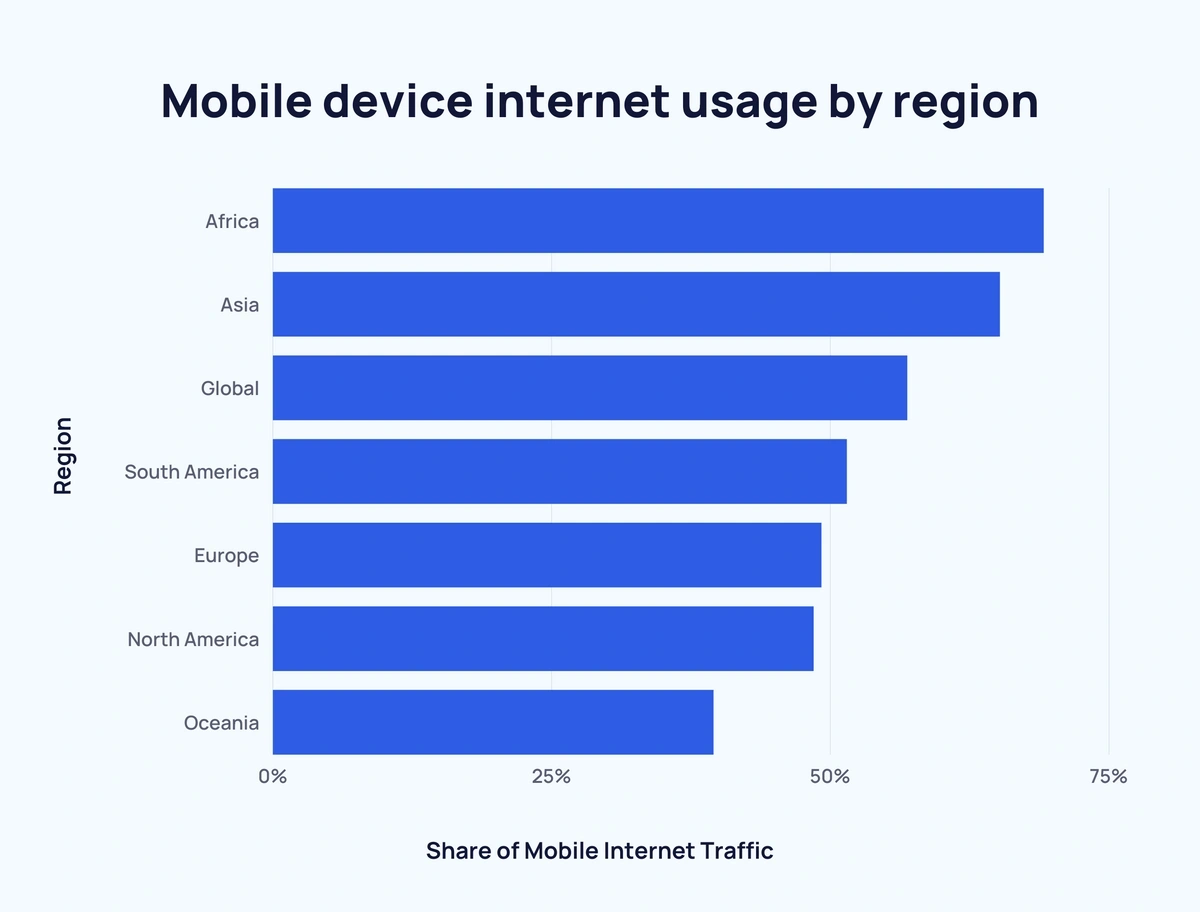
Here is a more detailed look at the most recent data:
| Rank | Region | Share of Mobile Internet Traffic | Difference from Global Average |
| #1 | Africa | 69.13% | + 12.24% |
| #2 | Asia | 65.2% | + 8.31% |
| - | Global | 56.89% | - |
| #3 | South America | 51.47% | - 5.42% |
| #4 | Europe | 49.19% | - 7.7% |
| #5 | North America | 48.49% | - 8.4% |
| #6 | Oceania | 39.51% | - 17.38% |
As a country, Indonesia is the most connected in terms of mobile internet traffic, with 98.7% of internet users accessing it via a smartphone.
Here are the top 10 nations for internet mobile phone use as of Q4 2024:
| Rank | Country | Region | Internet Access via Mobile Phone |
| 1 | Indonesia | Southeast Asia | 98.7% |
| 2 | Philippines | Southeast Asia | 98.4% |
| 3 | South Africa | Southern Africa | 98.3% |
| 4 | Brazil | South America | 98.1% |
| 5 | Thailand | Southeast Asia | 98% |
| 6 | Turkey | Western Asia | 97.9% |
| 7 | Malaysia | Southeast Asia | 97.7% |
| 8 | Taiwan | East Asia | 97.3% |
| 9 | Portugal | Southern Europe | 97% |
| 10 | Serbia | Eastern Europe | 97% |
| - | Global Average | - | 95.9% |
Taking a look at mobile internet usage from a different angle, at least 20 nations around the world have a mobile internet user penetration rate of over 90%.
And a total of 32 exceed the 85% mark.
The US has a mobile internet penetration rate of 84.37%.
Here’s a breakdown of the top 10 nations by mobile internet penetration rate:
| Rank | Nation | Continent | Mobile Internet User Penetration |
| 1 | Bahrain | Asia | 98.2% |
| 2 | UAE | Asia | 96.06% |
| 3 | Kuwait | Asia | 95.92% |
| 4 | Singapore | Asia | 95.41% |
| 5 | Canada | North America | 95.21% |
| 6 | New Zealand | Oceania | 94.86% |
| 7 | Brunei | Asia | 94.11% |
| 8 | Denmark | Europe | 93.61% |
| 9 | Japan | Asia | 93.13% |
| 10 | UK | Europe | 92.85% |
Perhaps unsurprisingly, several of the top 10 countries by mobile internet speed also rank in the top 25 for mobile internet penetration:
| Rank | Nation | Continent | May 2025 Mobile Internet Speed |
| 1 | UAE | Asia | 539.84 Mbps |
| 2 | Qatar | Asia | 529.34 Mbps |
| 3 | Kuwait | Asia | 350.89 Mbps |
| 4 | Bahrain | Asia | 245.67 Mbps |
| 5 | Bulgaria | Europe | 232.79 Mbps |
| 6 | Brazil | South America | 222.02 Mbps |
| 7 | China | Asia | 209.31 Mbps |
| 8 | South Korea | Asia | 208.07 Mbps |
| 9 | Denmark | Europe | 202.67 Mbps |
| 10 | Saudi Arabia | Asia | 196.28 Mbs |
Want to Spy on Your Competition?
Explore competitors’ website traffic stats, discover growth points, and expand your market share.
Sources: StatCounter, Data Reportal, Statista, Speedtest
Mobile Device Activity Data
As technology has evolved, so too have use cases for mobile devices.
Today, mobile devices are used for entertainment, e-commerce, financial management, business meetings, and more.
However, according to a recent survey, the most common use for a mobile device is gaming. In fact, 68% of people report playing video games on their phones.
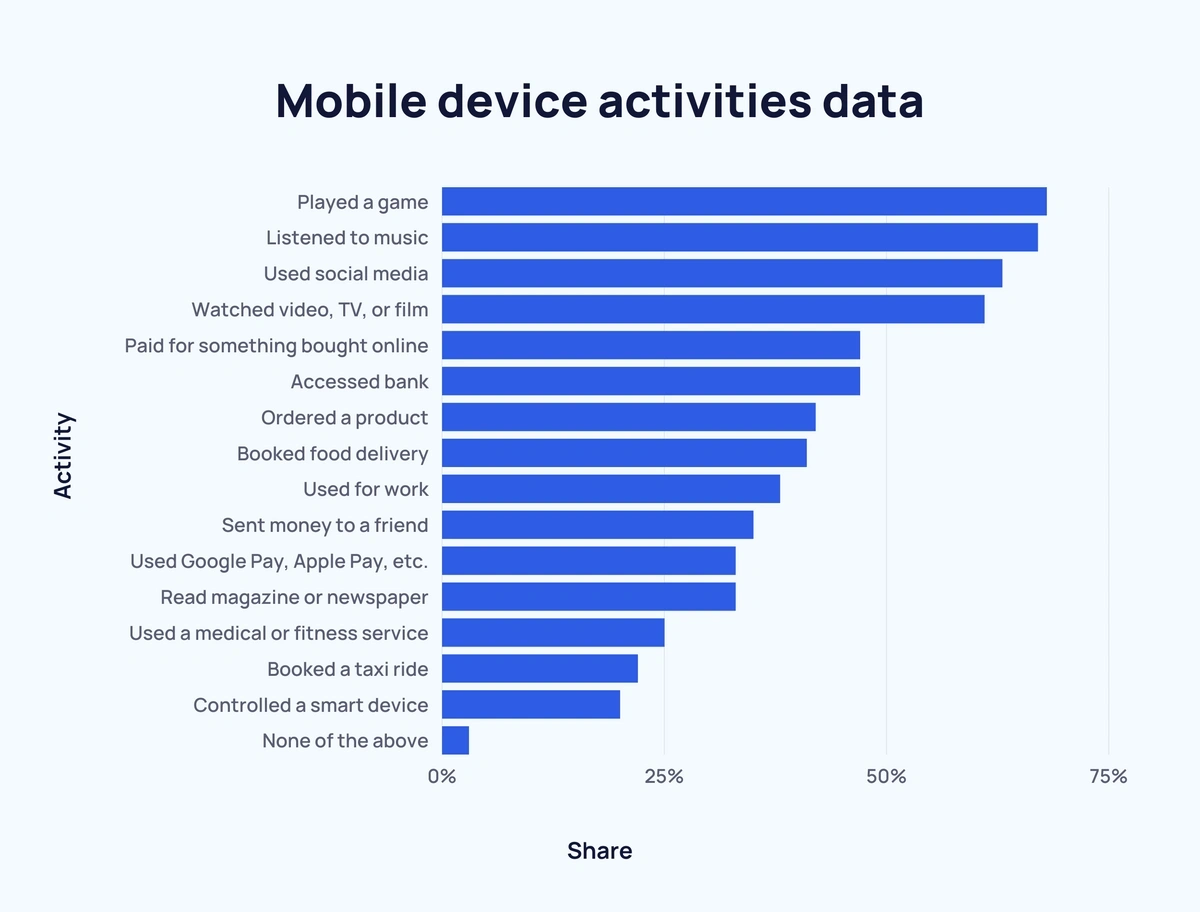
Here’s a breakdown of the 16 most common tasks that people perform using their smartphones:
| Rank | Activity | Share | Activity Type |
| 1 | Played a game | 68% | Entertainment |
| 2 | Listened to music | 67% | Entertainment |
| 3 | Used social media | 63% | Entertainment |
| 4 | Watched videos, TV, or film | 61% | Entertainment |
| =5 | Paid for something bought online | 47% | E-commerce/Finance |
| =5 | Accessed bank | 47% | Finance |
| 7 | Ordered a product | 42% | E-commerce |
| 8 | Booked food delivery | 41% | E-commerce/Health & Wellbeing |
| 9 | Used for work | 38% | Business |
| 10 | Sent money to a friend | 35% | Finance |
| =11 | Paid for something using Google Pay, Apple Pay, etc. | 33% | E-commerce/Finance |
| =11 | Read a magazine or newspaper | 33% | Entertainment |
| 13 | Used a medical or fitness service | 25% | Health & Wellbeing |
| 14 | Booked a taxi ride | 22% | Travel |
| 15 | Controlled a smart device | 20% | Entertainment/Misc. |
| 16 | None of the above | 3% | N/A |
Looking at the above table, it’s clear that e-commerce is among the most popular uses for mobile devices.
Indeed, more than half of the online population (55.4%) are likely to have bought something online in the past month with their mobile device.
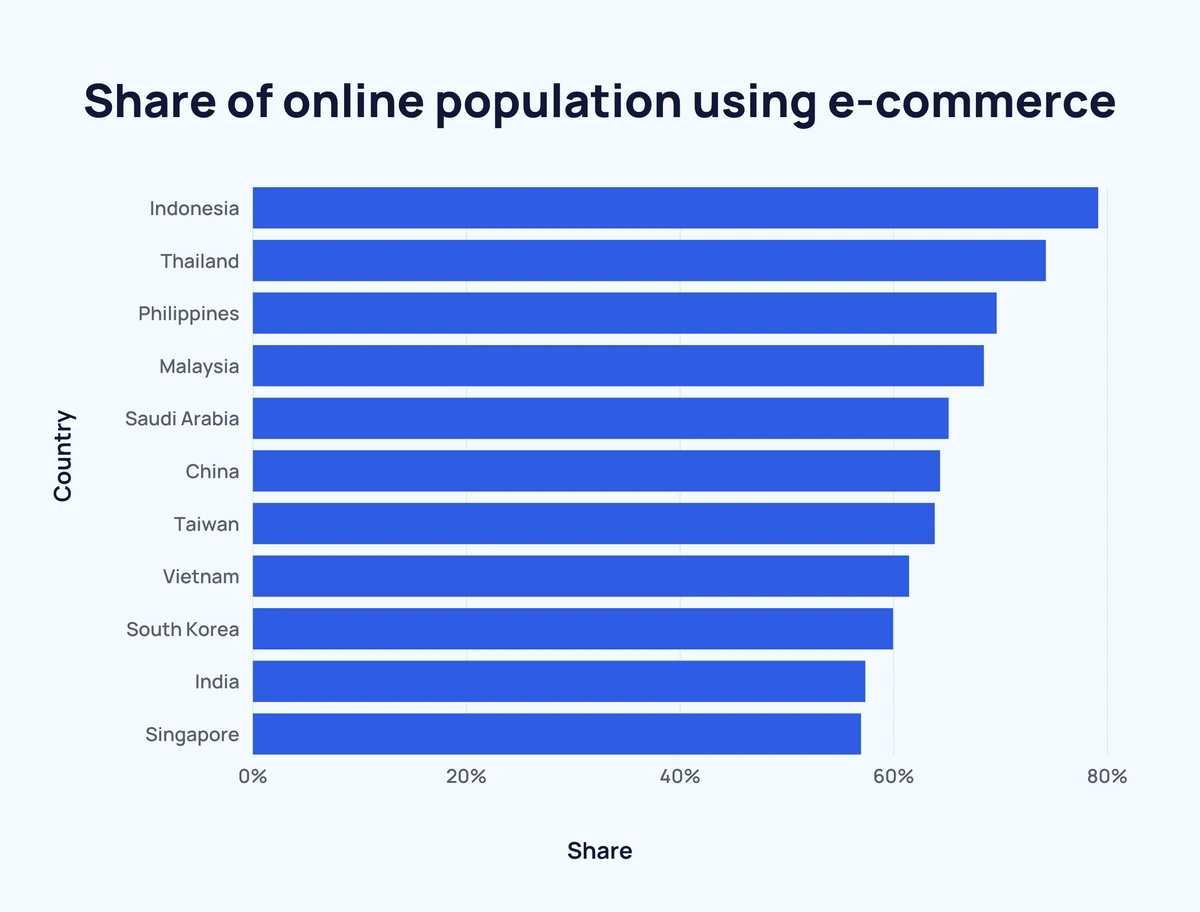
The 11 countries with a higher proportion of mobile shoppers than the global average are as follows:
| Rank | Country | Region | Share of Online Population Using E-commerce |
| 1 | Indonesia | Asia | 79.1% |
| 2 | Thailand | Asia | 74.2% |
| 3 | Philippines | Asia | 69.6% |
| 4 | Malaysia | Asia | 68.4% |
| 5 | Saudi Arabia | Asia | 65.1% |
| 6 | China | Asia | 64.3% |
| 7 | Taiwan | Asia | 63.8% |
| 8 | Vietnam | Asia | 61.4% |
| 9 | South Korea | Asia | 59.9% |
| 10 | India | Asia | 57.3% |
| 11 | Singapore | Asia | 56.9% |
Sources: Mobile Ecosystem Forum, Data Reportal
5G Adoption Statistics
Mobile internet traffic has grown along with the rollout of 5G. And there are expected to be over 1 billion 5G connections worldwide by the end of 2025.
China is expected to have over 3x more 5G connections than any other country.
In fact, it is predicted that China will have considerably more 5G connections than the US, Japan, Germany, South Korea, the UK, France, and Canada combined.
Here are the predicted country-by-country 5G connections:
| Country | 5G Mobile Connections | Share of 5G Mobile Connection |
| China | 866 million | 51% |
| USA | 247 million | 68% |
| Japan | 138 million | 68% |
| Germany | 68 million | 58% |
| South Korea | 45 million | 73% |
| UK | 42 million | 57% |
| France | 35 million | 49% |
| Canada | 20 million | 51% |
Source: GSMA
The Future of Mobile Device Internet Usage
Mobile phone subscriptions have risen year-over-year since 1993 (from only 34 million in 1993 to 8.648 billion today).
Despite growing at a slower rate in recent years, mobile phone subscriptions are still on the rise.
Here’s a look at the major milestones of worldwide mobile subscriptions over the last 30 years:
| Mobile Subscriber Milestone | Year |
| 100 million | 1996 |
| 500 million | 2000 |
| 1 billion | 2002 |
| 2 billion | 2005 |
| 3 billion | 2007 |
| 4 billion | 2008 |
| 5 billion | 2010 |
| 6 billion | 2012 |
| 7 billion | 2015 |
| 8 billion | 2019 |
There are 5.56 billion active internet users. And 96.3% of internet users use a mobile to access it.
According to GWI, of all connected adults, 97.3% use at least one form of social media each month. That accounts for 5.24 billion active social media users. Not surprisingly, this is leading to people spending more time on their phones than ever before.
As both internet use and social media use grow, it only stands to reason that mobile internet traffic will follow suit.
Sources: ITU, DataReportal
Key Takeaways
That wraps up our look at the current state of global mobile internet traffic.
Developing nations are helping push the surge in mobile internet use.
And countries with established mobile phone usage are continuing to close in on near-ubiquitous mobile internet use. If you found this report valuable, you may also want to check out our recent outlook on the top cloud computing trends over the next few years. Or, more focused on the world of mobile devices, a list of emerging app development trends.
Stop Guessing, Start Growing 🚀
Use real-time topic data to create content that resonates and brings results.

Exploding Topics is owned by Semrush. Our mission is to provide accurate data and expert insights on emerging trends. Unless otherwise noted, this page’s content was written by either an employee or a paid contractor of Semrush Inc.
Share
Newsletter Signup
By clicking “Subscribe” you agree to Semrush Privacy Policy and consent to Semrush using your contact data for newsletter purposes
Written By


Fabio is a research associate at Exploding Topics. Since 2021, Fabio has researched, written, and edited articles for the Explo... Read more