


Get Advanced Insights on Any Topic
Discover Trends 12+ Months Before Everyone Else
How We Find Trends Before They Take Off
Exploding Topics’ advanced algorithm monitors millions of unstructured data points to spot trends early on.

Keyword Research
Performance Tracking
Competitor Intelligence
Fix Your Site’s SEO Issues in 30 Seconds
Find technical issues blocking search visibility. Get prioritized, actionable fixes in seconds.
Powered by data from
Latest Blog Posts
Featured Case Studies
See what's trending before everyone else
Each week, we'll send you our best Exploding Topics. Plus, expert insight and analysis.
73+ Brand New Ecommerce Statistics for 2026

Online shopping isn’t exactly new, but it’s still hot and growing at a staggering rate.
Ecommerce companies generate trillions of dollars in sales every year — everyone from Amazon-sized giants to the fastest-growing startups launching their first storefront. The ecommerce ecosystem is made up of buyers, sellers, resellers, marketers, influencers — and, increasingly, AI shopping agents — all contributing to an industry that looks to become the default method of shopping in the near future.
Just how big is the ecommerce industry? Here’s one way to put it into perspective:
If you evenly distributed a year’s worth of global ecommerce sales to every human on the planet, you’d give each person approximately $839.
Ready to learn more about ecommerce? Here are the latest stats on this exploding industry.
Top Ecommerce Stats
Before diving into the full list of stats, here are the top ecommerce stats for 2026:
- Global ecommerce retail sales are projected to hit $6.88 trillion in 2026
- Amazon set sales records on its first-ever four-day Prime Day in 2025
- 2.77 billion people — roughly 1 in 3 humans on Earth — now shop online
- 58% of US shoppers have bought a product after seeing it on social media
- China is home to over half of all global online transactions
- 75% of consumers avoid brands they believe mishandle their personal data
- AI is the fastest-growing referral channel in ecommerce — AI-driven retail traffic jumped 393% year over year in Q1 2026
Global Ecommerce Statistics
How much money does ecommerce generate globally? And which countries have the largest markets? Here are the latest worldwide ecommerce numbers:
Global ecommerce retail sales are projected to hit $6.88 trillion in 2026 (eMarketer)
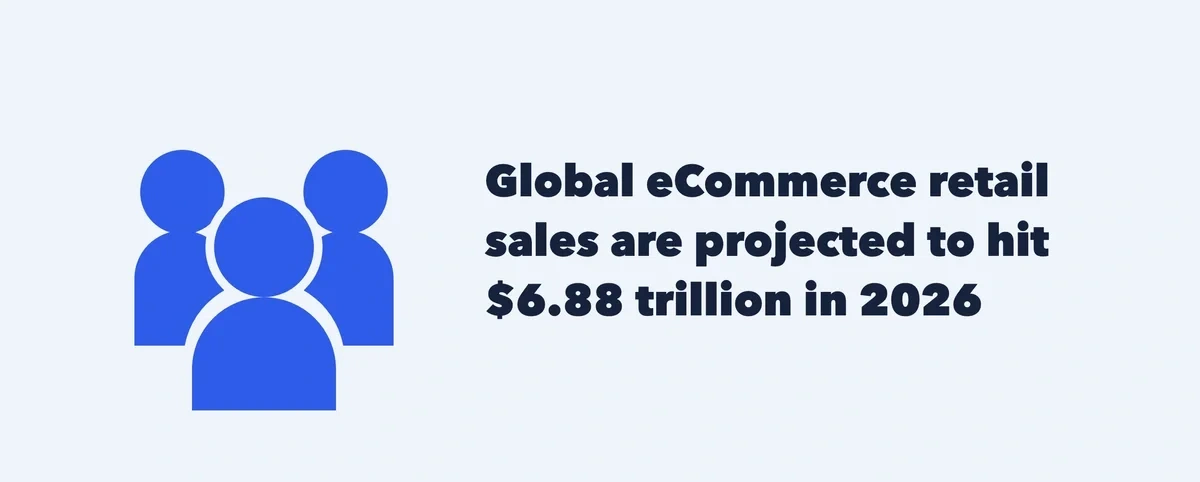
If the ecommerce space reaches the forecast figure of $6.88 trillion in annual sales, it would mean a 64% increase over 2020’s ecommerce retail sales of $4.2 trillion — with growth continuing toward $8 trillion in the years ahead. As sales increase, so does ecommerce’s share of total retail sales.
Ecommerce now accounts for roughly 21% of all retail sales worldwide, a share projected to keep climbing toward 22.5% by 2028.
2.77 billion people shop online — about 1 in 3 humans on Earth (Capital One Shopping)
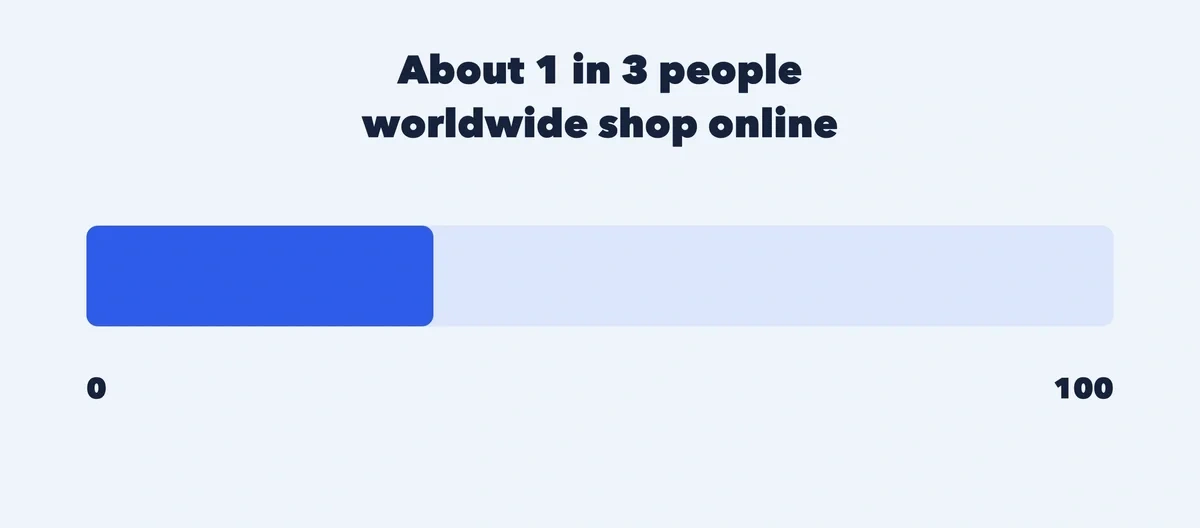
That share grows every year as more of the world comes online. Online shopping skews highest in regions like Latin America, where about 77% of adults shop online — nearly 38% above the global average.
Argentina and Turkey are among the fastest-growing ecommerce markets in the world (Statista)
Emerging markets like Argentina and Turkey are forecast to post some of the highest double-digit ecommerce growth rates in the world. Zoom out and Southeast Asia is the fastest-growing region, on a path to roughly $230 billion in GMV, while India is the fastest-growing major established market. (Cross-checking these forecasts against Statista alternatives is a smart move before betting on any one market.)
China is home to over half of global ecommerce sales (MobiLoud)
China remains the single largest ecommerce market on the planet, accounting for more than half of all global online transactions. The United States sits in a distant second place, making China’s lead one of the most lopsided in the entire industry.
WooCommerce powers the most stores, but Shopify rules the high-revenue end (MobiLoud)
It depends how you count. By raw store count, WooCommerce leads with about 33% of all ecommerce stores. But Shopify dominates where the money is — it powers 28.8% of the top 1 million ecommerce sites and drove roughly $292 billion in GMV. Picking the right platform is only half the battle, though; brands also need to win search, which is where running your store through an SEO checker pays off.
BNPL transaction value is set to top $560 billion in 2026 (Statista)
Buy Now, Pay Later keeps climbing — global BNPL transaction volume is projected to surpass $560 billion in 2026, up from roughly $120 billion in 2021. Companies like Klarna, Affirm, and OpenPay help enable ecommerce brands looking to offer flexible payment options at checkout.
Can You Rank For This Keyword?
Analyze keyword difficulty and find ranking opportunities – fast and easy.
Amazon Ecommerce Statistics
Amazon is such a major player in the ecommerce world that it deserves its own section. Here’s how Amazon influences the ecommerce market.
Amazon averages well over 2 billion global visits every month (SimilarWeb)

The leading ecommerce company attracts an enormous amount of web traffic each month — in the range of 2.3 to 2.7 billion visits, with traffic spiking sharply around Prime Day and the holidays. The United States accounts for the largest share of that traffic, with India, Canada, the UK, and Japan rounding out the top five.
Amazon set sales records on its first four-day Prime Day in 2025 (Amazon)
For the first time, Amazon stretched Prime Day to four days (July 8–11, 2025), and it drove record sales and a record number of items sold. Amazon didn’t share exact figures, but US shoppers spent an estimated $24.1 billion online across the four-day event, according to Adobe. Independent sellers — mostly small and medium-sized businesses — also notched record sales.
Amazon gets more ecommerce visits than any other store in the world (SimilarWeb)
It’s not surprising that Amazon gets the most visits among ecommerce stores, but its dominance shouldn’t be overlooked. Amazon attracts several times more traffic than rivals like eBay and AliExpress, keeping it firmly at the top of the global retail-traffic rankings.
63% of shoppers prefer buying on marketplaces like Amazon over brand websites (ChannelEngine)
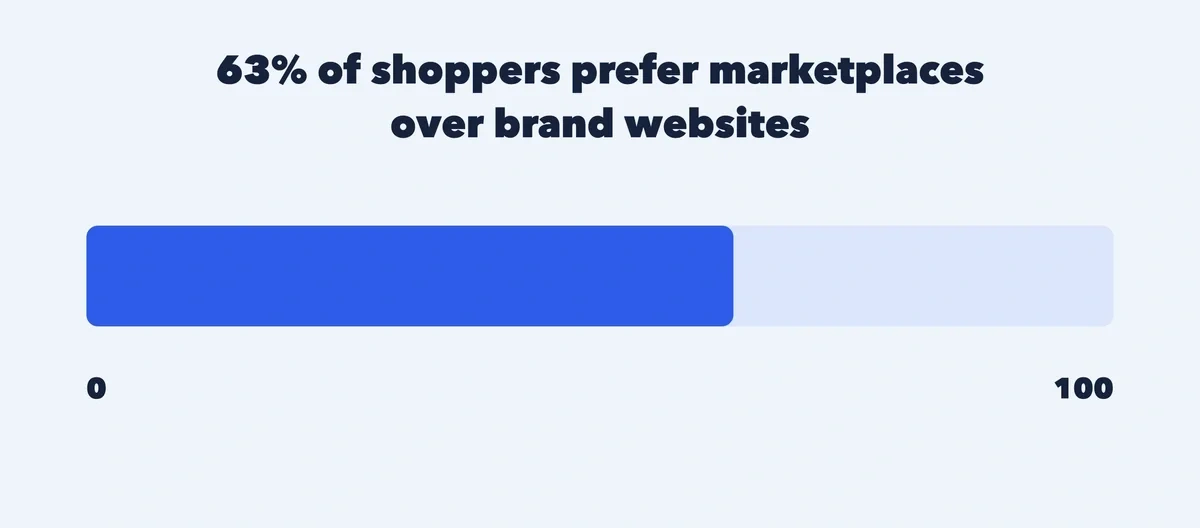
When ChannelEngine surveyed 4,500 shoppers across five countries for its 2025 Marketplace Shopping Behavior Report, 63% said they’d rather buy on a marketplace than a brand-owned site — and 47% now start product discovery on marketplaces instead of a search engine. Amazon is the gravitational center of that behavior.
Third-party sellers account for 61% of all units sold on Amazon (Capital One Shopping)
61% of everything sold on Amazon in 2025 came from independent third-party sellers — not Amazon’s own retail arm. Independent businesses now drive the majority of the marketplace, even as a small core of top sellers captures an outsized share of sales.
“Online arbitrage” — a popular tactic among third-party sellers — is still a trending topic on Google.
Social Media Ecommerce Statistics
The intersection of social media and ecommerce is called social commerce. Here’s a look at the impact social commerce has today.
58% of US shoppers have bought a product after seeing it on social media (SellersCommerce)
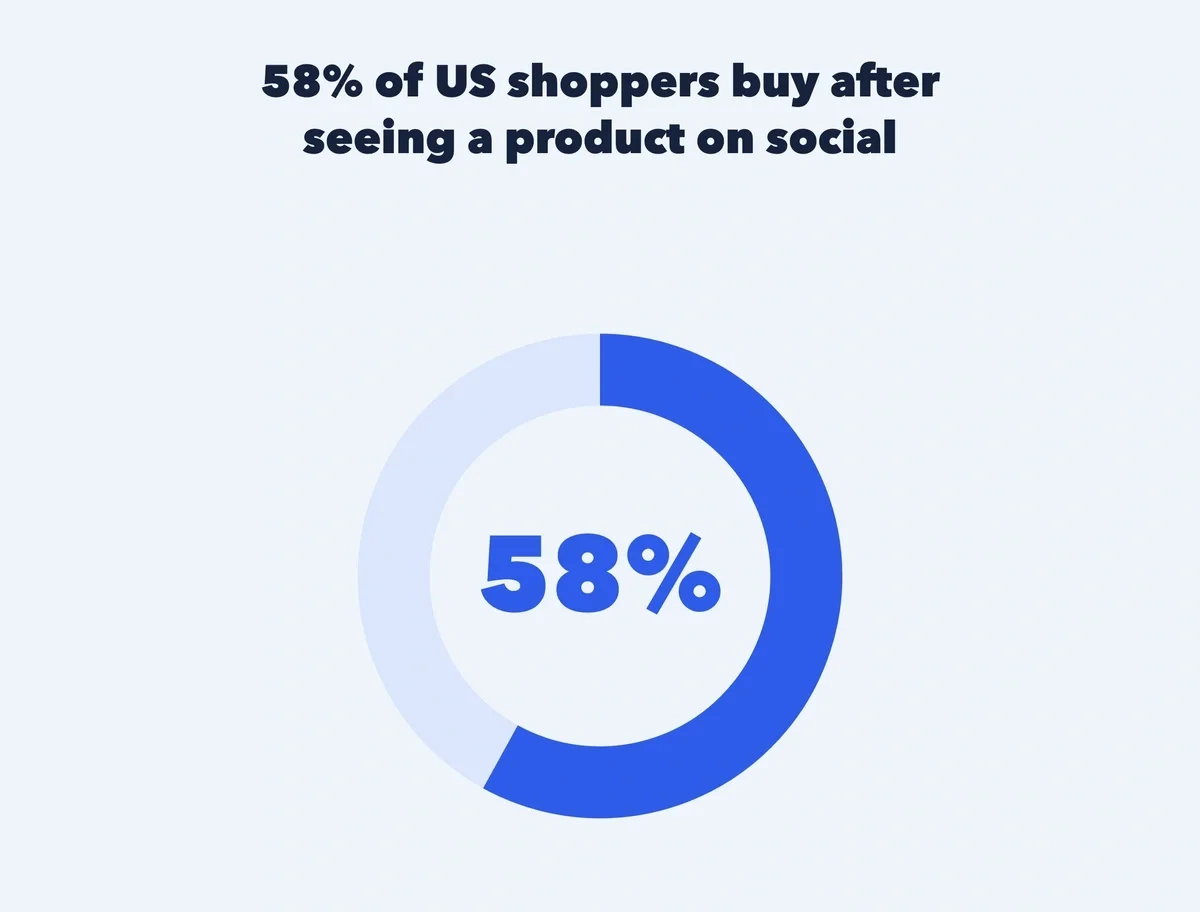
Social shopping is now mainstream: well over half of US shoppers have purchased something after discovering it on social. There are an estimated 117.1 million social-media buyers in the US — about 1 in 3 Americans.
US social commerce sales will top $100 billion for the first time in 2026 (eMarketer)
US social commerce sales are set to surpass $100 billion in 2026 — an 18% year-over-year jump. Globally, social commerce is forecast to make up roughly 22.4% of all ecommerce transactions, up from 17% a year earlier.
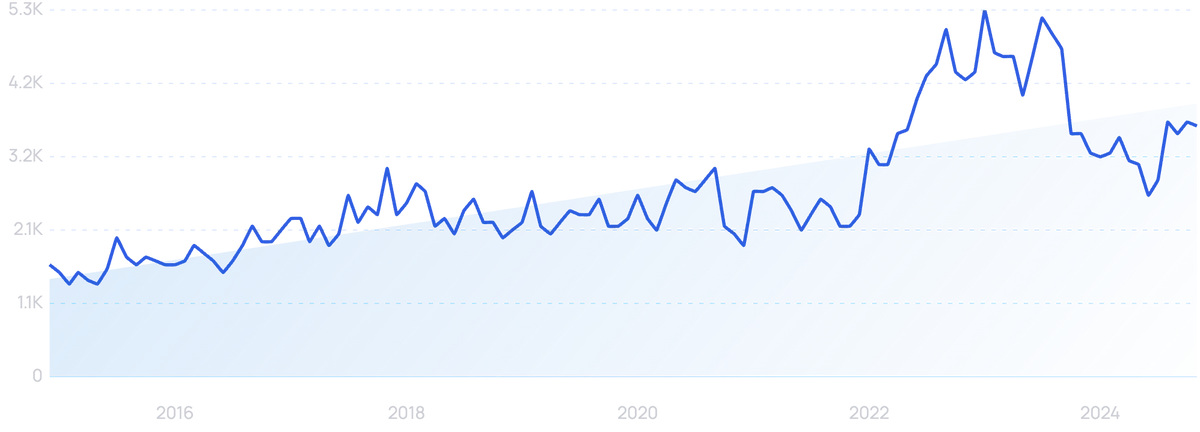
TikTok Shop booked $15.82 billion in US sales in 2025 (SQ Magazine)
TikTok has gone from social-video app to social-commerce juggernaut. TikTok Shop captured 18.2% of all US social commerce with $15.82 billion in sales in 2025, and that’s projected to reach $23.41 billion in 2026 — a 48% year-over-year increase. In China, livestream-driven social shopping on platforms like Douyin remains the dominant model.
Explosive Growth: Google searches for “TikTok shopping” over the past 5 years.
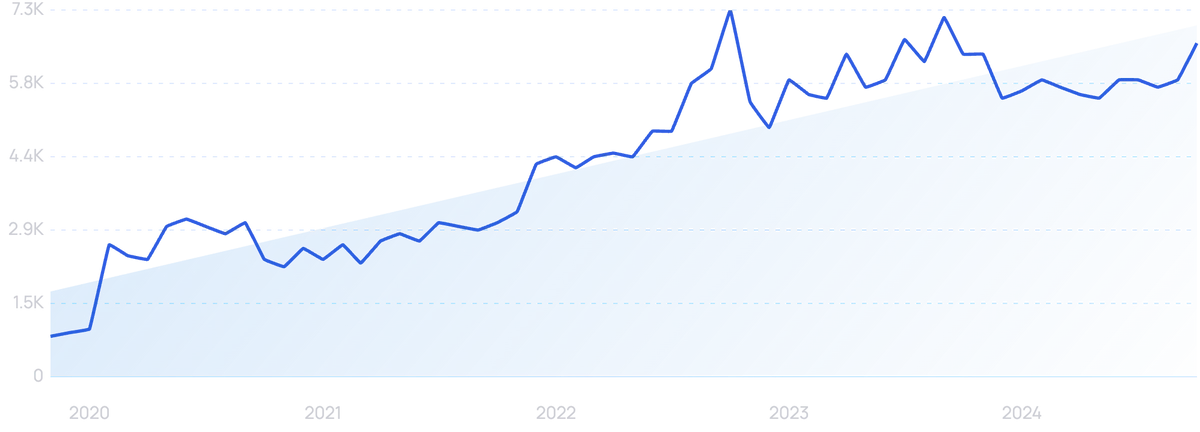
Want to validate a trend like this beyond search? Try one of these Google Trends alternatives.
Apparel is the most popular social ecommerce category among American shoppers (Statista)
When asked which product type they bought most often on social media, about 26% of US shoppers said apparel — the single most popular category. Beauty products (around 19%) and home goods (around 14%) follow, with electronics and food and beverage rounding out the top five.
Mobile Ecommerce Statistics
The trends tell us that people are spending more of their online time on mobile devices. Ecommerce companies are responding by giving shoppers more ways to buy from their smartphones.
Mobile commerce will account for nearly 60% of global online sales in 2026 (DemandSage)
Mobile is now the default way the world shops online. Global m-commerce is projected to reach roughly $2.88 trillion in 2026 — about 60% of all online retail sales. That figure is on track to reach $3.35 trillion by 2028.
Around 45% of all US ecommerce sales come from mobile (DemandSage)
Mobile keeps grabbing a bigger slice of the ecommerce pie each year. In 2019, just 36.9% of US ecommerce sales came from mobile devices. In 2026, that share sits around 44.6% and is projected to cross 50% within a couple of years.
How can ecommerce brands develop their mobile presence? By building an app with partners like Tapcart — and by surfacing the products people are actually searching for, which you can uncover with an ecommerce keyword tool.
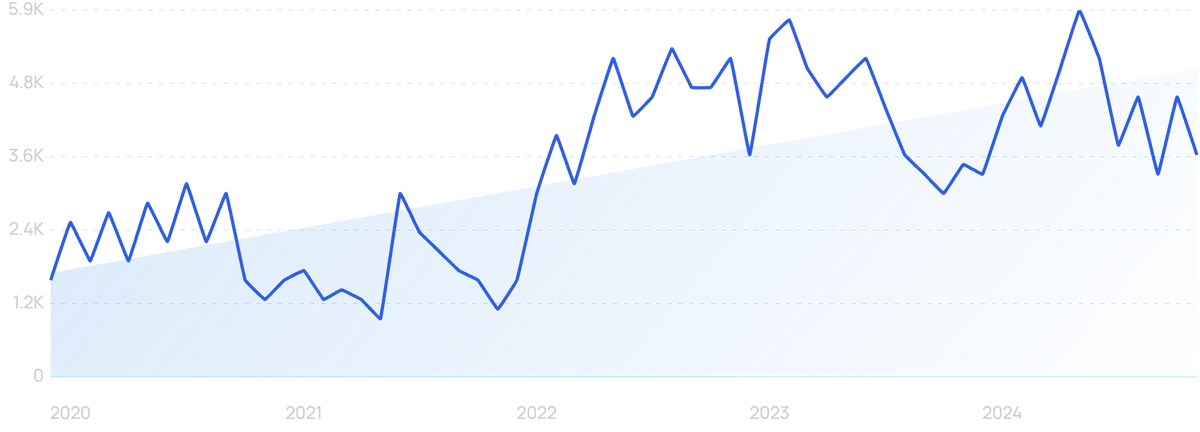
Google searches for “tapcart” over the past 5 years.
Mobile still converts at roughly half the rate of desktop (SQ Magazine)
Despite mobile’s growing share of ecommerce sales, the channel still lags on conversion. As of 2026, desktop converts at around 3.9% versus about 1.8% on mobile — a reminder that a fast, frictionless mobile checkout is still where a lot of money leaks out. (The gap is narrowing, though, as express payments and faster mobile pages catch on.)
Get More Search Traffic
Use trending keywords to create content your audience craves.
AI & Agentic Commerce Statistics
The biggest shift in ecommerce since mobile is happening right now: shoppers are starting their journeys inside AI assistants, and “agentic” tools are beginning to browse and buy on their behalf. Here’s where things stand.
AI-driven retail traffic jumped 393% year over year in Q1 2026 (Adobe)
AI referrals are still a small slice of total ecommerce traffic — under 0.2% — but they’re growing faster than any other channel, nearly quadrupling year over year. The catch for brands: an estimated 70% of AI referrals get misattributed as “direct” traffic in standard analytics setups, so the real impact is likely larger than it looks.
AI-referred shoppers convert 42% better than other traffic (Adobe)
It’s not just volume — it’s quality. By early 2026, Adobe found AI-referred visitors converting 42% better, with revenue per visit running about 37% higher than non-AI traffic. AI-sourced shoppers also spend roughly 48% more time on the page and browse 13% more pages per visit.
AI traffic to US retailers surged 805% year over year on Black Friday 2025 (Adobe)
The holidays supercharged the trend — AI-driven traffic to US retail sites jumped 805% year over year on Black Friday 2025. With momentum like that, brands now need to think about whether AI assistants even recommend them in the first place. You can see how visible your brand is to tools like ChatGPT with an AI visibility checker.
38% of US consumers have already used generative AI to shop online (Adobe)
Shoppers aren’t just curious about AI — they’re using it. 38% of US consumers have used generative AI for online shopping, and another 52% say they plan to. In fact, 73% now cite AI as a primary source for product research, putting it on par with traditional search.
A third of shoppers expect at least 10% of their purchases to be AI-driven within a year (Checkout.com)
Agentic shopping — where the AI actually places the order — is moving from concept to reality. In Checkout.com’s Agentic Commerce 2026 survey, 33% of consumers expect at least 10% of their purchases to be AI-driven within a year. Trust is still the gating factor, though: 24% say they’ll never hand purchasing decisions to an AI, and 27% don’t trust any company to run a shopping agent on their behalf.
Ecommerce Challenges
There’s no question that the ecommerce industry is booming. But staying competitive in a crowded industry means overcoming multiple challenges. Here are some obstacles facing today’s ecommerce brands.
The average shopping cart abandonment rate is just over 70% (Baymard)
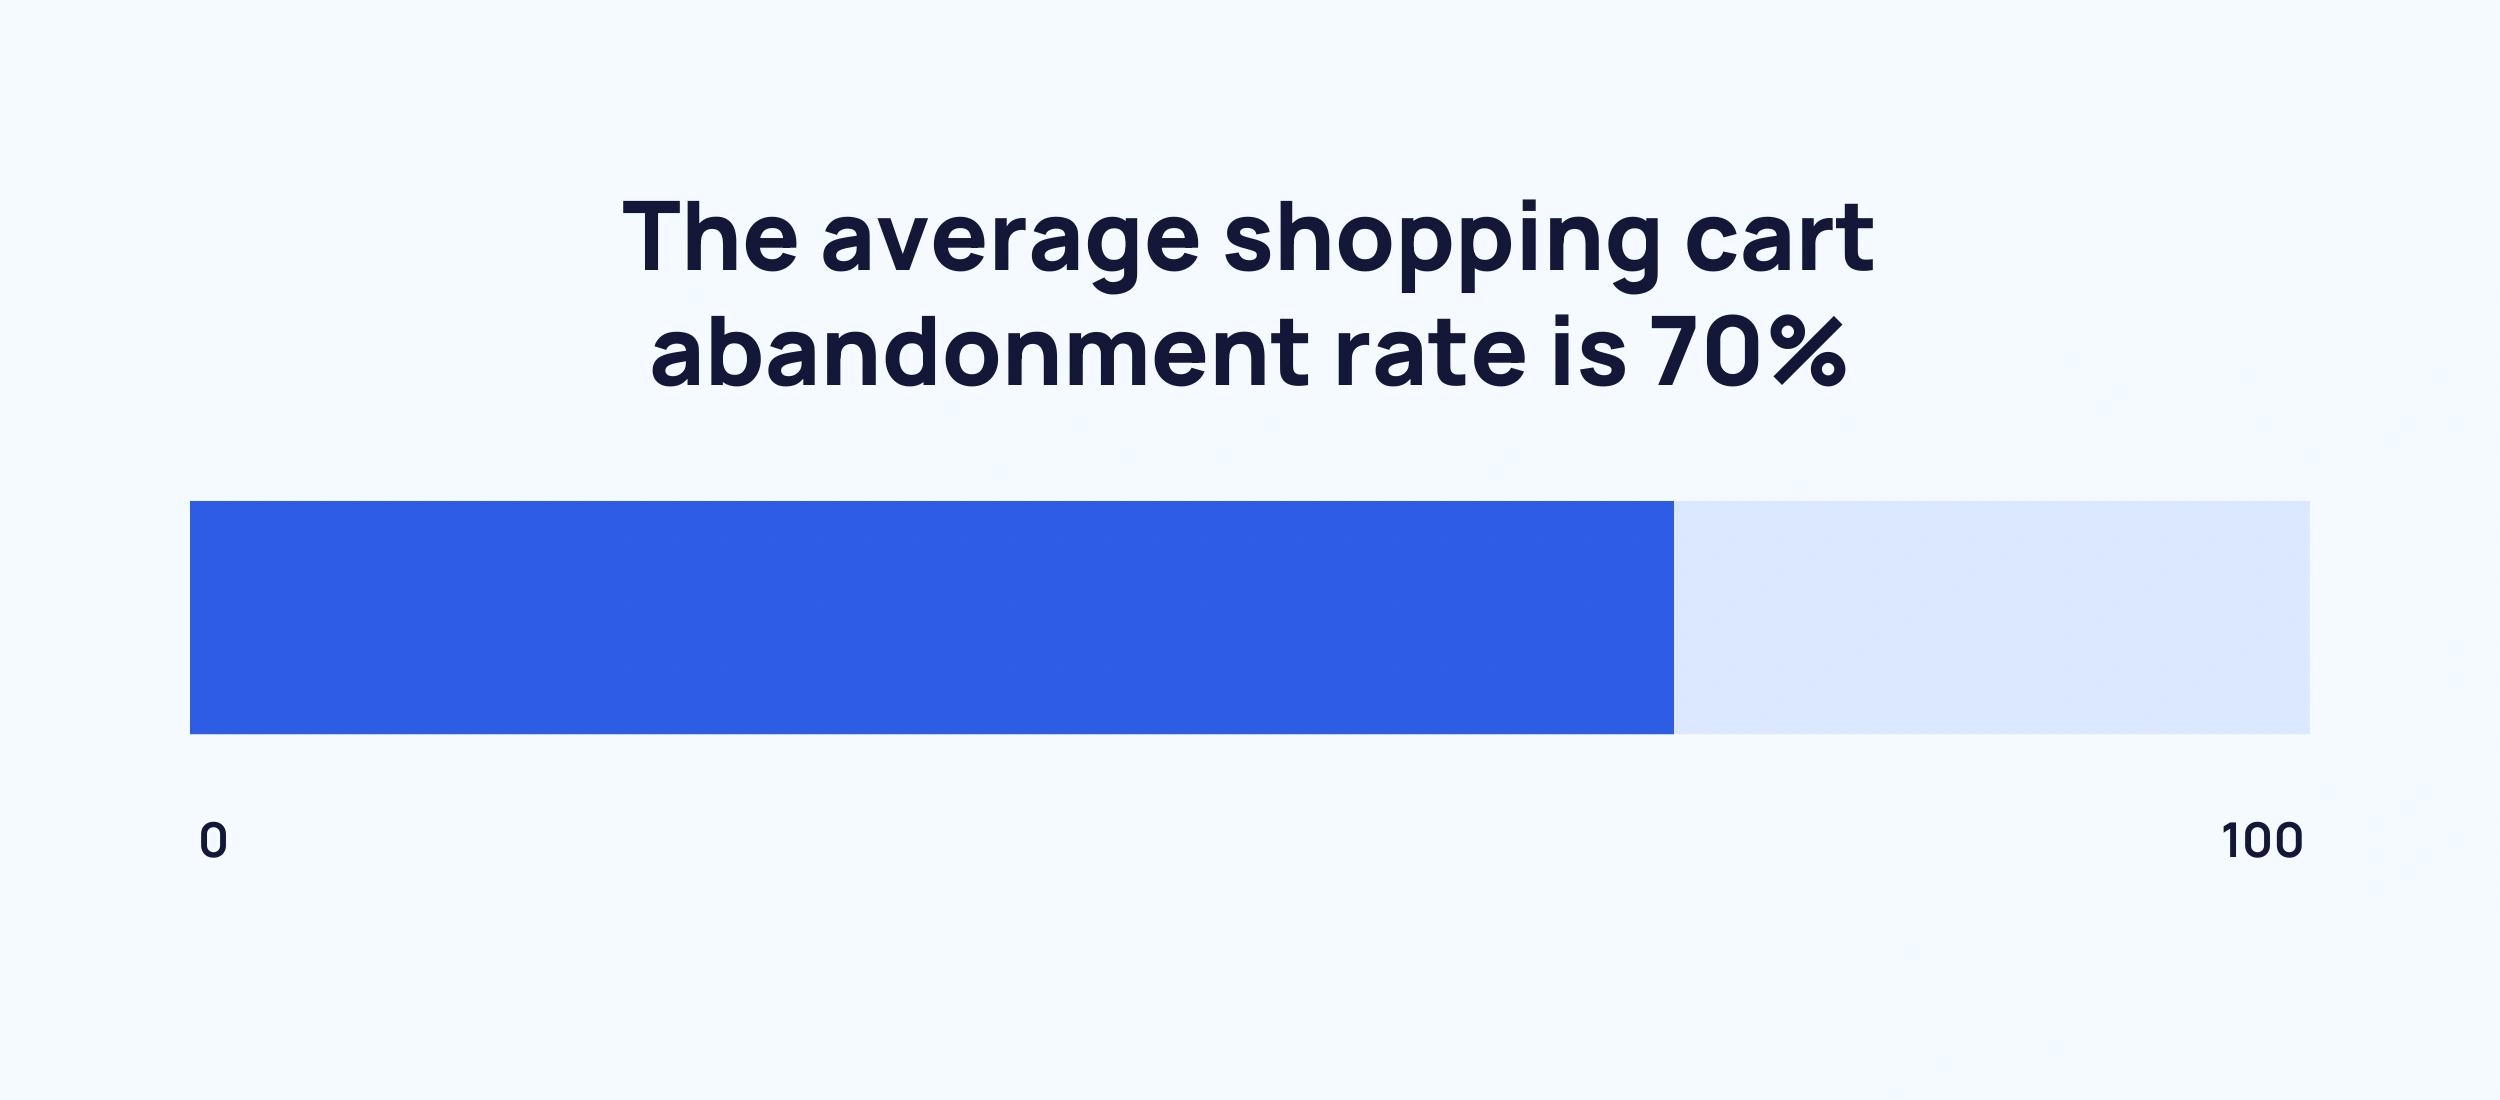
Baymard’s average cart abandonment rate sits at 70.22% — an average across 50 separate studies, and a figure that’s stayed remarkably stable for a decade. The single biggest reason shoppers bail is unexpected extra costs like shipping, taxes, and added fees. Other common culprits: being forced to create an account, slow delivery times, and not trusting the site with payment information.
75% of consumers avoid brands they believe mishandle their data (SQ Magazine)
Data privacy is top-of-mind for today’s digital consumer. Around 75% of shoppers steer clear of companies they believe misuse personal data, and 47% have switched companies outright over poor data practices. On top of that, 86% say privacy matters to them and they want more control over their information.
76% of shoppers get frustrated by impersonal shopping experiences (DemandSage)
Personalization has gone from nice-to-have to baseline expectation. 76% of shoppers are frustrated by impersonal interactions, and 71% will walk away from a purchase that doesn’t feel relevant. Get it right and the payoff is real — McKinsey estimates a strong personalization program can drive up to 40% more revenue. The catch is the “creepy line”: leaning too hard on personal data backfires as privacy concerns rise.
Around 3.2% of online revenue is lost to payment fraud (Capital One Shopping)
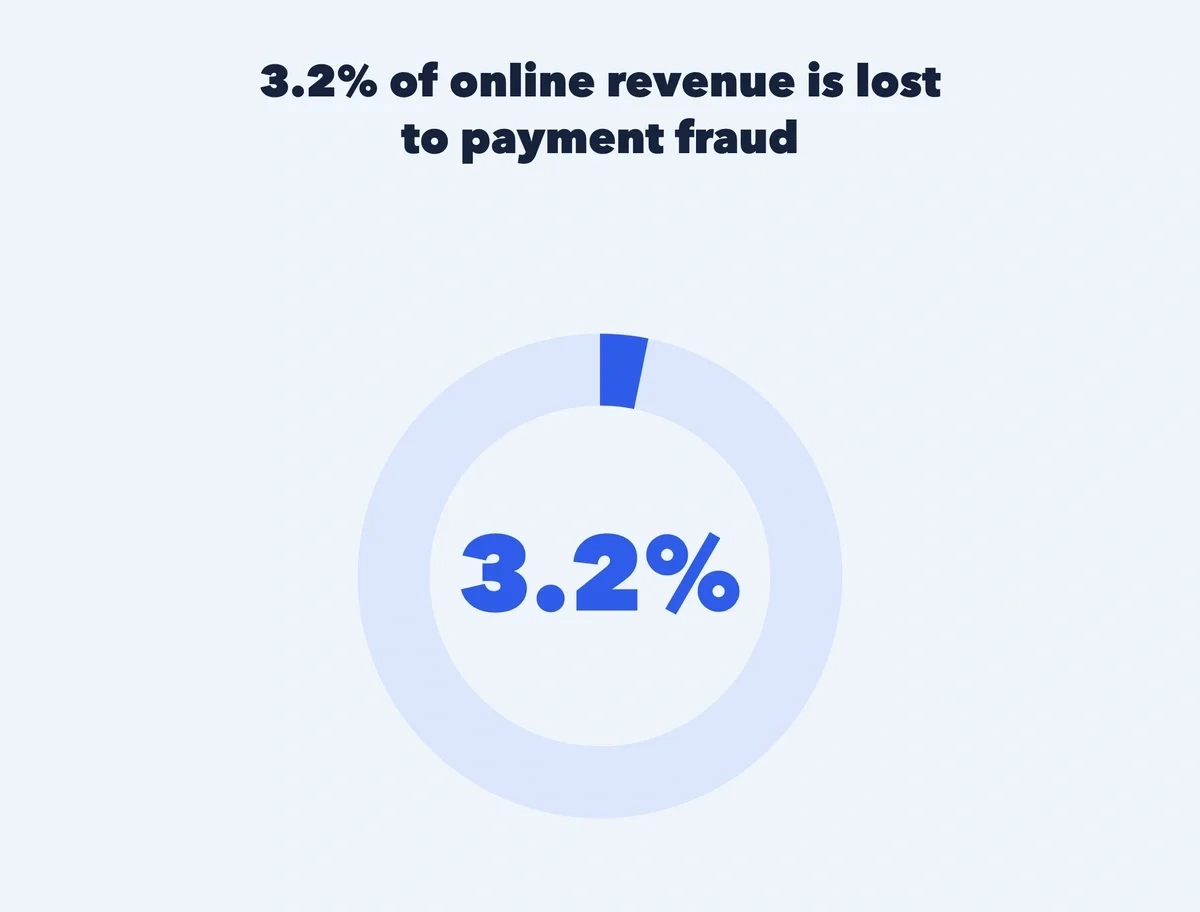
Credit card fraud, chargebacks, and other scams remain rampant — and the problem is growing. Global retailers lost about 3.2% of their online revenue to payment fraud, and the total global cost of ecommerce fraud is projected to reach $138.56 billion in 2025. It’s a tax on growth that hits cross-border sellers hardest.
Key Takeaways
Ecommerce is a multi-trillion-dollar industry that gives shoppers access to an almost infinite number of products and services.
While Amazon is still the global leader, brands are finding new ways to reach shoppers directly — through mobile apps, social commerce, and now AI assistants that recommend and even purchase products on a buyer’s behalf.
All the projections point to one thing: ecommerce will continue to grow and prosper, and it could be the default avenue for shopping in less than a decade.
Stop Guessing, Start Growing 🚀
Use real-time topic data to create content that resonates and brings results.

Exploding Topics is owned by Semrush. Our mission is to provide accurate data and expert insights on emerging trends. Unless otherwise noted, this page’s content was written by either an employee or a paid contractor of Semrush Inc.
Share
Newsletter Signup
By clicking “Subscribe” you agree to Semrush Privacy Policy and consent to Semrush using your contact data for newsletter purposes
Written By


Josh is the Co-Founder and CTO of Exploding Topics. Josh has led Exploding Topics product development from the first line of co... Read more