


Get Advanced Insights on Any Topic
Discover Trends 12+ Months Before Everyone Else
How We Find Trends Before They Take Off
Exploding Topics’ advanced algorithm monitors millions of unstructured data points to spot trends early on.

Keyword Research
Performance Tracking
Competitor Intelligence
Fix Your Site’s SEO Issues in 30 Seconds
Find technical issues blocking search visibility. Get prioritized, actionable fixes in seconds.
Powered by data from
Latest Blog Posts
Featured Case Studies
See what's trending before everyone else
Each week, we'll send you our best Exploding Topics. Plus, expert insight and analysis.
21+ Brand New Graphic Design Statistics (2025)

Today’s businesses can’t exist without graphic design.
Behind every company logo, website, product label, and visual advertisement are graphic designers. They combine artistic talent with graphic software expertise to create images that drive engagement and sales.
So what does the world of graphic design look like from a numbers perspective?
Top Graphic Design Statistics
Before you dive into the detailed list of statistics, here’s a quick overview of the most eye-opening stats:
- The global graphic design market size is valued at over $60 billion
- The US graphic design market is worth over $16 billion
- Graphic designers in the US make an average of $31.01 per hour ($64,500 per year)
- Users spend more time looking at a website’s logo than any part of the page
- Original graphics are the most frequently used form of visual content
Graphic Design Industry Statistics
The graphic design industry is in a growth phase. As brands seek to expand their digital reach through websites, social media, and original visual content, they turn to graphic designers. Those designers use various graphic software to create brand graphics.
Here’s how the industry is shaping up in 2024.
The global graphic design market is worth over $60 billion (NMSC)

The global graphic design market grew from $35.7 billion in 2013 to $44.3 billion in 2019. In 2020, the market took a hit and dropped to $39.8 billion. It’s since recovered, growing to $48.1 billion in 2022.
Get More Search Traffic
Use trending keywords to create content your audience craves.
The North American graphic design market is worth over $19.65 billion (Cognitive Market Research)
The graphic design market has achieved healthy growth in North America, and according to Cognitive Market Research, currently has a market share of 40%.
The North American graphic design industry is growing at a CAGR of 1.6% through 2031.
Adobe products command over 80% of the graphic design software market (Statista)
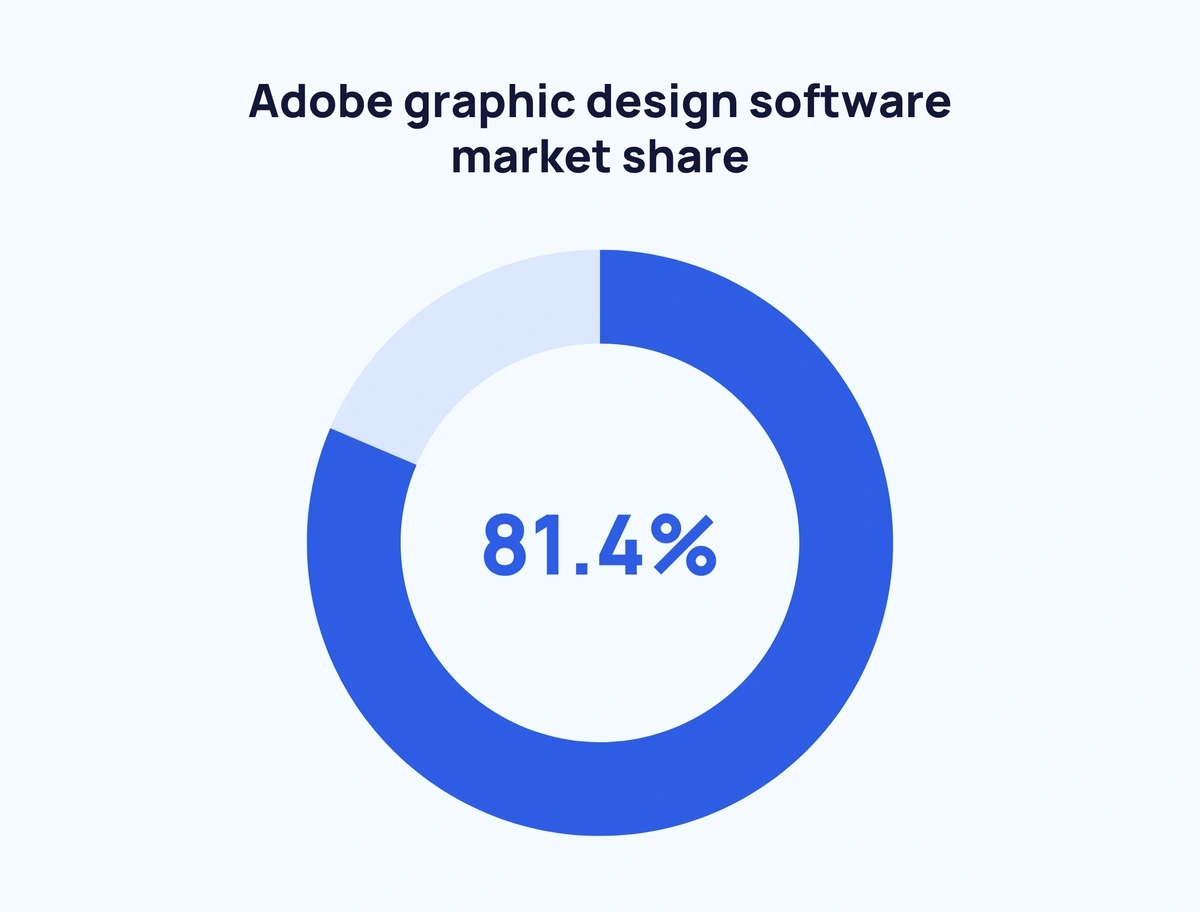
Adobe is the industry standard for developing graphic design software.
Adobe Photoshop alone has a 41.74% market share in graphic design software. That’s followed by Adobe InDesign (26.13%) and Adobe Illustrator (12.25%).
Adobe Lightroom has an additional 1.32% market share.
Adobe solidified their dominance in the space by acquiring Figma in 2022.
19% of businesses spend more than $10,000 per year on graphic design (Piktochart)
Companies’ graphic design budgets can range from under $1,000 to $10,000 or more. Here is a breakdown of how businesses budget annually for graphic design:
- 17% spend less than $1,000
- 32% spend between $1,000 and $5,000
- 32% spend between $5,000 and $10,000
- 19% spend more than $10,000
Piktochart’s survey of more than 1,000 businesses found that software companies have the highest graphic design budgets.
Graphic Design Career Statistics
There are over a quarter million graphic designers in the United States alone. In general terms, a career in graphic design can offer a comfortable salary. More specifically, salaries vary depending on location, experience, and industry.
Here’s a closer look:
Graphic designers in the US make an average of $31.11 per hour – that's $64,700 per year (US Bureau of Labor Statistics)
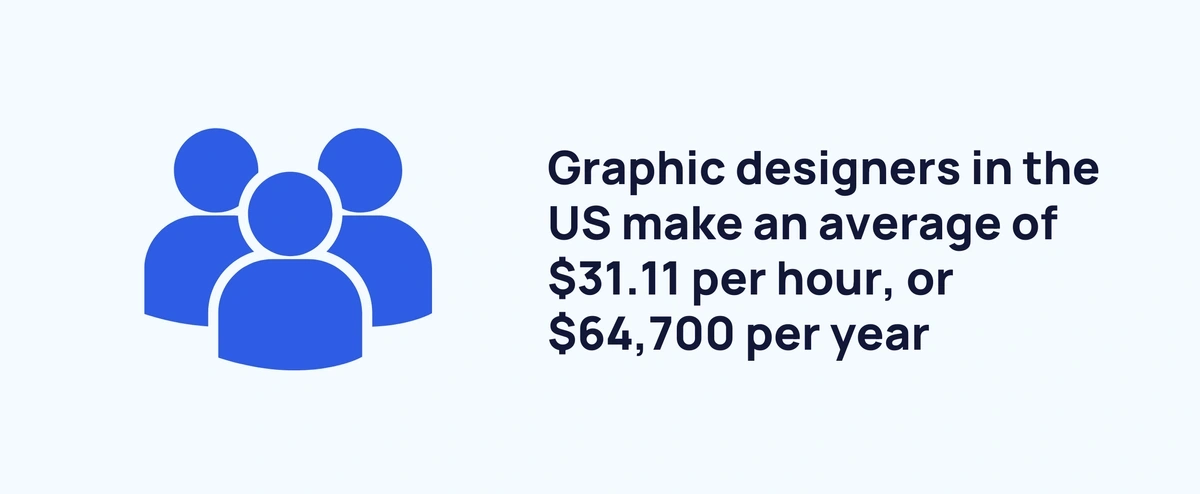
According to the BLS, there are 212,720 graphic designers working in the United States.
While US-based graphic designers earn an average of $64,700 per year, salaries can vary wildly. The bottom 10% of designers earned an average of $36,420, while the top 10% earned $100,450.
The US graphic designer job market is expected to grow slower than average over the next decade (US Bureau of Labor Statistics)
Between 2023 and 2033, the job market for graphic designers in the United States is expected to grow by just 2%.
Over that time, the industry is predicted to gain a net of 6,600 jobs.
Those numbers might worry job-seekers, but there’s some good news: BLS predicts around 21,000 job openings for graphic designers each year.
On average, freelance graphic designers earn $45,000 annually (Glassdoor)
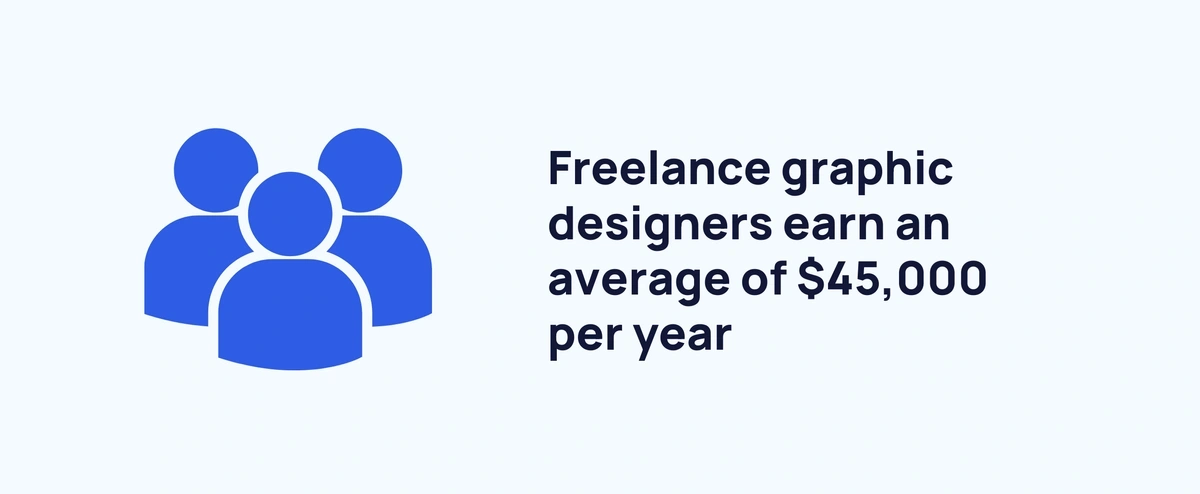
How much can a freelance graphic designer earn? According to Glassdoor, the average salary for a freelance designer is just over $45,000 – down from $57,000 a couple of years earlier.
However, average salaries vary based on industry and experience.
The American graphic design workforce is mostly female (DataUSA)
Approximately 142,620 (or 51.9%) of American graphic designers are women.
Despite their majority in the industry, women actually earn about 19% less than their male counterparts on average.
In 2022, the average male graphic design salary was $64,911 while the average female salary was $52,636.
The average American graphic designer is just over 38 years old (DataUSA)
The common age bracket for graphic designers in the US is 25 to 29 with just under 50,000 people falling into that range.
Not far behind is the 30 to 34 age range (44,000 graphic designers) and the 35 to 39 age bracket (38,000 graphic designers.
Almost half (48%) of all graphic designers are aged between 25 and 39.
Graphic designers with a bachelor’s degree tend to earn more (Noodle)
For those in the graphic design industry, earning a bachelor’s degree can open up new career opportunities. Here are some higher-paying positions getting a degree can unlock (with median annual salaries):
- User Experience Director ($129,250)
- Creative Director ($116,750)
- Interactive Art Director ($92,500)
- Art Director ($85,750)
- Creative Services Manager ($86,250)
Around 3 in 5 graphic designers have a bachelor’s degree (DataUSA)
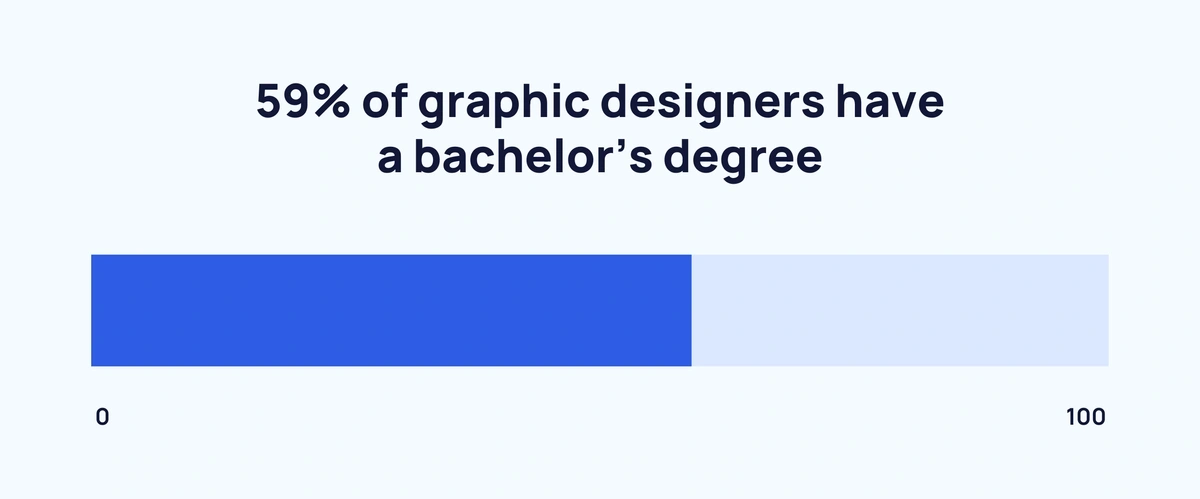
While earning a bachelor’s degree isn’t a requirement — 21% of graphic designers don’t have a degree at all — having a degree in a relevant field can help jump-start a career.
The most common 4-year degree held by graphic designers is in Visual & Performing Arts (38.9%). Other degrees frequently held by designers are Communications (5.8%), Business (4.5%), and Social Sciences (1.8%).
Statistics On The Importance of Graphic Design
How important is graphic design from a business perspective? Though budgets and execution vary, most businesses agree that graphic design is critical to success. Poor design choices can scare potential customers away in a matter of seconds.
However, a well-designed logo and website build immediate connection and trust with prospects.
The vast majority of users will reject a website based on poor design (ResearchGate)
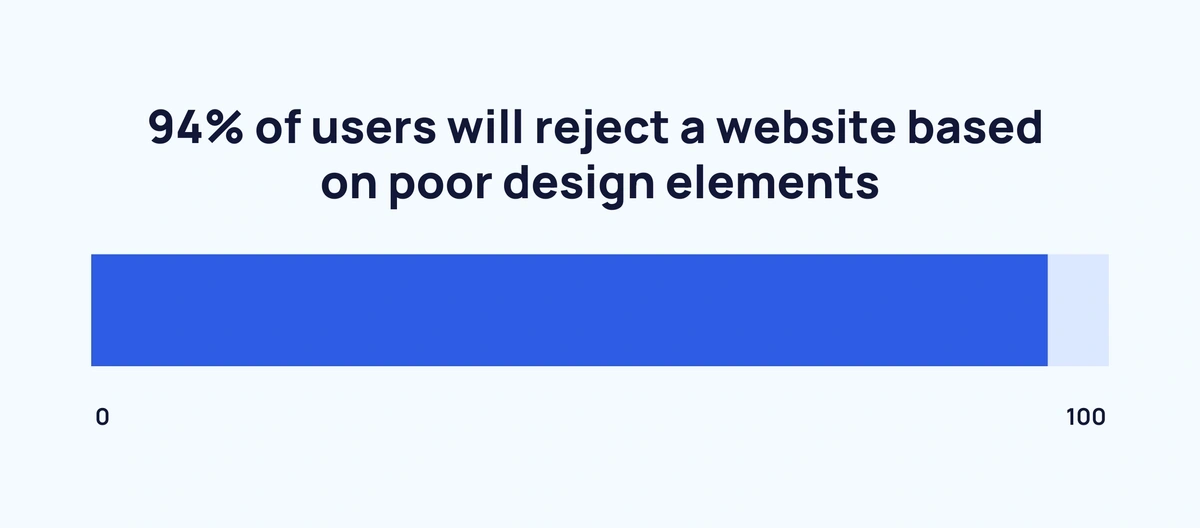
A classic 2004 psychology study found that poor website design is over 15x more likely to scare away users than poor content. Some design elements that turned off users were boring designs, uninspiring color choices, and overly-corporate aesthetics.
Users spend more time looking at a website’s logo than any part of the page (MST)
A Missouri S&T eye-tracking study illustrated just how important graphic design is to user experience. Users spent 6.48 seconds looking at a website’s logo before moving on—more than any other page element (including written content).
Blue is the most common color used in branding (99designs)

It’s well-known in psychology (and branding) that different colors evoke different emotions in audiences. Blue is often associated with stability, trust, and intelligence. It’s not surprising that blue is used by 57% of businesses in their visual branding. Green, white, and black are also commonly used for the positive feelings associated with them.
What colors should businesses avoid in their graphic design? According to men, purple is the color least associated with business success. For women, the worst color choice is orange.
4 out of 5 small business and startup founders believe design is important to success (99designs)
99designs asked 1,500 startup and business owners how important design is to the success of their business. 49% said design was “very important,” while an additional 31% said it was “moderately important.” Only 3% of respondents felt design wasn’t important at all.
Around 4 in 5 organizations use some form of graphic design (Piktochart)

4 out of 5 organizations rely on graphic design as part of their business strategy. What are those companies using graphic design for? The top 5 ways are social media graphics, presentations, videos, brochures, and posters.
Communication is the #1 reason businesses use graphic design (Piktochart)
Businesses can use graphic design to fulfill a variety of goals, but some are more common than others. The top 3 reasons organizations use graphic design are communicating with customers (55%), driving social media engagement (24%), and internal communications (19%).
Original graphics are the most frequently used form of visual content (Venngage)
36.4% of content marketers say they use original graphics more than any other type of visual content. There’s a good reason for that: when asked what type of visual content performed best, 41.1% of marketers said original graphics.
Stock photos are another popular option for content marketers, with 33.6% using them more than any other visual format. However, when it comes to performance, the difference between original graphics and stock photos is night and day. 41.1% of marketers say that stock photos are their worst-performing visual asset.
Around 1 in 5 marketers spend 20+ hours each week producing visual content (Venngage)
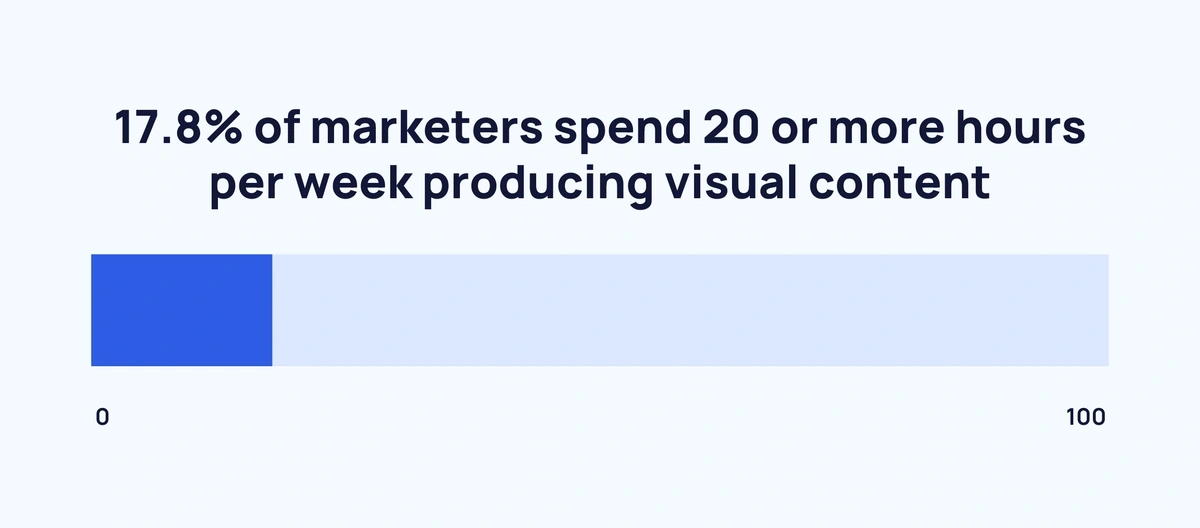
How much time do marketers spend per week producing visual content? Here’s a breakdown based on Venngage’s most recent visual content marketing survey:
- 17.8% spend 20 hours or more
- 14.9% spend between 10 and 15 hours
- 19.6% spend between 5 and 10 hours
- 24.3% spend between 2 and 5 hours
- 23.4% spend 2 hours or less
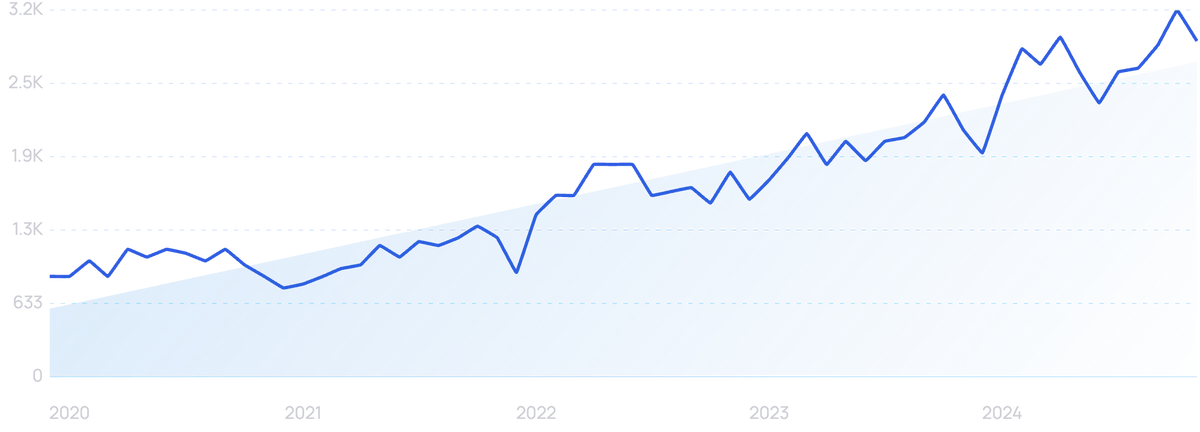
35.5% of content marketers use online tools to create graphics (Venngage)
Graphic design tools like Canva help teams collaborate on visual projects online. These online tools are actually the most popular way for marketers to produce visual content — more than in-house designers (28%), advanced design software (18.7%), and freelance outsourcing (17.8%).
Online searches for “Canva for enterprise” over the past 5 years.

Lengthy approval processes are the biggest challenge graphic design teams face (Piktochart)
Like any creative endeavor, graphic design projects have their share of challenges.
When asked about their top graphic design challenge, 34% of respondents mentioned approval processes that had too many steps. 24% said the entire graphic design process takes too long, while 15% said lack of collaboration within graphic design teams was the top challenge.
Consistency is the biggest challenge when creating engaging visual content (Venngage)
Engagement is a key metric in most marketing projects, and visual marketing is no exception. When asked what their top challenges were in creating engaging visual content, 31.8% of marketers said producing it consistently. Other top challenges are sourcing data and statistics (26.2%), finding the right layout (22.4%), and creating a great design (19.6%).
Interest and research into "user engagement" is up 235% from 5 years ago.
Key Takeaways
Graphic design is a cornerstone of modern business.
Brands need a striking visual element if they want to stay relevant and compete with other brands.
As long as brands continue to need content for their own websites, social media, and elsewhere, they’ll turn to graphic designers to get the job done.
Stop Guessing, Start Growing 🚀
Use real-time topic data to create content that resonates and brings results.

Exploding Topics is owned by Semrush. Our mission is to provide accurate data and expert insights on emerging trends. Unless otherwise noted, this page’s content was written by either an employee or a paid contractor of Semrush Inc.
Share
Newsletter Signup
By clicking “Subscribe” you agree to Semrush Privacy Policy and consent to Semrush using your contact data for newsletter purposes
Written By


Josh is the Co-Founder and CTO of Exploding Topics. Josh has led Exploding Topics product development from the first line of co... Read more