


Get Advanced Insights on Any Topic
Discover Trends 12+ Months Before Everyone Else
How We Find Trends Before They Take Off
Exploding Topics’ advanced algorithm monitors millions of unstructured data points to spot trends early on.

Keyword Research
Performance Tracking
Competitor Intelligence
Fix Your Site’s SEO Issues in 30 Seconds
Find technical issues blocking search visibility. Get prioritized, actionable fixes in seconds.
Powered by data from
Latest Blog Posts
Featured Case Studies
See what's trending before everyone else
Each week, we'll send you our best Exploding Topics. Plus, expert insight and analysis.
Top 9 Statista Alternatives & Competitors (2026)

Finding statistics to reference in your work can be a long process—one filled with digging through reports and tracking down original sources.
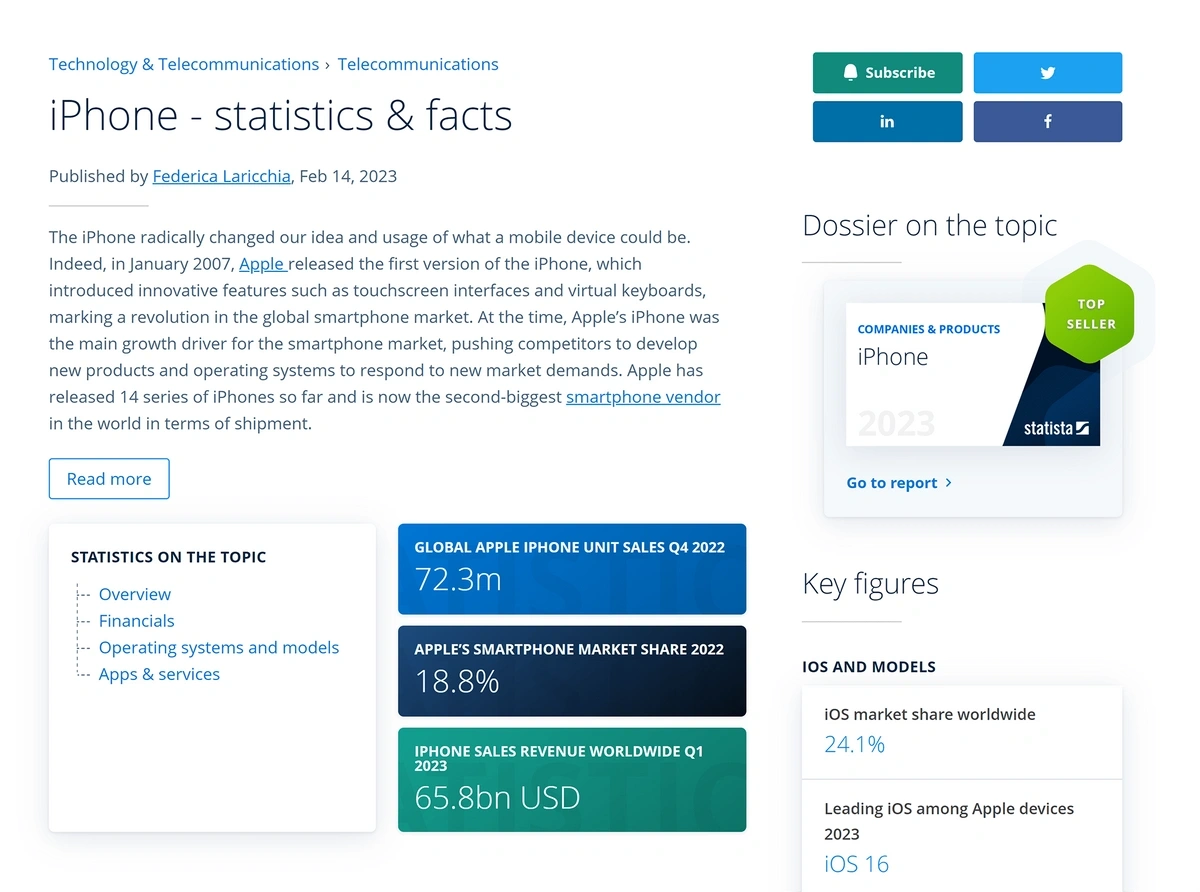
Statista is a searchable market and consumer data statistics portal that aims to make this process easier.
As of May 2026, Statista receives 6.5 million visits per month.
While some of the platform’s basic statistics are available to view for free, much of it lies behind a paywall. If you want to access the entire Statista database—including sources and graphics—you’ll have to subscribe to a paid plan, starting at $199 per month when billed annually.
But what if you want to get more insights about industry or market trends and future projections?
To access that information, you’ll need to either upgrade to a $649 per month (billed annually) Statista plan or pay for a single industry trend report (the cost of which can range into the hundreds of dollars).
Whether you’re interested in easier, more affordable access to that forward-looking trend data—or don’t love Statista’s interface—one of these top Statista competitors may be a better intelligence solution for your needs.
Want to Spy on Your Competition?
Explore competitors’ website traffic stats, discover growth points, and expand your market share.
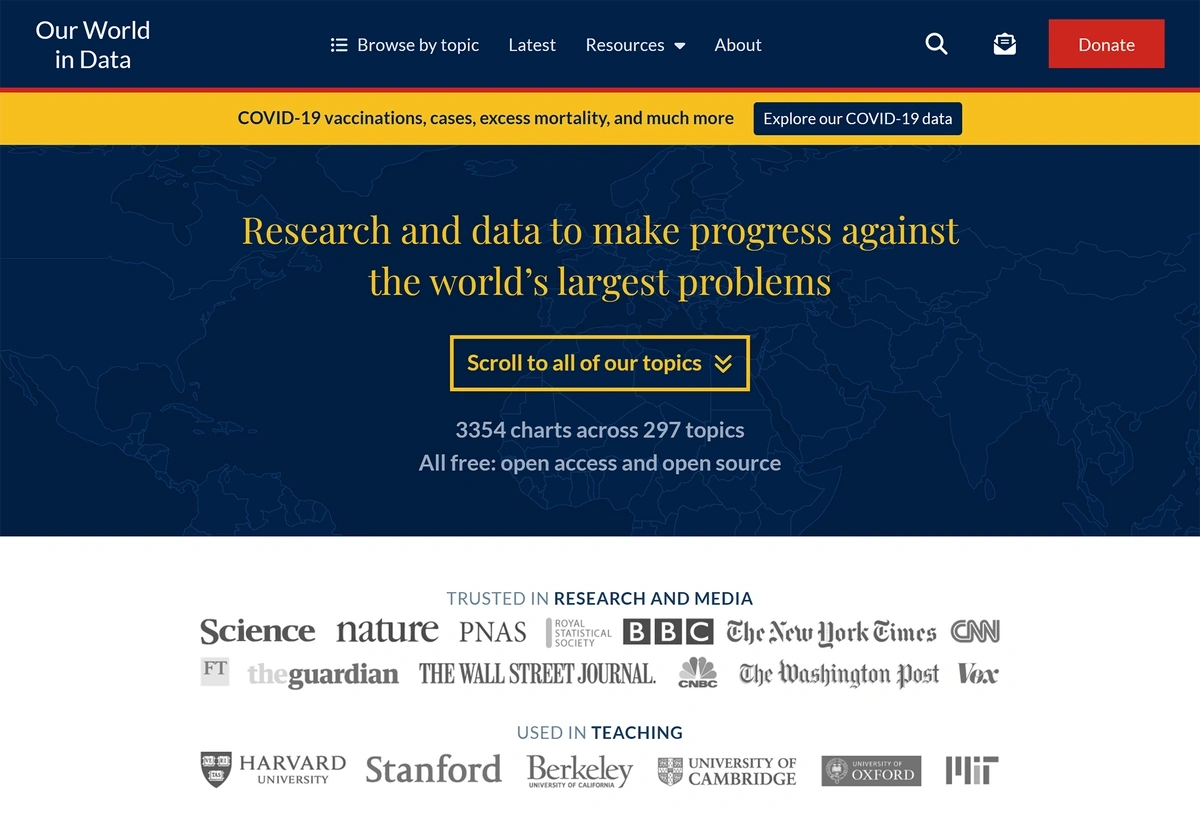
1. Our World in Data
Our World in Data is a collaborative research project between the University of Oxford and the Global Change Data Lab.
Its datasets are heavily focused on global socioeconomic issues and crises, including topics pertaining to:
- Health
- Food and agriculture
- Energy and environment
- Innovation and technological change
- Poverty and economic development
- Living conditions, community, and wellbeing
- Human rights and democracy
- Violence and war
- Education and knowledge
Our World in Data is typically used by journalists, researchers, students, academics, and anyone interested in its covered topics. Each topic covered by Our World in Data includes:
- A summary
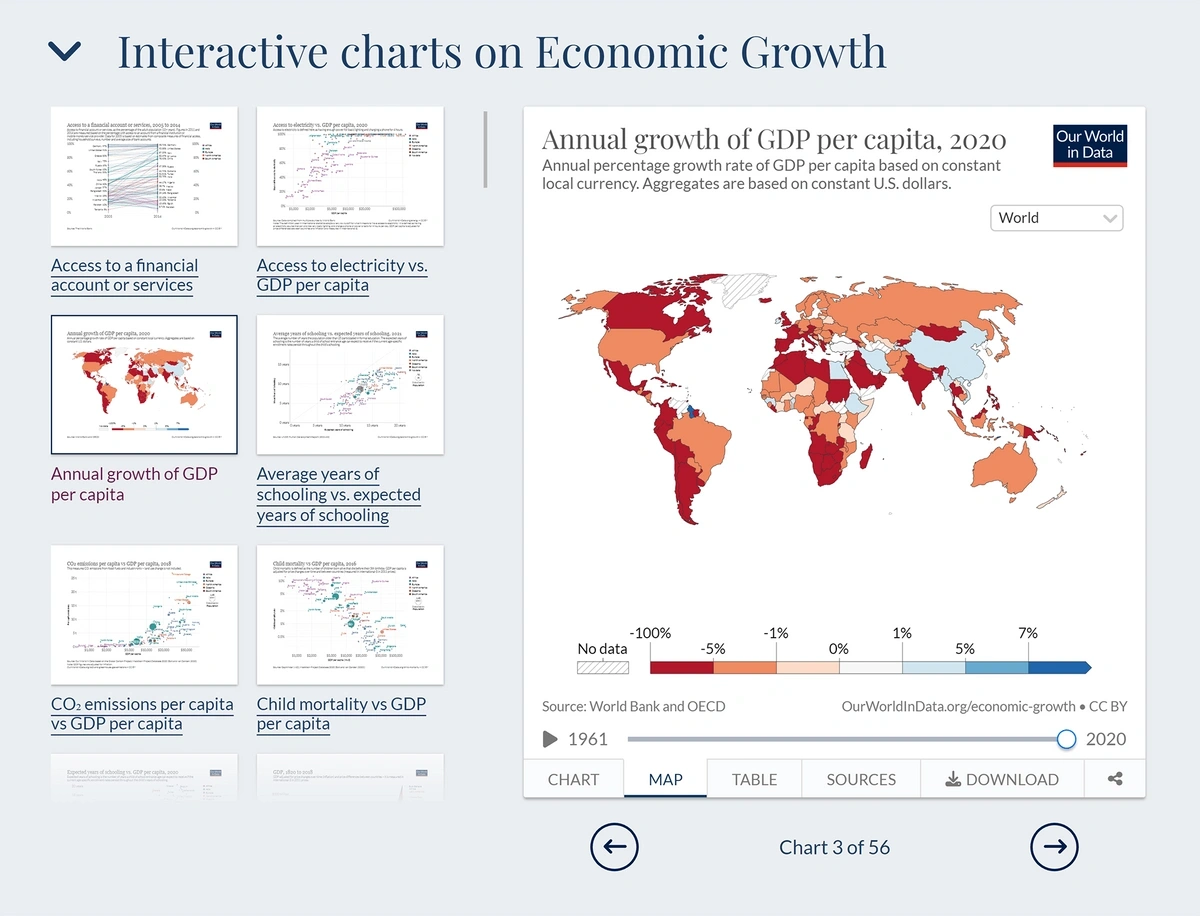
- Interactive charts
- Answers to common questions
- A complete list of sources
The platform contains a vast array of data visualizations for every research need—their report on economic growth contains over 56 interactive charts and maps alone.
If your work is focused on major social and economic issues, Our World in Data is a great resource to add to your toolbox. However, if you're in need of data about trends in technology, business, investment trends, or ecommerce, you'll need to look elsewhere.
How Much Does it Cost to Use Our World in Data?
Our World in Data is free to use; there's no cost to access any report or chart. The group uses a Creative Commons license, and users may cite statistics and charts by giving credit to Our World in Data as the original source.
Statista vs. Our World in Data: Similarities and Differences At a Glance
| Similarities | Differences |
|
|
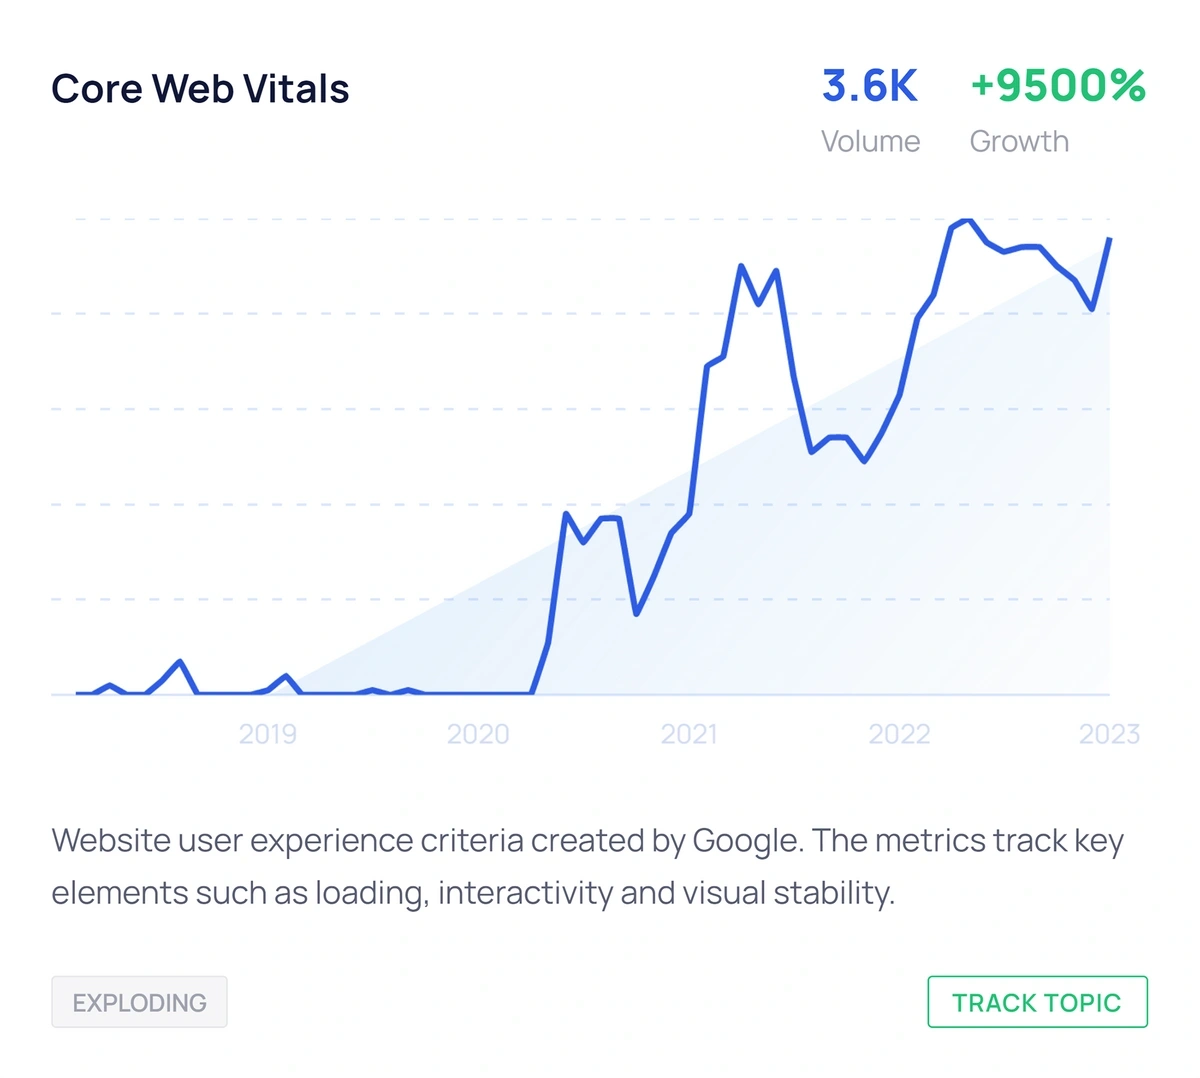
2. Exploding Topics
Exploding Topics is a trend-focused research and discovery tool that provides data for a variety of industries, including:
- Finance
- Media and marketing
- Lifestyle and social
- Luxury and fashion
- Startups and technology
- Health and home
- Eco and travel
- Gaming and software
- Food and fitness
The platform sources its data with the help of artificial intelligence (AI) that looks at online conversations. This data is then reviewed by experienced, human data analysts who identify a topic’s potential to increase in popularity and become a trend in the future.
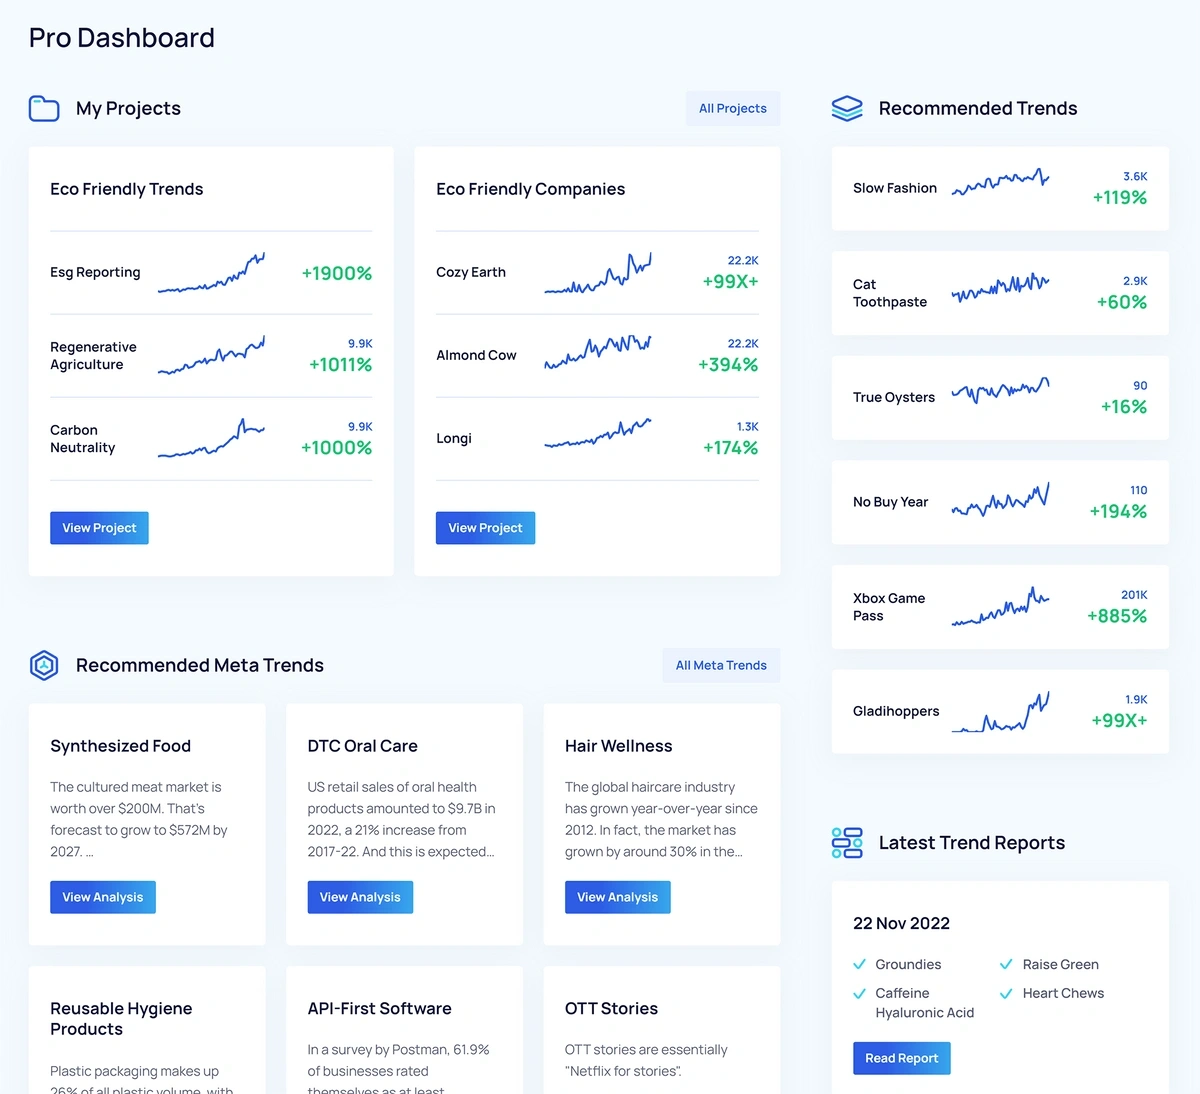
Exploding Topics includes a database you can search by topic, company, industry, or keyword, as well as expert reports on emerging trends and markets.
The data is updated daily, so Exploding Topics is an ideal choice for anyone who needs to monitor changes in trend popularity in near real-time. It can be used for:
- Finding information and charts to support a report or article that you’re preparing
- Making marketing decisions
- Brainstorming new content and product ideas
- Looking for potential investment opportunities
- Launching new and innovative initiatives
How Much Does it Cost to Use Exploding Topics?
There’s no cost to begin searching the Exploding Topics database, and many of the platform’s graphs are available for everyone to view.
To get complete, early access to every Exploding Topics data point, though, you’ll need an Exploding Topics Pro subscription. This starts at just $39 per year (billed annually) and includes:
- Access to new trend data up to a year before anyone else
- Project tracking and organization tools
- Keyword-based trend search
- Lists of trending startups and products
- Instant trend alerts
- A reports library
- API access
- Meta trends analysis
- CSV file export
You can also use the Semrush Traffic & Market Toolkit with your Semrush account to gather key insights into specific websites or topics. You'll be able to view traffic sources, user engagement metrics, audience insights, and competitor benchmarking in one easy to navigate dashboard.
Statista vs. Exploding Topics: Similarities and Differences At a Glance
| Similarities | Differences |
|
|
Want to Spy on Your Competition?
Explore competitors’ website traffic stats, discover growth points, and expand your market share.
3. Pew Research Center
The Pew Research Center is a nonpartisan organization that provides reports and statistics based on:
- Global public opinion polling
- Demographic research
- Content analysis
- Social-science research

Pew’s research data covers more than 150 topics. These include:
- Politics and policy
- International affairs
- Immigration and migration
- Race and ethnicity
- Religion
- Generations and age
- Gender and LGBTQ
- Family and relationships
- Economy and work
- Regions and countries
- Science
- Internet and technology
- News habits and media
The Pew Research Center presents many of its statistics and trends in article form—typically accompanied visualizations like infographics and bar charts.
If you’re interested in drawing your own conclusions from data about social, political, and economic factors, then the Pew Research Center website could be a good choice. It can also be a good supplement to other news outlets for anyone doing research for reports or articles.
However, if you’re looking for more business-focused data or need to explore trend forecasts for your business, Pew may not include the type of data sets you need. You’ll probably be better served by another one of Statista’s top competitors.
How Much Does it Cost to Use Pew Research Center?
It is free to browse the Pew Research Center’s reports and download the larger datasets used to create their charts, graphs, and analysis.
However, to get the most out of Pew’s datasets, you’ll need to be familiar with statistical software, .sav files, and ASCII text files.
Statista vs. Pew Research Center: Similarities and Differences At a Glance
| Similarities | Differences |
|
|
4. IBISWorld
The IBISWorld database contains market data for use by businesses and academic institutions.

While it can be used by anyone, much of its data is focused on the U.S., U.K., Australia, and Europe.
You can use IBISWorld to view market outlook reports and statistics for 30 sectors, including:
- Administration and business support services
- Agriculture, forestry, fishing, and hunting
- Arts, entertainment, and recreation
- Finance and insurance
- Healthcare and social assistance
- Manufacturing
- Public administration and safety
- Retail trade
- Utilities
- Wholesale trade
The company says you can use its platform for purposes such as:
- Academics
- Business valuations
- Commercial banking
- Consulting
- Legal work
- Marketing work
- Sales
If your research covers one of these areas, you may find IBISWorld useful. However, some potential users may find budget to be a concern.
How Much Does it Cost to Use IBISWorld?
You can access some IBISWorld data for free. When you search the database and click on a topic, you’re presented with:
- An overview of relevant market trends
- A summary of IBISWorld’s outlook for the market
- Select statistics, such as total market size
- Top companies in a relevant sector
To see all information, you’ll need to purchase a membership or a single report. These reports include expanded data including:
- Top companies’ market share
- Industry trends
- Industry operating conditions
- Profitability analysis
- Market revenue forecasts
- Growth forecasts
Pricing is not publicly available on the site. You must fill out the membership inquiry form to get a quote.
Statista vs. IBISWorld: Similarities and Differences At a Glance
| Similarities | Differences |
|
|
5. Gallup
Gallup is an analytics firm and polling organization.
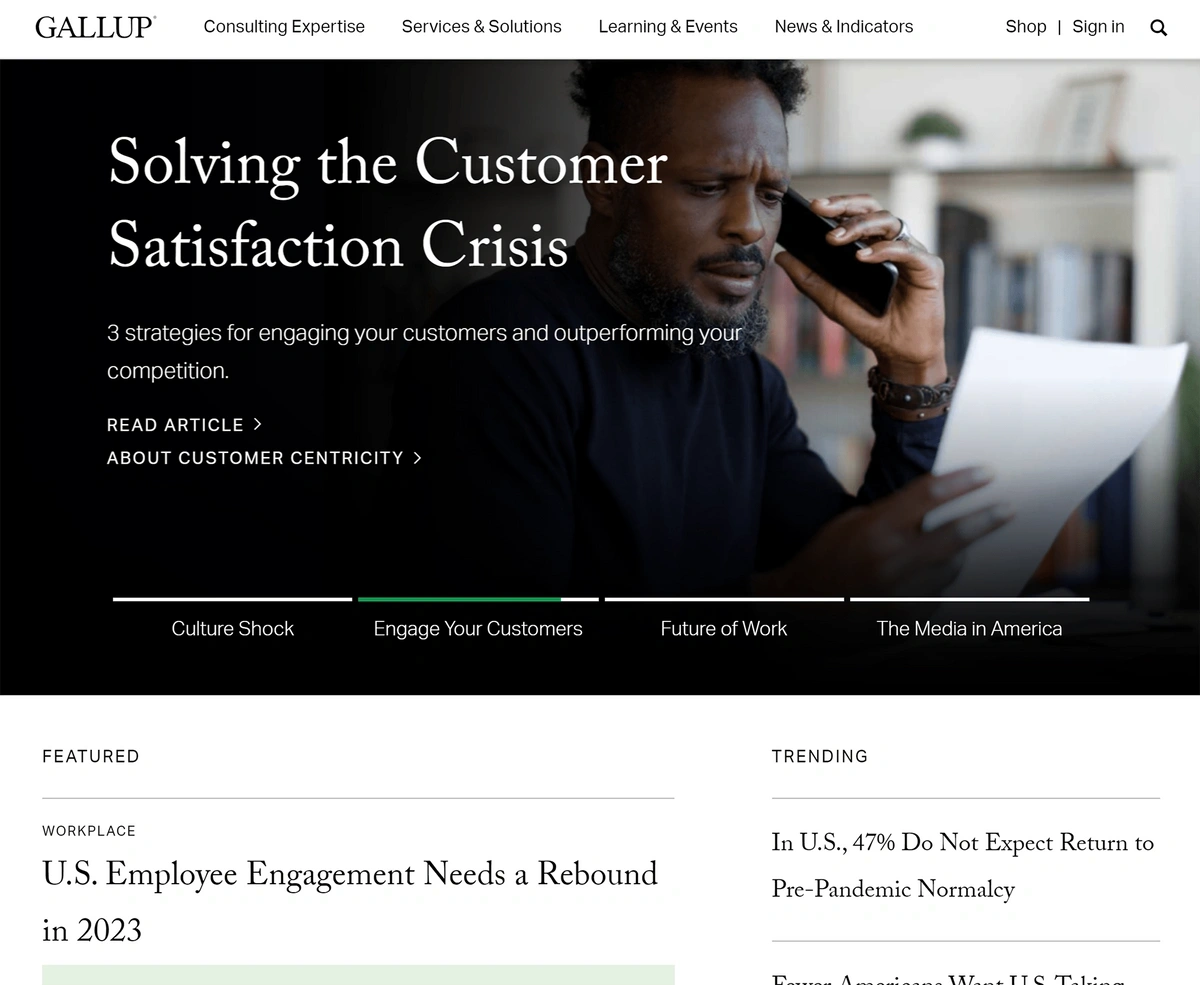
The organization’s data is often cited in news articles about political and economic topics, but Gallup collects data on a number of other topics as well. These include:
- Employee engagement and wellbeing
- Environmental, social, and governance
- Hybrid work
- Leadership and management
- Life Evaluation Index (a measure of how people rate their current lives and future expectations)
- U.S. Satisfaction (how Americans feel about their current government)
You can glean insights from Gallup data by browsing their official reports on any of the above topics or by reading articles in the Gallup Short Answer news center. Through the news center, you can see statistics on additional topics, such as:
- Crime
- Religion
- Firearms
- Global warming
- UFOs
- Health
- Investing
- Business
A lot of Gallup’s data is focused on U.S. audiences, so if you’re looking for more global insights—or data about other industries—you’ll probably want to try another Statista alternative.
How Much Does it Cost to Use Gallup?
There’s no charge to browse the Gallup site and view available reports and data sets. The company generates revenue by charging for assessment and survey tools often used by corporations.
Statista vs. Gallup: Similarities and Differences At a Glance
| Similarities | Differences |
|
|
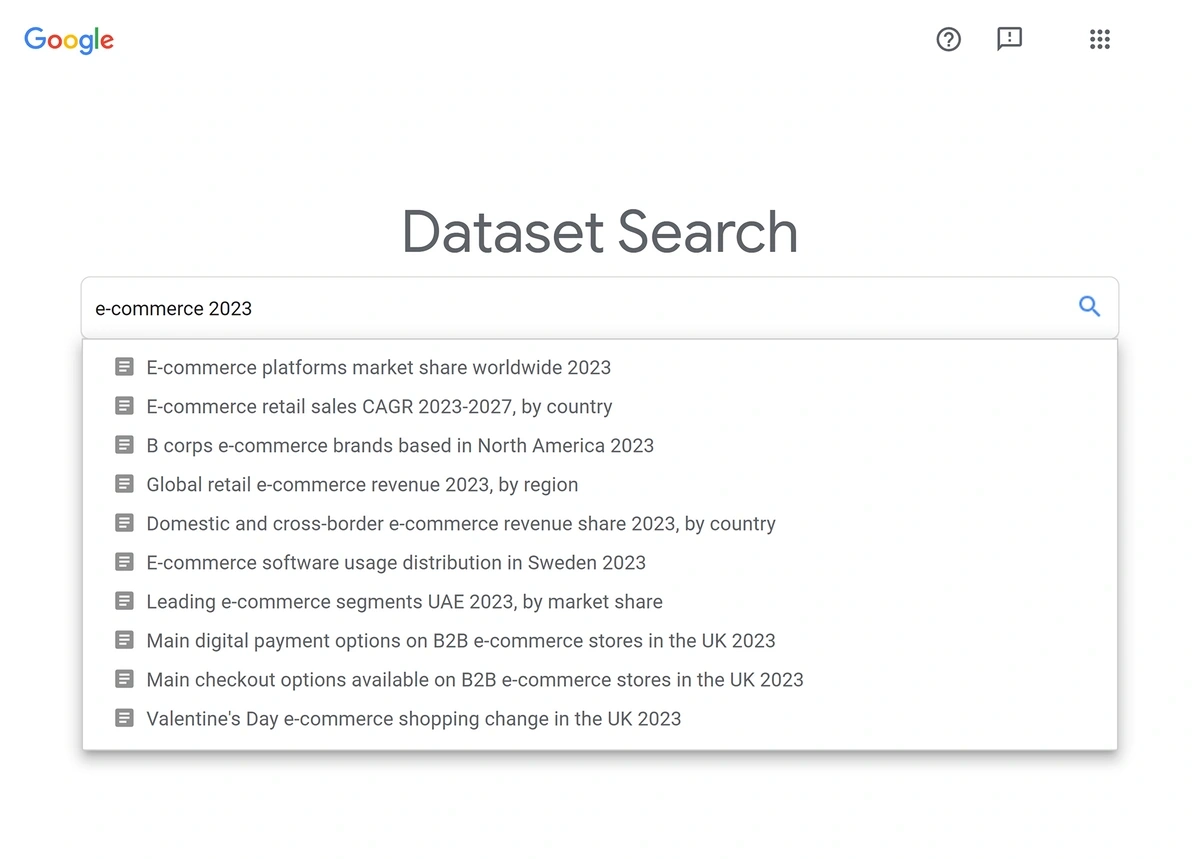
6. Google Dataset Search
Google’s Dataset Search is a search engine for data. While regular Google search results can include reports and statistics, Dataset Search only returns those kinds of results.
Google’s data search feature draws from nearly 25 million indexed datasets, and can be used by:
- Students
- Researchers
- Journalists
- Businesses
- Data scientists
- Casual searchers
You can search for any topic when using Google’s tool, and suggested searches begin to populate as soon as you start typing—just like when conducting a normal web search.
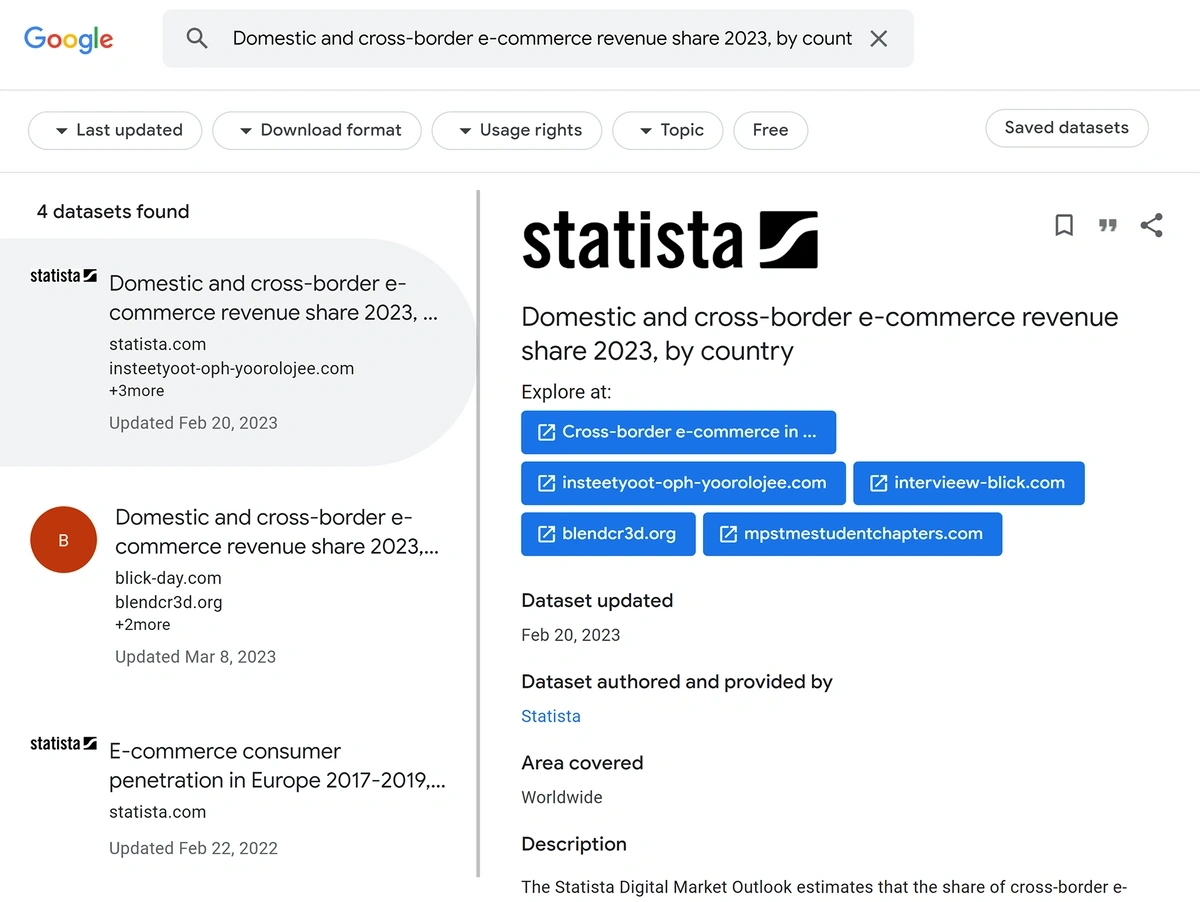
Search results include an overview of the relevant dataset, its publication date, and the author, along with links to the source as found elsewhere online.
How Much Does it Cost to Use Google Dataset Search?
Google Dataset Search is free to use, but many of the datasets found through Google’s search trace back to Statista. That means that your ability to see the full dataset may be limited if it involves a chart or report that Statista has placed behind a paywall.
Statista vs. Google Dataset Search: Similarities and Differences At a Glance
| Similarities | Differences |
|
|
7. Macrotrends
Macrotrends is an economic and stock market database.
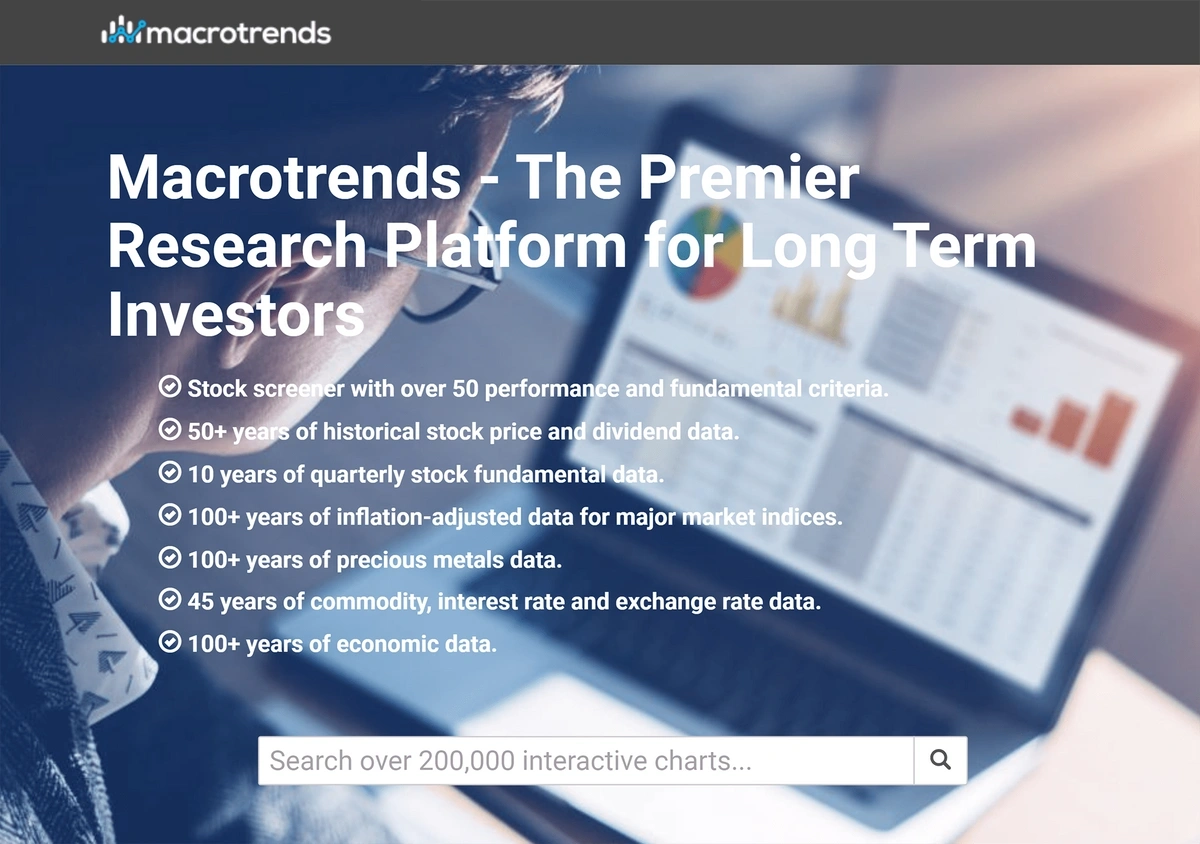
The platform offers over 200,000 interactive charts mapping changes in:
- Specific stocks
- Stock indexes
- Precious metal prices
- Oil and gas prices
- Commodity prices
- Currency exchange rates
- Interest rates
You can also use Macrotrends to see historical changes in key economic factors like:
- Jobs lost from COVID-19
- Unemployment rates
- Industrial production levels
- National debt
- Retail sales
- Car sales
- Housing levels
- Inflation
While the Macrotrends database isn't quite as robust as Statista, its charts offer insight into economic performance over the years. This can be useful on its own as well as with one of the other data providers on our list.
How Much Does it Cost to Use Macrotrends?
Macrotrends is free to use, and you do not need to create an account.
Statista vs. Macrotrends: Similarities and Differences At a Glance
| Similarities | Differences |
|
|
8. National Bureau of Economic Research
The National Bureau of Economic Research (NBER) is a nonpartisan organization of academic researchers.
The group publishes over 1,200 working papers each year. These papers highlight and analyze issues in the global economy.
In addition to their comprehensive working papers, the NBER also publishes summaries of important economic activity—complete with charts and graphs.
Through these summaries, you can view data related to things like:
- Business and entrepreneurship trends
- Retirement and disability rates
- Impacts of healthcare facilities on communities
- Labor exploitation
- Political polarization
While NBER is based in the U.S., many of its reports include international data.
If you like the economic data provided by services like Our World in Data and Macrotrends, but want to dive even deeper on specific topics, then the NBER website can be a useful tool.
How Much Does it Cost to Use the National Bureau of Economic Research?
NBER offers a number of its reports for free—all you need to do is sign up for emails.
You can also download up to three complete NBER working papers every year for free. If you want to access more papers, you'll either need to be a part of a participating academic institution or join as a paid subscriber.
Unlimited access to every paper published by NBER costs $3,400 per year.
It's also possible to subscribe to individual programs. Prices vary.
Statista vs. National Bureau of Economic Research: Similarities and Differences At a Glance
| Similarities | Differences |
|
|
9. Visual Capitalist
Visual Capitalist is a data visualization platform.
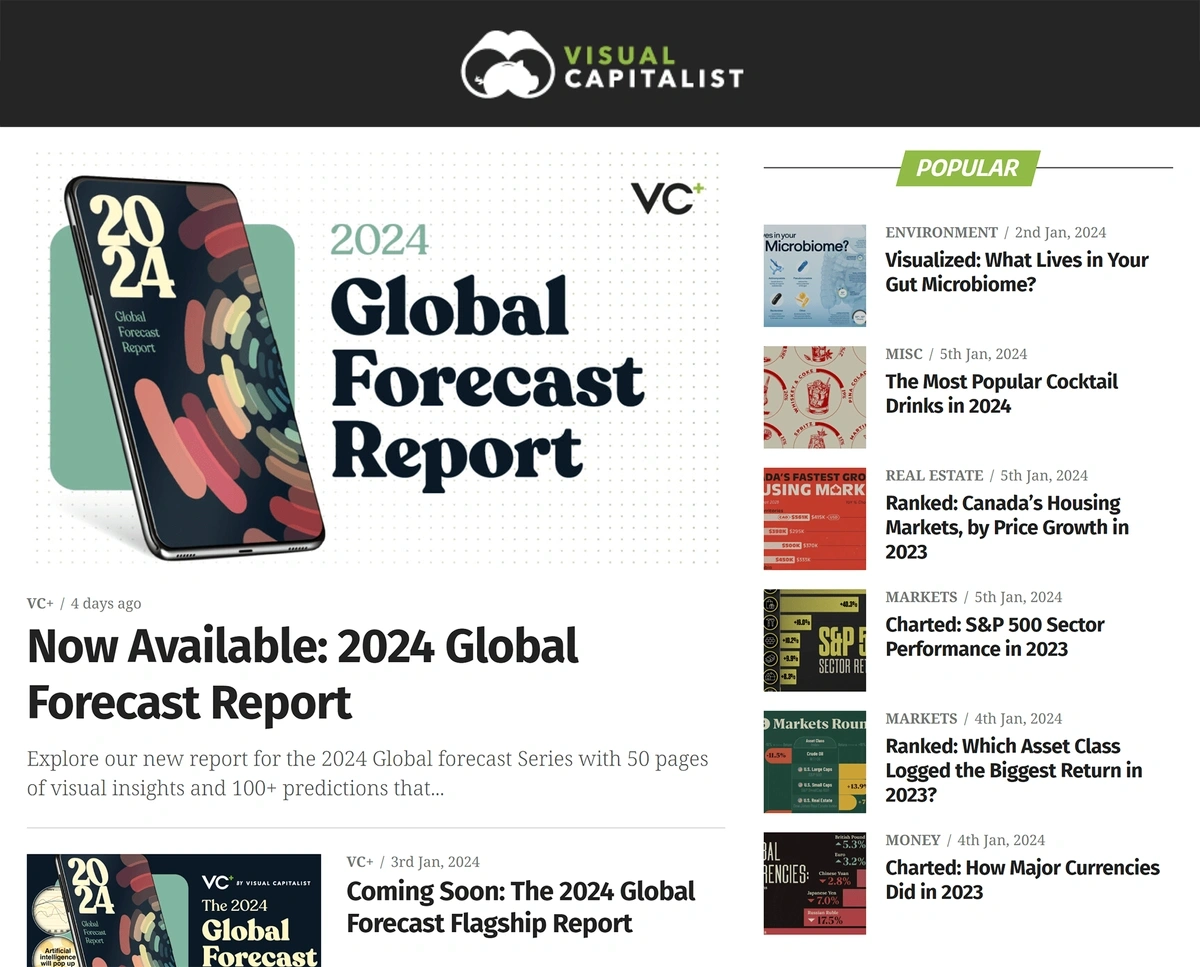
The company's reports read more like a magazine article than a research paper. This makes Visual Capitalist a widely accessible alternative to highly academic outlets like NBER.
You can use Visual Capitalist to look up information about:
- Technology developments
- Consumer finance
- Healthcare
- Population levels
- Global politics
- Energy
- Mining
- Climate change
This information is then presented as a brief report, data tables, and a colorful graphic.
The Visual Capitalist team sources their data from other research groups and organizations like the World Economic Forum.
Individuals can also submit their data visualizations, with sources, to Visual Capitalist. The site's editorial team reviews all submissions and decides which ones to publish.
How Much Does it Cost to Use Visual Capitalist?
It's free to browse the Visual Capitalist website and use their graphics with attribution.
To get access to the entire Venture Capitalist archive, exclusive briefings, trend newsletter, and events, you'll need a VC+ subscription.
It costs $8.22 per month (or $6.58 per month when billed annually) to access subscriber content.
Statista vs. Visual Capitalist: At a Glance
| Similarities | Differences |
|
|
Conclusion
With over 320 million terabytes of data created every day, all of the services on this list act as a great starting point for exploring just the right data sets for a variety of industries and uses.
If you need to browse data about singular events that have occurred in the past, or want to read the results of a large-scale formal survey, then services like Statista, NBER, and Gallup are certainly useful options.
However, if you’d like to know what people are talking about and interested in as they use social media and search the web, Exploding Topics or Visual Capitalist may be a better option.
Stop Guessing, Start Growing 🚀
Use real-time topic data to create content that resonates and brings results.

Exploding Topics is owned by Semrush. Our mission is to provide accurate data and expert insights on emerging trends. Unless otherwise noted, this page’s content was written by either an employee or a paid contractor of Semrush Inc.
Share
Newsletter Signup
By clicking “Subscribe” you agree to Semrush Privacy Policy and consent to Semrush using your contact data for newsletter purposes
Written By


Josh is the Co-Founder and CTO of Exploding Topics. Josh has led Exploding Topics product development from the first line of co... Read more