


Get Advanced Insights on Any Topic
Discover Trends 12+ Months Before Everyone Else
How We Find Trends Before They Take Off
Exploding Topics’ advanced algorithm monitors millions of unstructured data points to spot trends early on.

Keyword Research
Performance Tracking
Competitor Intelligence
Fix Your Site’s SEO Issues in 30 Seconds
Find technical issues blocking search visibility. Get prioritized, actionable fixes in seconds.
Powered by data from
Latest Blog Posts
Featured Case Studies
See what's trending before everyone else
Each week, we'll send you our best Exploding Topics. Plus, expert insight and analysis.
12 Top Business Intelligence Tools (2024)

Business intelligence (BI) tools can help you analyze and understand data from various areas of your business operations.
Because BI tools collect, store, and process data, they can make it easier to glean insights on things like:
- How your customers are finding you online
- Where leads begin to churn and drop out of your pipeline
- The areas of the world your followers or customers live in
- Whether your employees are satisfied in their roles
Many of these programs include tools to help you visualize or model your data—and can even include machine learning capabilities to speed up the process.
These are eight of the best business intelligence tools available right now.
1. Snowflake
Snowflake is a cloud-based data warehouse solution.
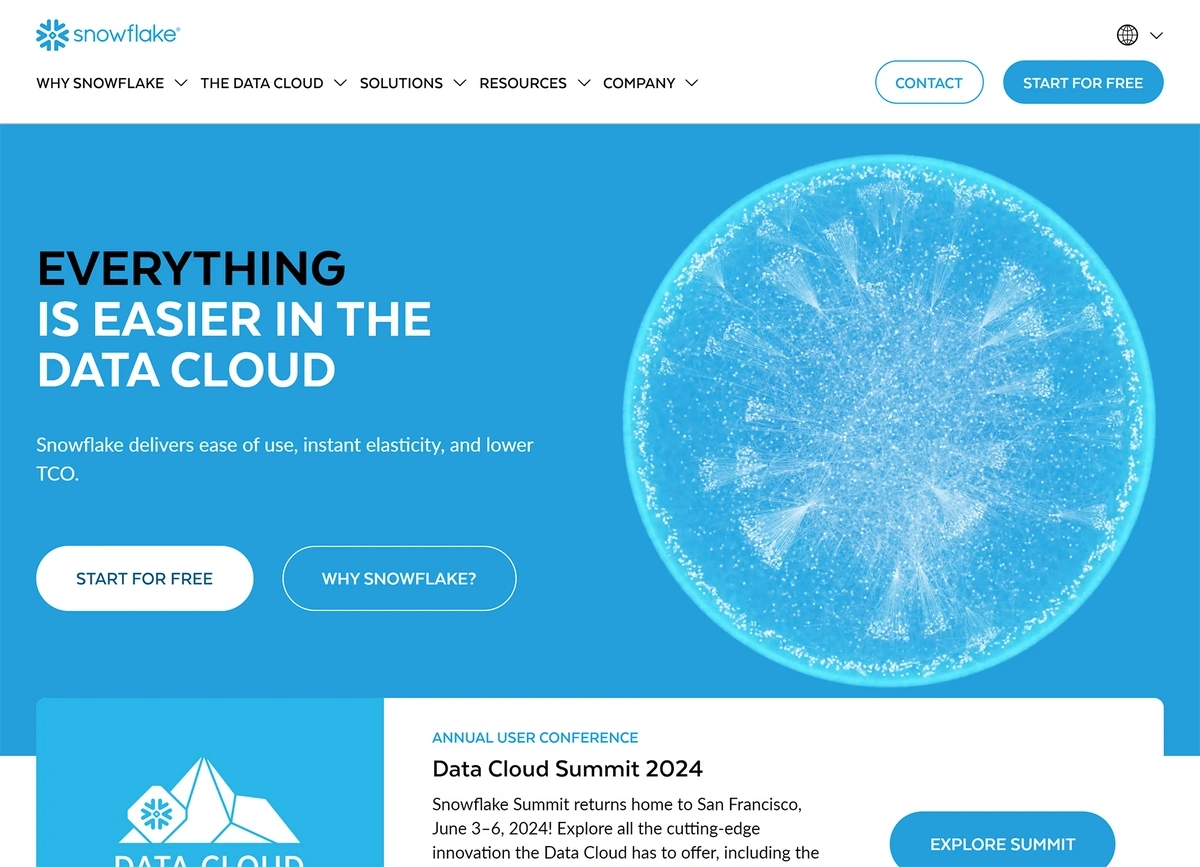
The tool allows businesses to store multiple large data sets in one spots, and integrates with enterprise-level software programs like:
- Amazon Web Services (AWS)
- Microsoft Azure
- Google Cloud Platform.
By pulling data from these and other various sources into Snowflake’s data cloud, companies can:
- View data with no silos
- Make connections about how data points relate to each other
- Use data while working remotely with other stakeholders
- Build custom applications using data stored in Snowflake
- Improve decision-making across company departments or verticals
Snowflake pricing is unique to each company. It’s based on how much data you store and how much time you spend managing it with Snowflake’s resources.
However, the sheer scale of the platform—and the fact it links with enterprise applications like Azure—means that it’s probably best suited to large companies that have a lot of data to process.
Snowflake At a Glance
| Starting price | Custom quotes |
| Best for | Data storage |
| Key features | Allows users to build custom applications with data stored in Snowflake; removes silos between data sets |
| Notable integrations | Microsoft Azure, Amazon Web Services, Google Cloud Platform |
2. Zoho Analytics
Zoho Analytics is a dashboard-based BI solution.
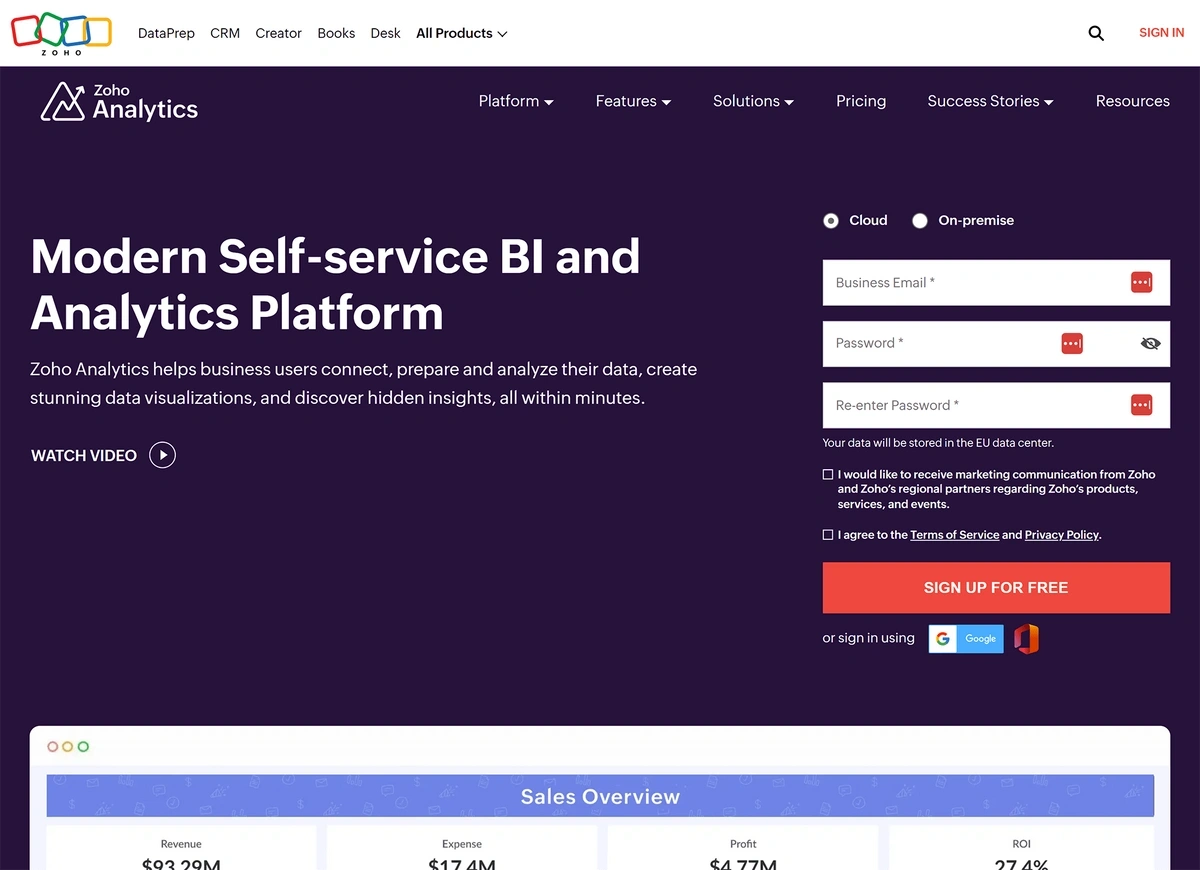
If you need to examine info from different data sources, but don’t quite need the enterprise-grade storage offered by Snowflake, then Zoho Analytics could be a good choice for you.
You can connect a variety of analytics tools and data services to Zoho Analytics, including:
- Google Drive
- Hubspot
- Salesforce
- QuickBooks
- Survey Monkey
- PPC ad platforms
- Social media accounts
- Analytics platforms
Zoho also accepts spreadsheet uploads in the event you need to input data that isn’t directly supported by the platform.
Once your raw data gets loaded into Zoho Analytics, you can build dashboards with rich charts and graphs. Non-technical users even explore their data by chatting with Zoho’s AI assistant.
You can use Zoho Analytics for free, but there’s a limit. You can only analyze up to 10,000 rows of data, and the data has to be stored on your device.
If you’d like to use the Zoho cloud or analyze more data, you can do so with paid plans that start at $24 per month (billed annually).
Zoho Analytics At a Glance
| Starting price | $24 per month, billed annually |
| Best for | Data dashboards |
| Key features | AI-powered, chatbot-style data analysis and exploration tools |
| Notable integrations | Google Drive, Hubspot, Salesforce, social media accounts |
3. Exploding Topics
Exploding Topics is a trend spotting platform.
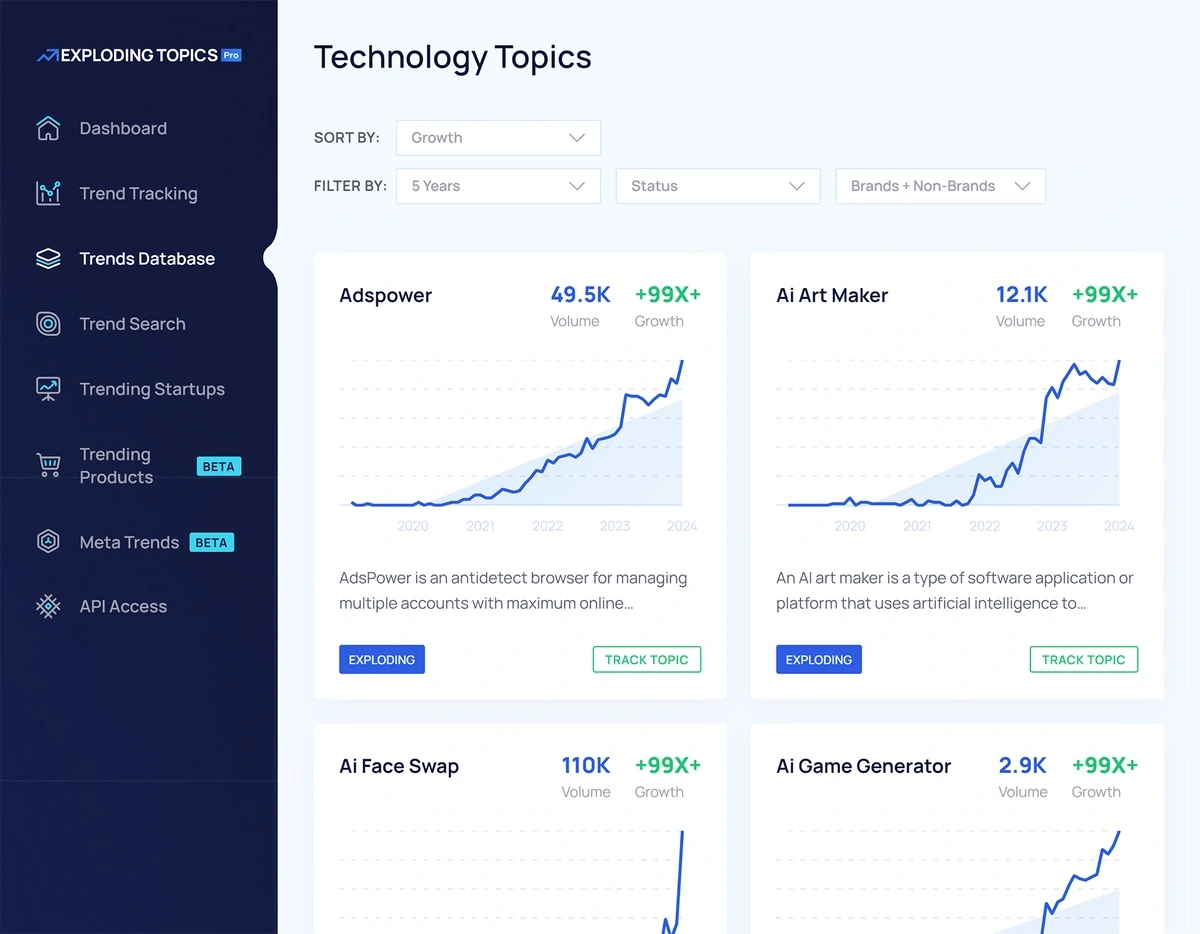
While Snowflake and Zoho Analytics can help you manage data, Exploding Topics helps you find it.
As a business intelligence tool, Exploding Topics lets you:
- Explore how interest in—and search volumes for—trends have changed over time
- Pull data about growing startups’ valuations and funding rounds
- Research the average sale price and monthly revenue for trending products
- Track how different trends interact and relate to industry segments
All this data can be used to:
- Identify new audience segments
- Develop new products for your customers
- Hone your marketing campaigns
- Plan a pricing strategy
- Keep pace with competitors
- Find companies to invest in
It’s easy to analyze the data with other tools, too: use our API or simply export trend, startup, and company data directly to a CSV file.
Access to every Exploding Topics feature, including the API, is available with a paid business plan—$249 per month, billed annually.
Exploding Topics At a Glance
| Starting price | $249 per month, billed annually, for business plans |
| Best for | Data research |
| Key features | Trend forecasts and meta trends graphs that show how smaller topics connect to create larger trends |
| Notable integrations | CSV exports compatible with Google Sheets and Microsoft Excel |
4. Looker BI
Looker BI is a web-based, Google-owned tool for storing, searching, and visualizing data.
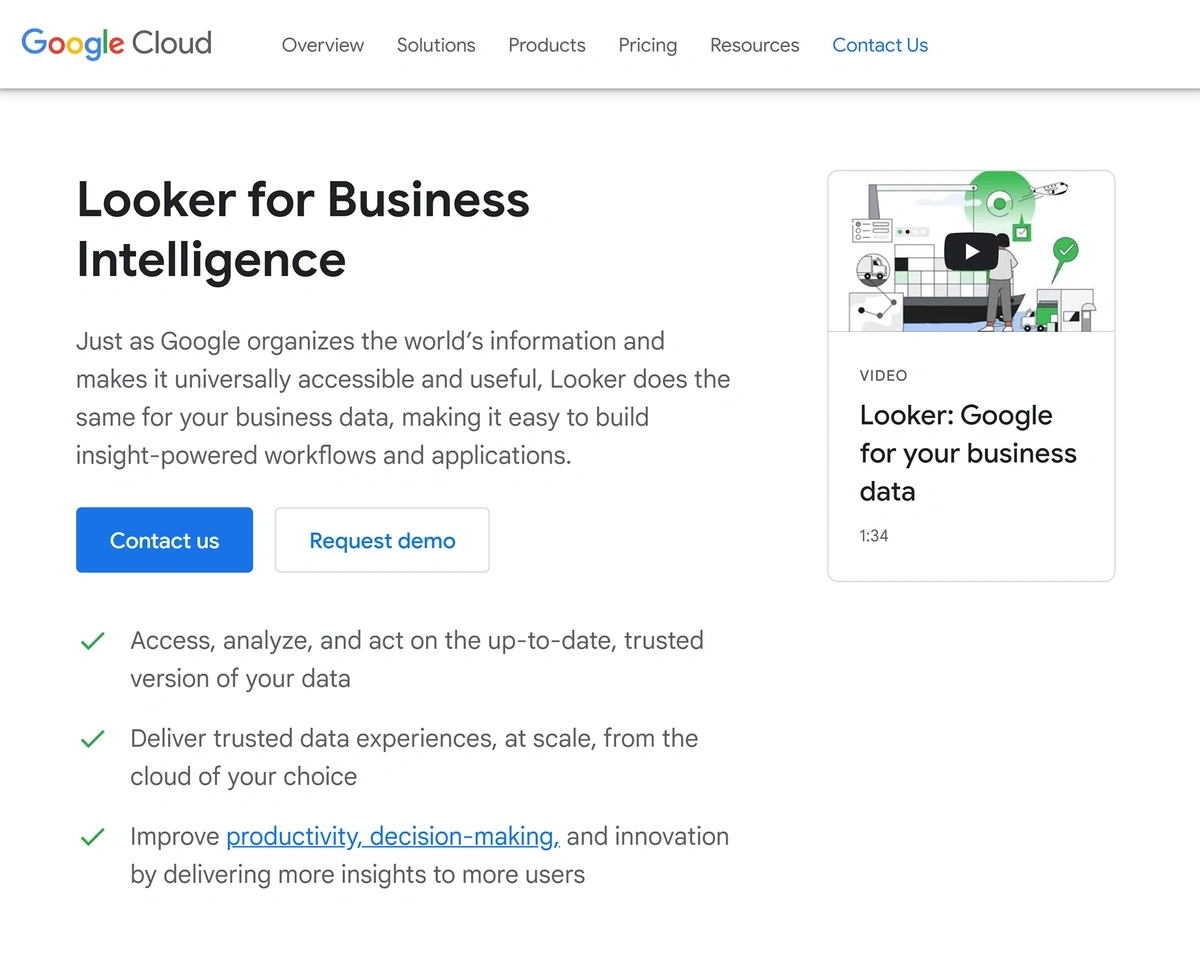
Because it’s a Google product, Looker is a straightforward way to analyze and manipulate data from tools like Google Analytics, Google Search Console, and Google Cloud SQL.
However, you can bring in business analytics from other sources like Shopify, Salesforce, or Facebook with the help of plug-ins.
When your data is in Looker, you can:
- Organize and search through your business data
- Free up data from tool or department silos and analyze it all in one spot
- Create data models
- Build custom applications
Standard Looker BI access costs $5,000 per month that you use the tool.
Looker BI At a Glance
| Starting price | $5,000 per month |
| Best for | Google data storage and analysis |
| Key features | Data modeling with multichannel analytics |
| Notable integrations | Google Analytics, Google Cloud SQL, Shopify, Salesforce |
5. Looker Studio
Looker Studio is Google's free data visualization tool.
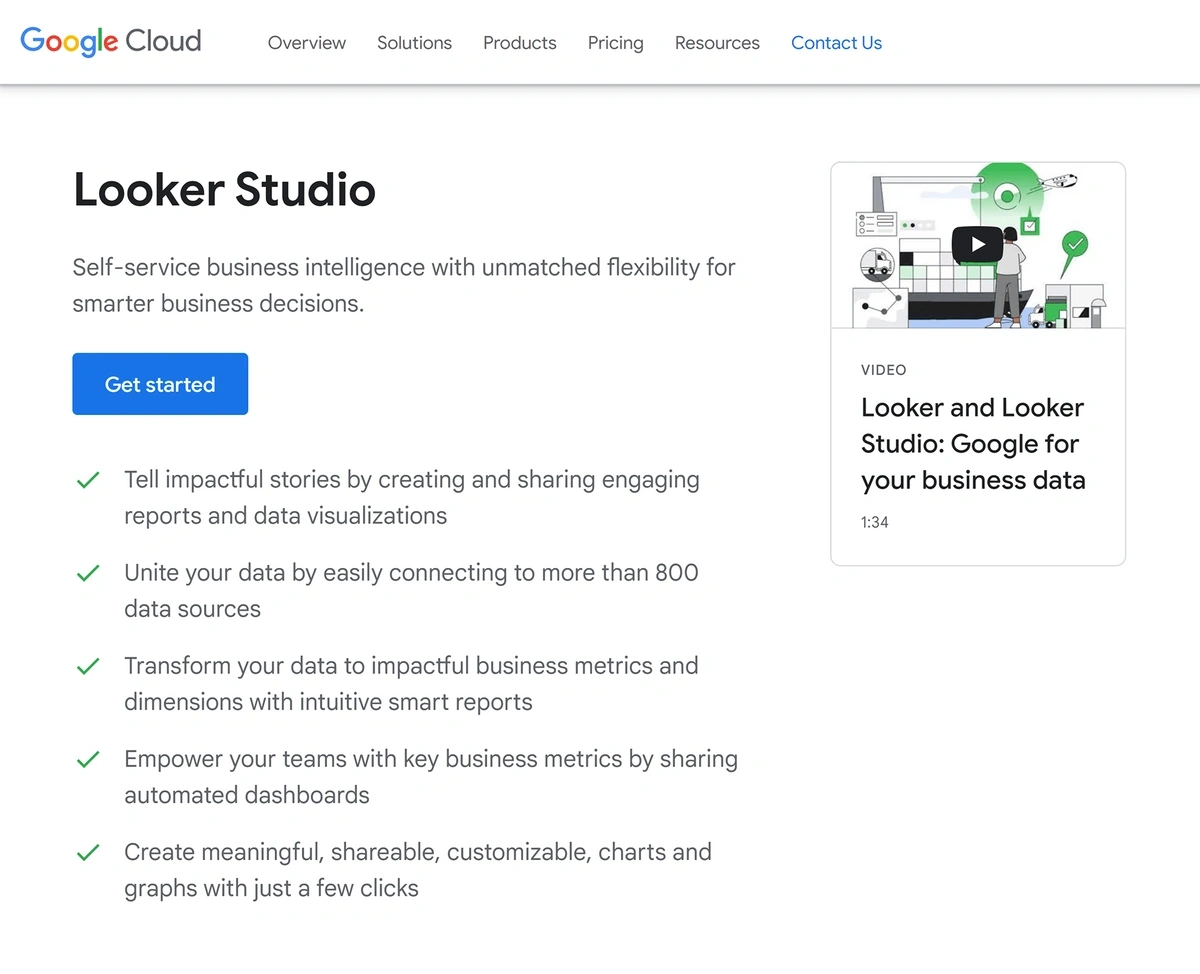
If Looker BI is too advanced for your needs, and you store most of your business data in Google products, then Looker Studio may be a better solution.
The platform offers a more intuitive and user-friendly interface than found in many BI tools. With Looker's drag-and-drop interface and report templates, you can create:
- Advanced analytics visualizations
- Interactive reports
- Embeddable reports
You can pull data into Looker Studio from a variety of Google applications, including Google Analytics, Ads, Sheets, YouTube and Search Console.
You aren't entirely limited to Google products, though. Looker Studio accepts direct data uploads via CSV, and you can also pull in metrics from social media platforms and SQL databases.
If your data visualization needs are fairly light, mostly focused on web analytics, or using data sets that are several gigabytes, not terabytes, in size, then Looker Studio is worth a try.
The platform is free to use as a report creator or viewer. If you need to collaborate with colleagues and assign usage permissions, though, you'll want a Looker Studio Pro license—this starts at $9 per user, per project, per month.
Looker Studio At a Glance
| Starting price | Free |
| Best for | Google Workspace users |
| Key features | Drag-and-drop report builder interface |
| Notable integrations | Google Workspace applications, Google Search Console, Google Analytics, social media platforms |
6. Salesforce Tableau CRM
The Salesforce Tableau CRM is a sales data analysis tool.
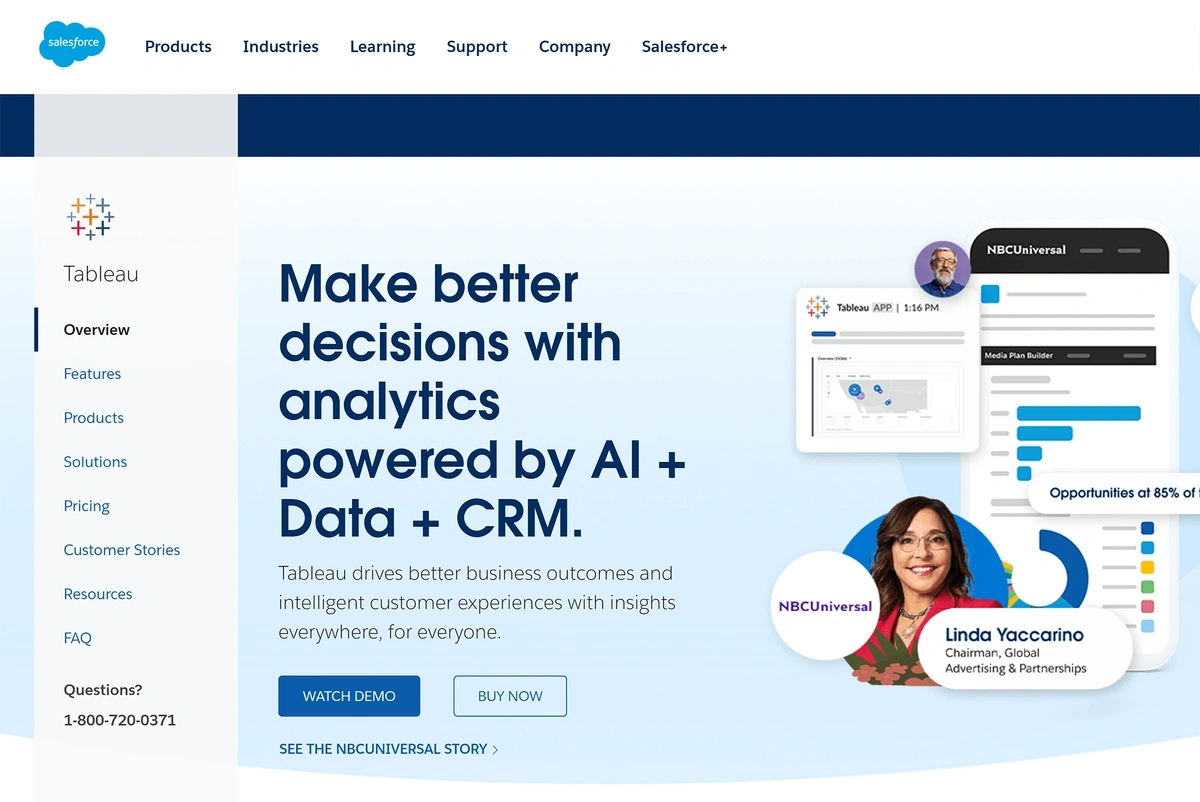
When using Tableau to analyze your CRM data, you can:
- Explore, analyze, and visualize Salesforce metrics
- See what happened in your pipeline, when, and why
- Track changes in your sales data
- Import additional data from tools like AWS and Microsoft Dynamics
- Chat with team members and share dashboards directly in the app
- Use the built-in Einstein service to create AI data models and dashboards
If you’re already a Salesforce user and do most of your analysis with CRM data, this could be a good choice to help you make informed decisions.
Access to the suite of Insights tools starts at $75 per month (billed annually), per user.
And if you aren’t a Salesforce user but like their CRM Insights features, you can use some of the same features with a standalone Tableau subscription.
Salesforce Tableau CRM At a Glance
| Starting price | $75 per month, billed annually |
| Best for | Sales data analysis |
| Key features | AI data modeling tools |
| Notable integrations | Salesforce, AWS, Microsoft Dynamics |
7. Domo
Domo is a business intelligence platform.
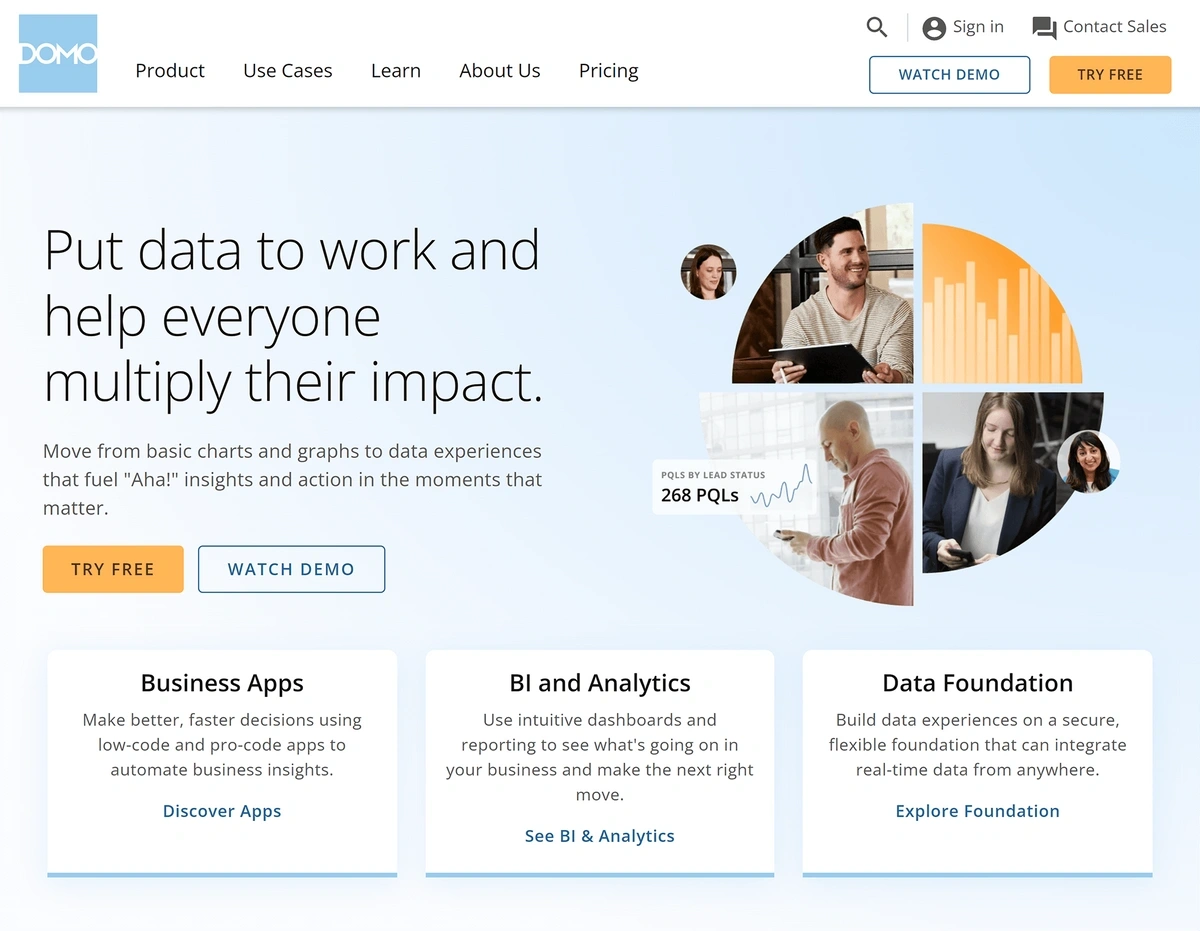
Domo places an emphasis on easy data visualization. By putting your data into the tool, you can:
- Build low- and no-code apps to automate business processes
- Create graphs, charts, and interactive dashboards
- Send real-time notifications about changes in your data to mobile devices
- Use AI and machine learning to tweak data and model potential outcomes
Domo says that its customers use the platform to:
- Track customer service issues
- Improve customer experiences
- Automate your BI reporting
- Glean actionable insights for marketing
- Remove data silos
- Forecast event attendance with predictive analytics
If a dashboard-focused tool like Zoho Analytics isn’t quite full-featured enough for your company, then you may want to give Domo a try.
Like Snowflake, Domo uses a variable pricing model based on features and usage. You’ll need to discuss your specific needs and goals with the Domo sales team in order to get a price quote.
Domo At a Glance
| Starting price | Custom quotes |
| Best for | Data visualization |
| Key features | Automatic reporting and predictive analytics |
| Notable integrations | SAP, Jira, Amazon Redshift, Oracle, Salesforce |
8. TIBCO Spotfire
TIBCO Spotfire is a data analysis tool.
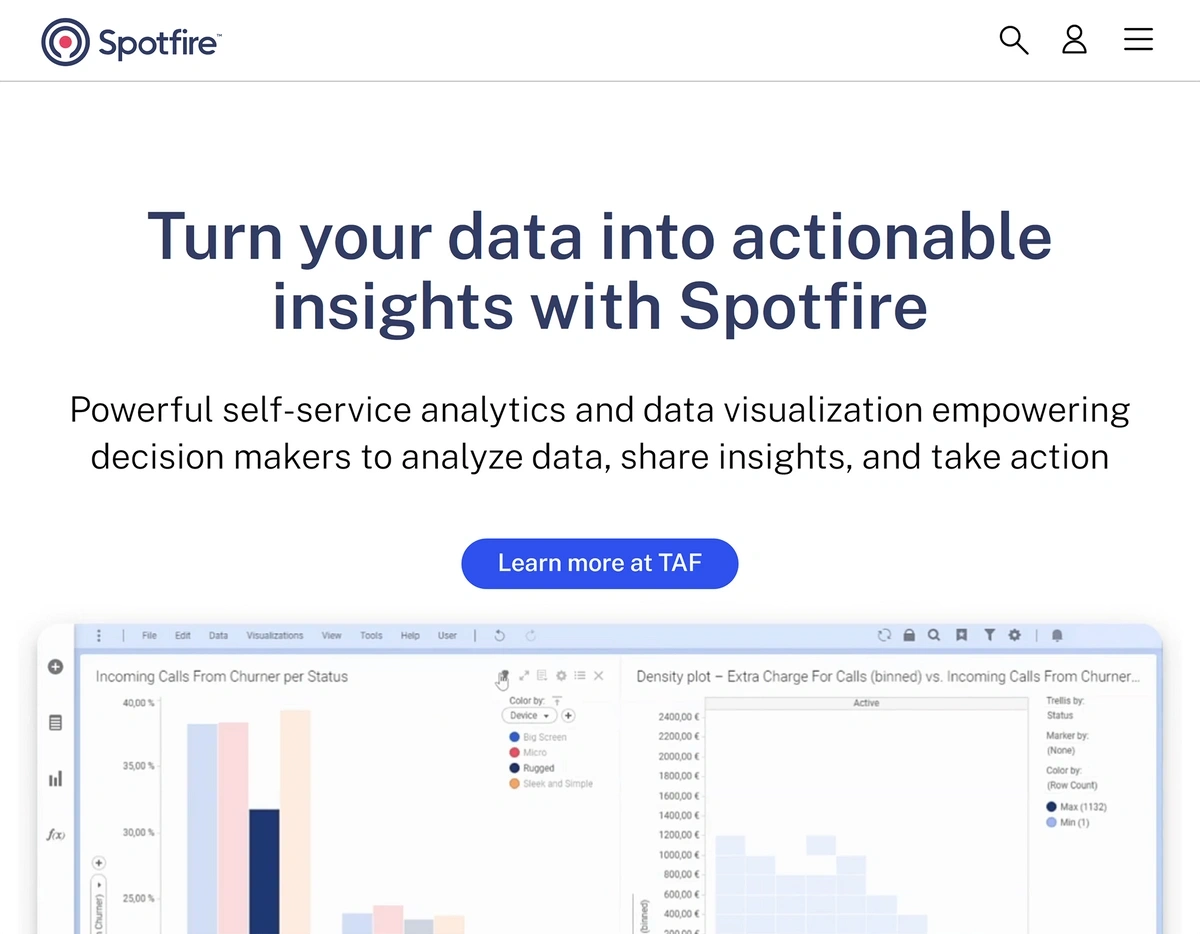
It leverages AI to help you understand key BI metrics. When using the TIBCO platform, you can:
- Take real-time actions on data as it arrives
- Build responsive visualizations
- Write Python scripts to manipulate data
One of its more unique features, though, its location analytics capabilities. If your data includes any geographical information, you can:
- Create interactive maps based on your data
- Drill down through multiple layers of geographic data (i.e. from country level down to specific addresses)
- Change map views based on each data set
- Convert data into latitude and longitude coordinates
So if your business relies on geographic data for transportation, logistics, marketing, sales, or other purposes, then TIBCO Spotfire may be a valuable addition to your BI toolkit.
You can launch a 30-day free trial right from TIBCO’s website, but you’ll need to chat with their sales team to learn more about ongoing pricing options.
TIBCO Spotfire At a Glance
| Starting price | Custom quotes |
| Best for | Data mapping |
| Key features | Custom scripting with Python |
| Notable integrations | Oracle, Microsoft SQL, social media platforms, IoT devices |
9. Workday People Analytics
Workday People Analytics is an HR data analysis platform.
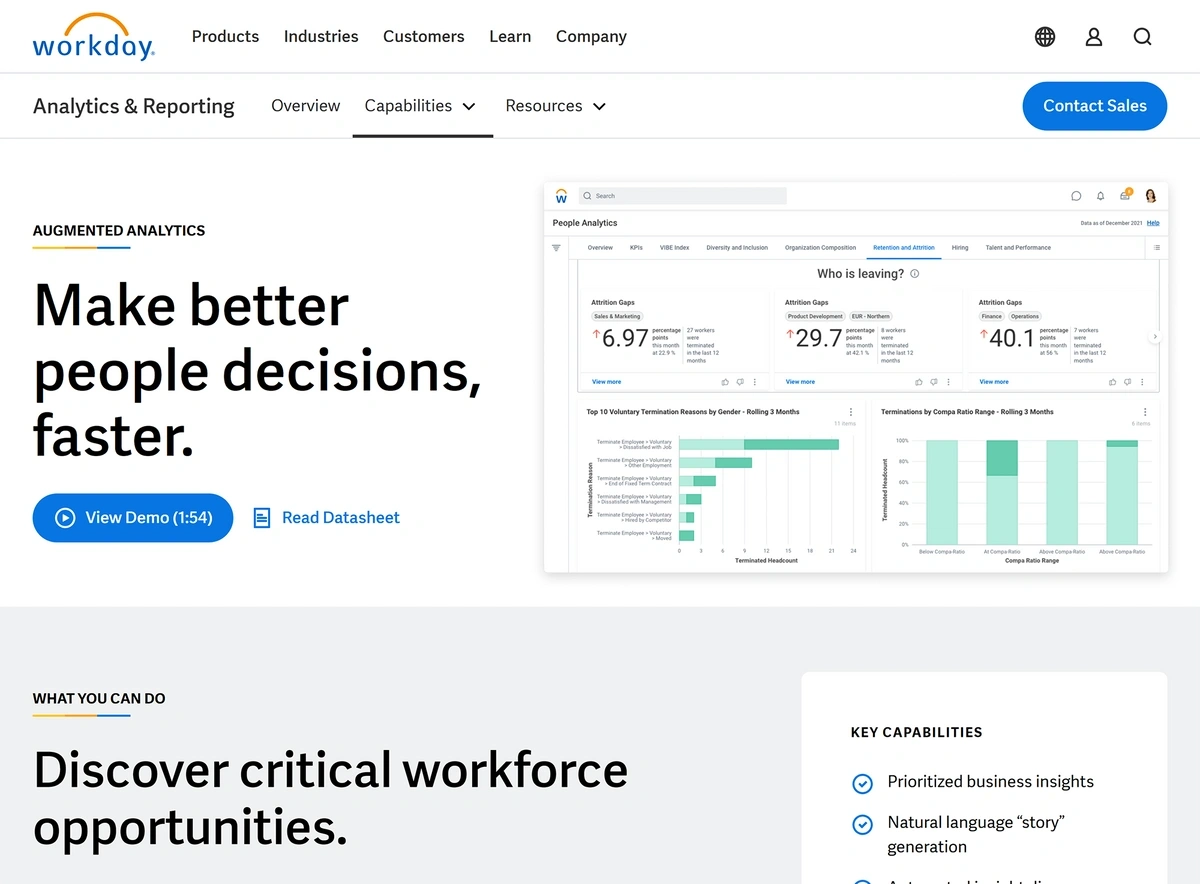
The program presents data visualizations and overviews in natural language, which Workday calls “stories.” You can use these stories to:
- Understand changes in staff demographics
- See why employees are leaving the company
- Develop targeted hiring plans
- View the overall makeup of your organization
- Improve retention rates
People Analytics is just one part of the Workday platform.
There are a variety of other BI and data analytics features available to Workday’s business users—such as Workday Prism, which can help you see how external factors relate to internal operations.
You’ll need to get in touch with Workday to discuss your needs and develop a price quote.
Workday People Analytics At a Glance
| Starting price | Custom quotes |
| Best for | HR data analysis |
| Key features | Natural-language data analysis reports and visualizations |
| Notable integrations | Other Workday enterprise systems |
10. Holistics
Holisitics is a self-service BI platform.
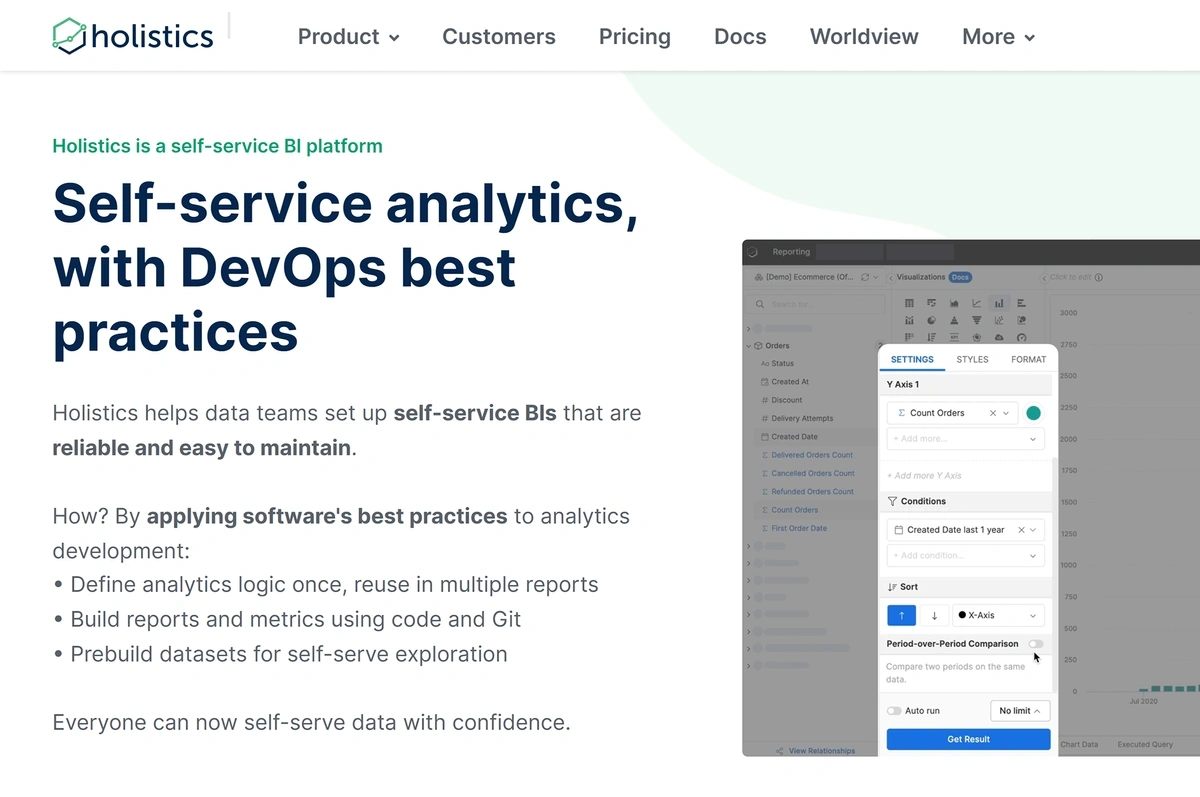
Software development teams can use this to build custom reports, visualizations, and data models for internal business use.
If you like the idea of a customizable visualization tool like Domo, but want even more control over how your data looks (and how others can interact with it), Holistics may be a good fit for your needs.
Development and data management teams will need to set up and configure Holistics' functionality. After that, non-technical users at a company can use the tool to generate on-demand reports and look up information as needed.
This includes access to customizable user dashboards that display:
- Charts and graphs
- Filterable data sets
- Data comparisons
You can also embed data dashboards into customer-facing web applications, if you need to share metrics with clients and other stakeholders.
A Holistics license starts at $180 per month (or $150 per month when billed annually). Pricing is available in U.S. dollars, Euros, and Singapore dollars based on user location.
Holistics At a Glance
| Starting price | $150 per month, billed annually |
| Best for | Teams with complex data reporting needs |
| Key features | Embeddable data dashboards |
| Notable integrations | Snowflake, Amazon Redshift, Google BigQuery, Microsoft SQL |
11. Amazon Athena
Amazon Athena is a serverless data query tool.
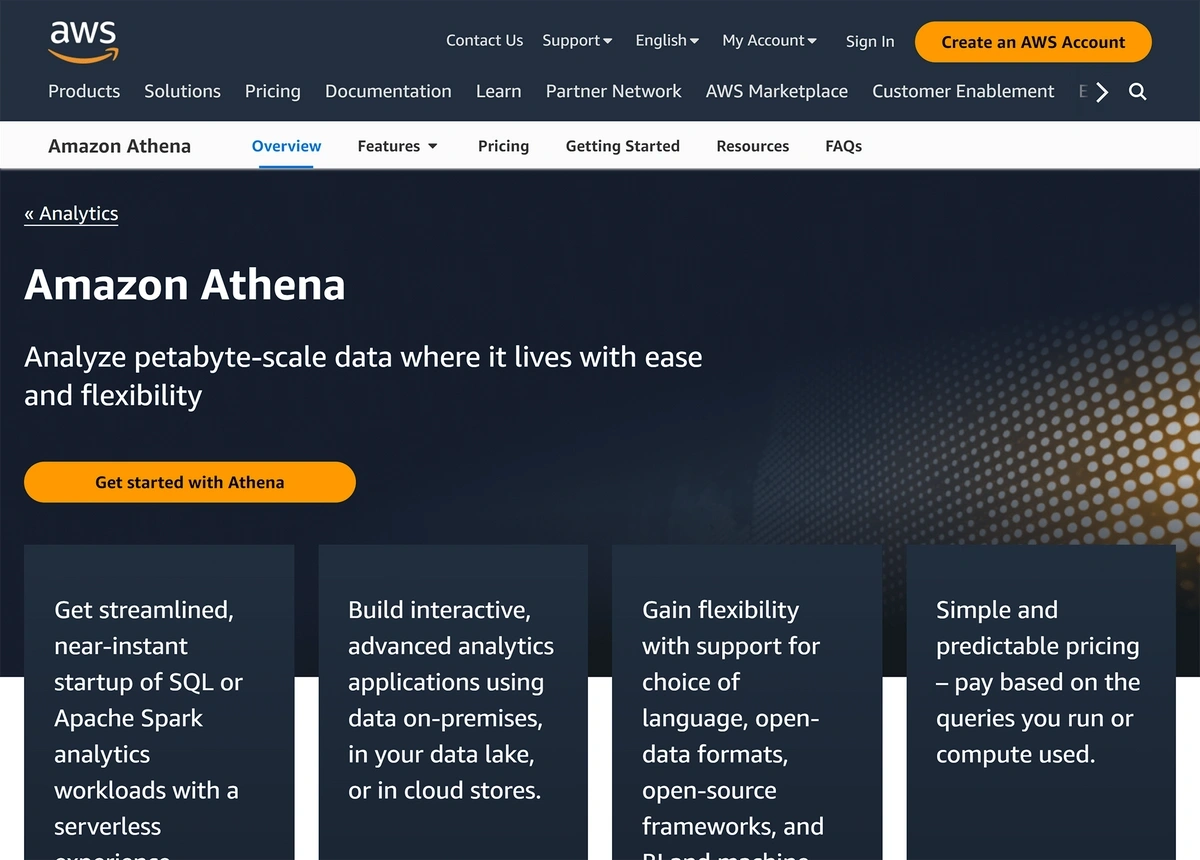
You can use Amazon Athena to access data stored in AWS servers, as well as other storage services like Snowflake.
By using standard SQL, you can pull large data sets from within Amazon Athena and its connected sources—then export and work with that data as a CSV, JSON, or other file.
Amazon Athena users can also use the platform in conjunction with Amazon SageMaker, a tool for building and training machine learning models. By connecting the two services, Athena users can use SQL queries to execute machine learning models created in SageMaker.
One benefit of Amazon Athena is that it can scale easily, so users won't experience slowdowns or issues when their data sets become larger, or their queries become more complex.
The tool is priced on a per-use basis. Amazon will bill you for the number of terabytes (TB) used to execute each query made in Athena. For example, someone in the eastern United States will pay $5.00 per TB of data scanned by the tool. The price per TB may vary based on user location.
Amazon Athena At a Glance
| Starting price | Varies by location and usage |
| Best for | Machine learning |
| Key features | Execute machine learning applications via SQL commands |
| Notable integrations | Amazon SageMaker, Amazon Redshift, Snowflake, Oracle, on-premises data sources |
12. Microsoft Power BI
Microsoft Power BI is another data visualization tool.
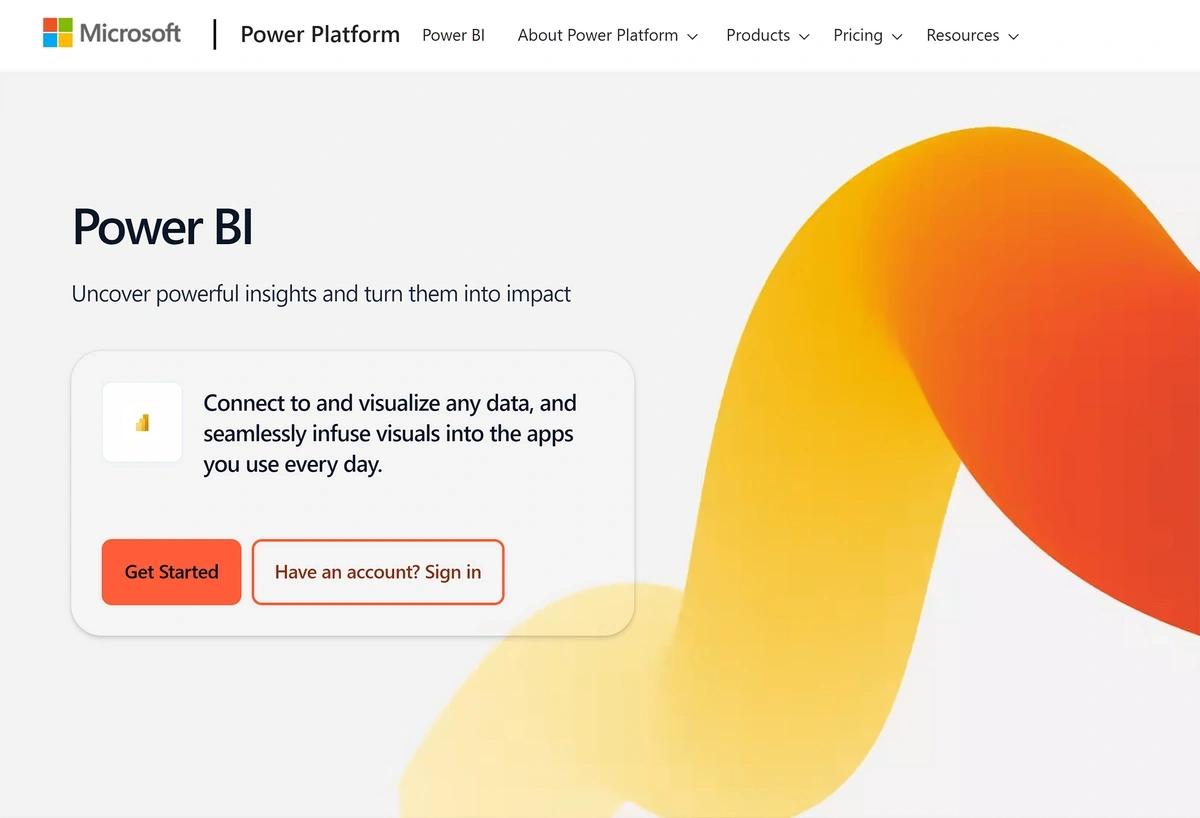
As with Domo and Zoho Analytics, Microsoft Power BI allows you to pull data sets into the tool from multiple external sources. This data then goes in your OneLake data hub.
From there, you can use Power BI to create custom data visualizations—and then share these visuals across a company's Microsoft services.
For example, a Power BI user could pull newly created charts into Microsoft Teams, Outlook, or PowerPoint, and even share BI data with Excel.
If your company uses the Microsoft 365 suite of applications to run its business operations, then Power BI will likely be one of the more seamless options for using and presenting your data in new ways.
It offers some of the self-service capabilities of Holistics, but within the familiar Microsoft app interfaces your teams are already comfortable with.
There's no charge to try out Power BI and begin creating interactive esports. To share reports and data, you'll need a paid plan—options start at $10 per user, per month.
Microsoft Power BI At a Glance
| Starting price | Free |
| Best for | Collaborative data analysis |
| Key features | Direct integration with Microsoft 365 applications like Outlook |
| Notable integrations | Google Analytics, Twilio |
Conclusion
There isn’t one right business intelligence software solution for every company—and some businesses will find that they need a combination of tools for research, storage, and data visualization.
But there’s one thing that’s true for all BI software, and that’s that they require data in order to work. Without data to analyze, your BI tools of choice won’t be much use.
Learn more about the top market intelligence software tools and big data trends that can impact the way you find the type of information that can help push your business intelligence forward.
Stop Guessing, Start Growing 🚀
Use real-time topic data to create content that resonates and brings results.

Exploding Topics is owned by Semrush. Our mission is to provide accurate data and expert insights on emerging trends. Unless otherwise noted, this page’s content was written by either an employee or a paid contractor of Semrush Inc.
Share
Newsletter Signup
By clicking “Subscribe” you agree to Semrush Privacy Policy and consent to Semrush using your contact data for newsletter purposes
Written By


Josh is the Co-Founder and CTO of Exploding Topics. Josh has led Exploding Topics product development from the first line of co... Read more