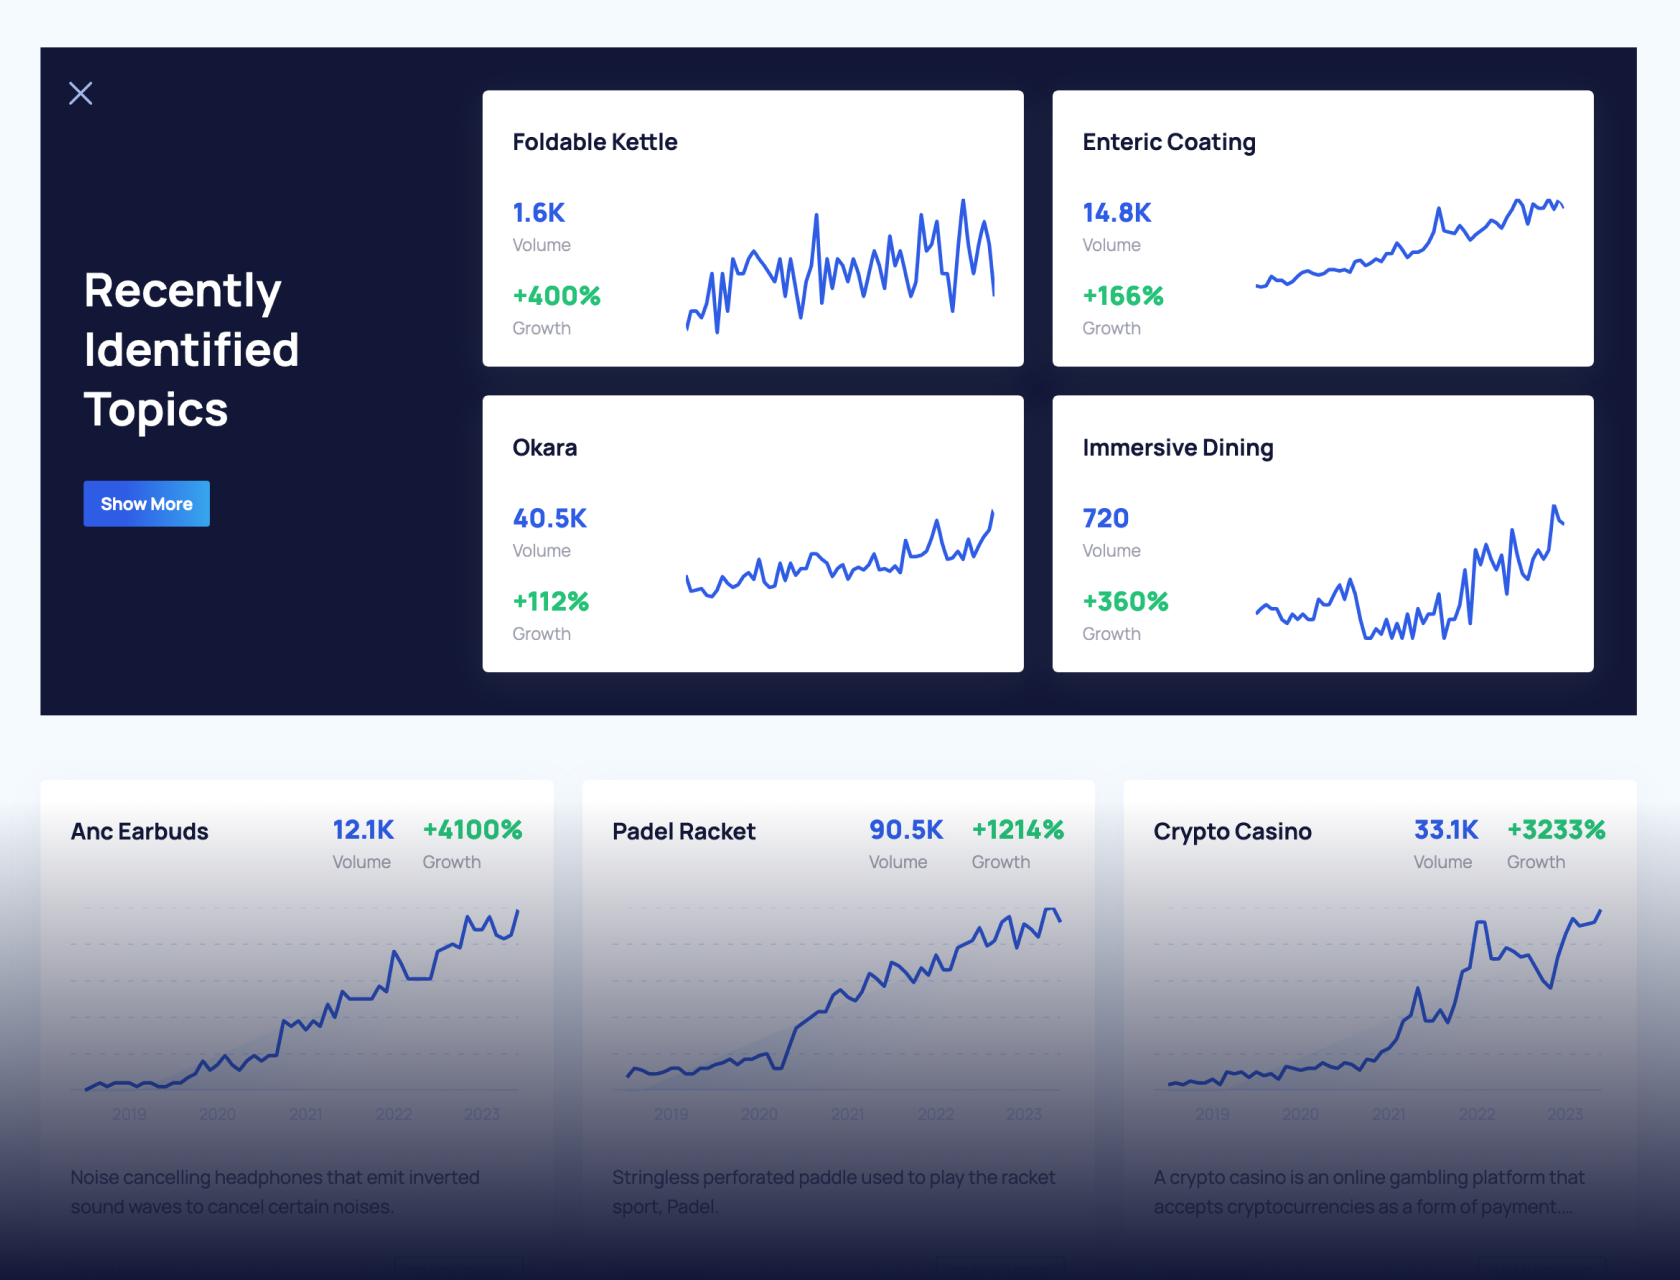
Get Advanced Insights on Any Topic
Discover Trends 12+ Months Before Everyone Else
How We Find Trends Before They Take Off
Exploding Topics’ advanced algorithm monitors millions of unstructured data points to spot trends early on.
Features
Keyword Research
Performance Tracking
Competitor Intelligence
Fix Your Site’s SEO Issues in 30 Seconds
Find technical issues blocking search visibility. Get prioritized, actionable fixes in seconds.
Powered by data from
7 Top Data Analytics Trends In 2024
You may also like:
Over the last decade, data has emerged as a transformative force.
Enterprises that give their leaders the tools they need to analyze data and the platforms they need to make data-driven decisions can truly harness the power of data. Businesses that don’t do this miss out on a critical competitive edge.
In this article, read about the top seven trends in data analytics including AI, edge computing, data mesh, and more.
1. Implementing AI in Data Analytics
The rise of artificial intelligence (AI), in particular machine learning (ML), is increasing the speed and scale of data analytics operations.
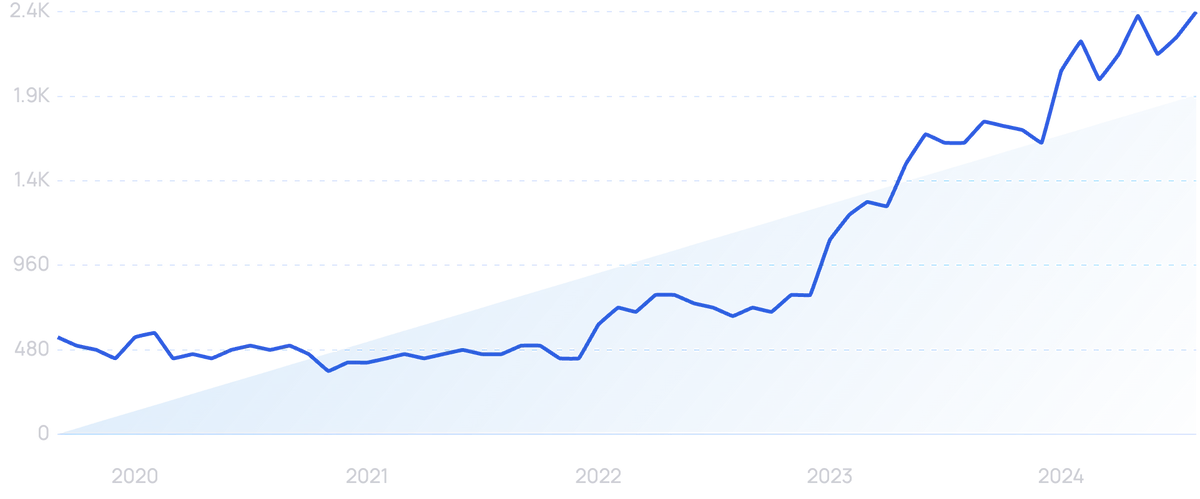
Search volume for “AI analytics” is growing, already up 335% over the past 5 years.
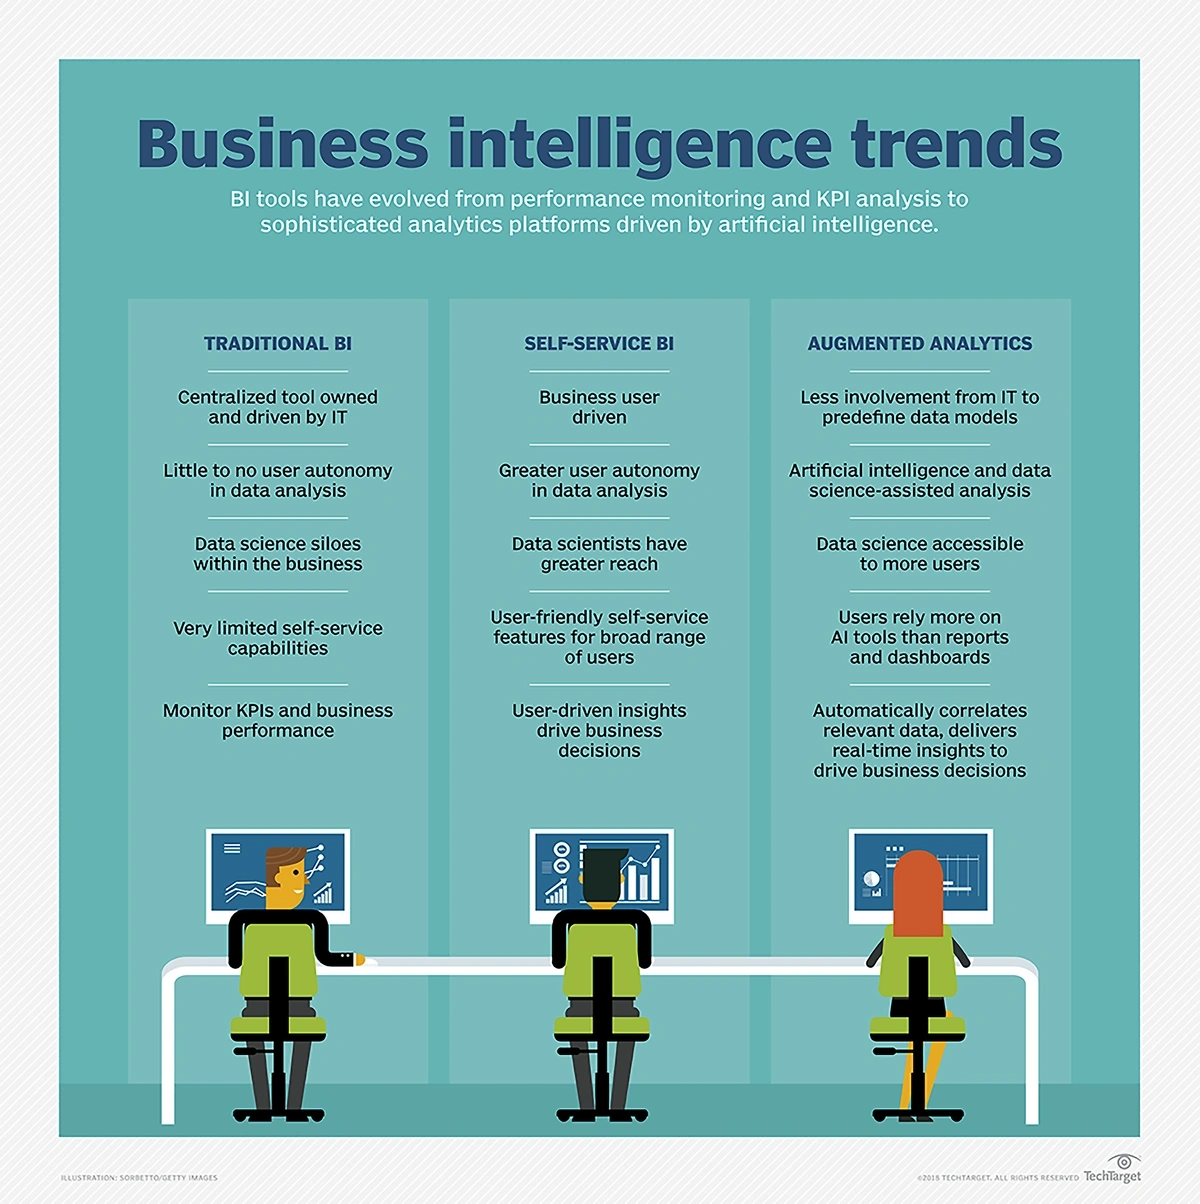
Traditional analytics requires a team of IT analysts to comb through data, theorize potential insights, test those insights, and report on their findings.
Traditional BI heavily relies on IT, but ML-powered analytics puts the data in the hands of business users.
However, ML-based models can continuously monitor data, pick out anomalies, and alert the appropriate teams in real time — without any human input needed.
ML models can look at any data subset and produce insights. They can look for correlations between millions of data points.
These systems are also quite accurate.
When data analytics platforms utilize ML and automate many of the traditional tasks associated with analytics, it’s called augmented analytics.
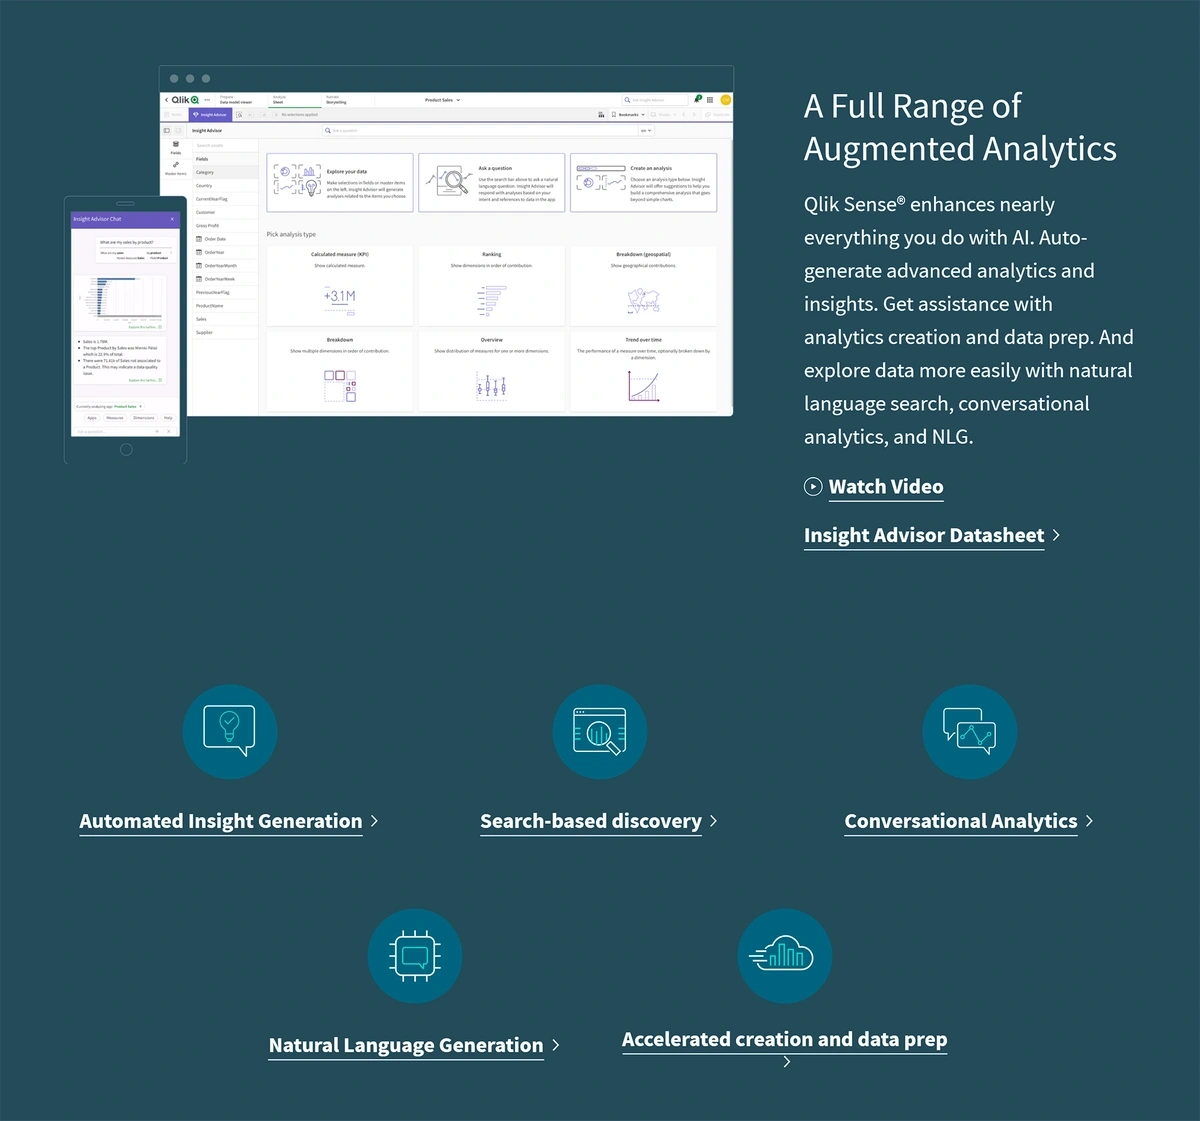
Qlik, a popular data analytics platform, offers augmented analytics that can be leveraged by everyday business users as well as data scientists.
With augmented analytics, employees can use natural language to delve into the company’s data.
Importantly, team members don’t need to have a hypothesis in mind. That's because ML algorithms automatically uncover the insights users need.
And if team members need to extract insights from a data set, they can now use generative AI tools like ChatGPT.
For example, a team member can create a custom LLM based on internal data and ask AI questions like "How many customers did we have from Iowa in 2024?".
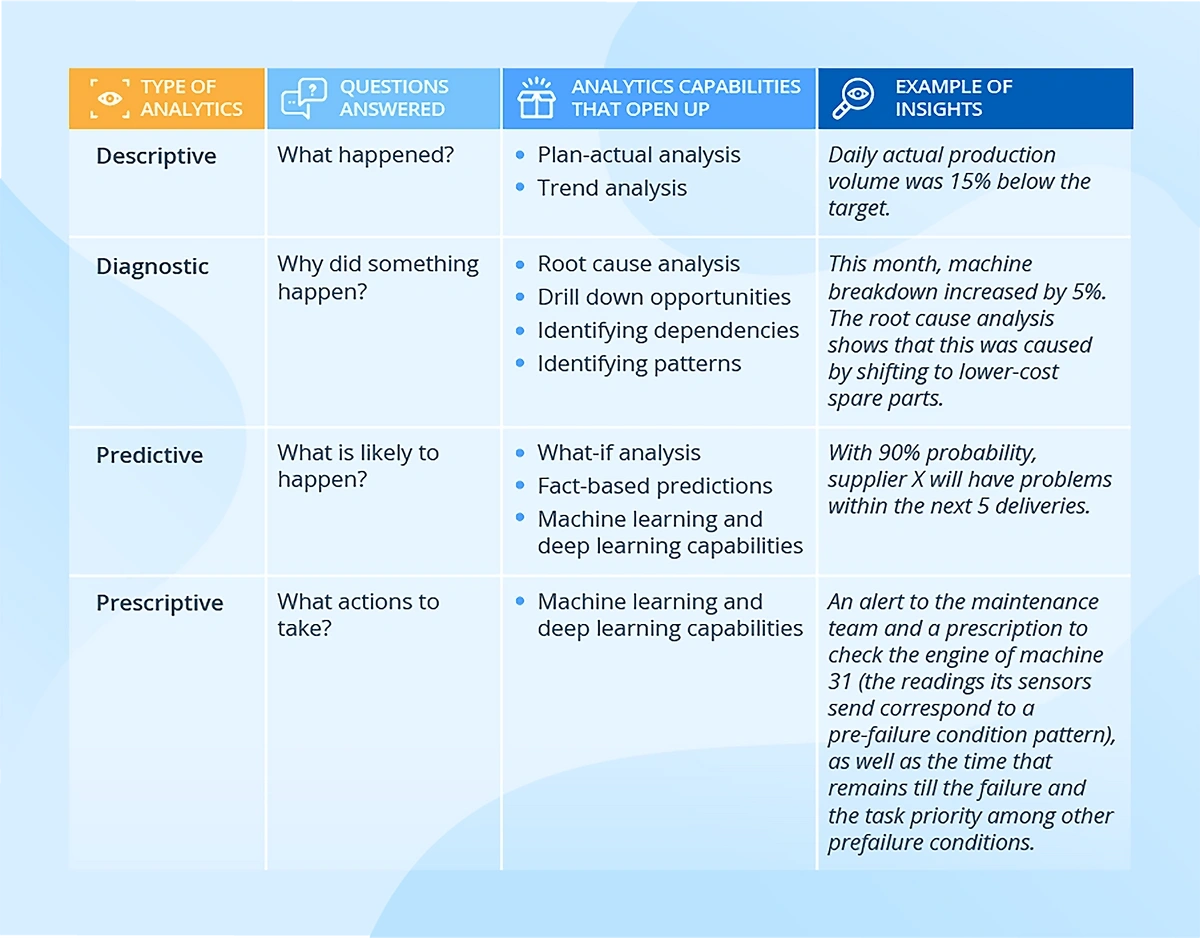
Augmented analytics can also be used for countless business processes like forecasting, predictive analytics, modeling, and visualizations.
One important advantage of augmented analytics is that AI/ML platforms can make sense of unstructured data.
That includes phone calls.
For example, University Hospitals in Cleveland, Ohio, receives more than 400,000 phone calls per month.
Before they began using an AI data analytics platform, listening to these phone calls and documenting what occurred was the task of several employees.
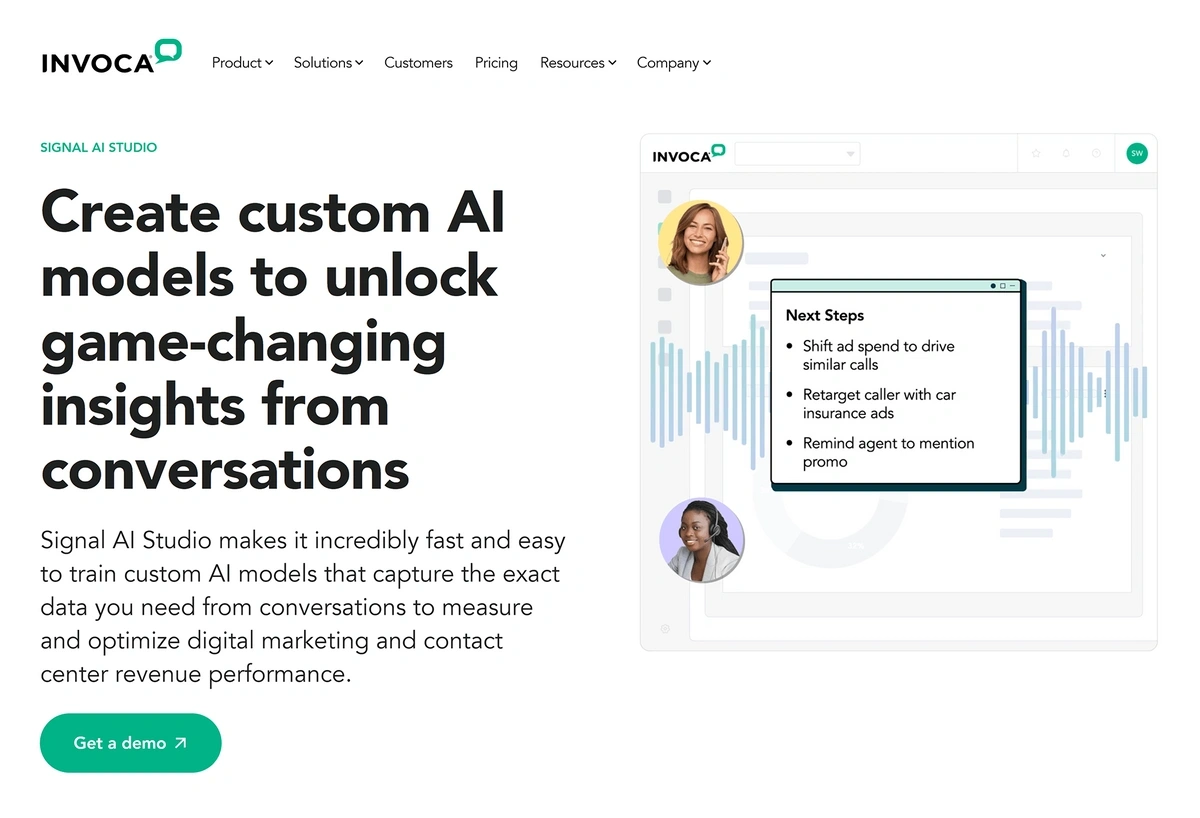
After University Hospitals implemented an augmented analytics platform from Invoca, they could begin automatically monitoring calls via the AI platform.
They’ve saved at least 40 hours per week in employee labor.
Invoca’s platform detects conversions and call outcomes.
Augmented analytics can also guide enterprises in optimizing pricing strategies and forecasting demand.
For example, an AI model can analyze customer data to uncover patterns in purchasing behavior and utilize dynamic pricing in order to increase revenue.
Augmented analytics can also monitor competitor data so that organizations can optimize their pricing accordingly.
The market for augmented analytics is growing rapidly.
Research and Markets estimates it will grow at a CAGR of nearly 26% through 2027, reaching a valuation of more than $32 billion that year.
2. Using Business Intelligence to Gather Insights
Business intelligence tools harness raw data in order to extract meaningful patterns and actionable insights.
Many of today’s popular BI platforms take advantage of AI/ML capabilities to deliver insights to business users.
These insights can lead to identifying issues, spotting trends, or finding new revenue sources.
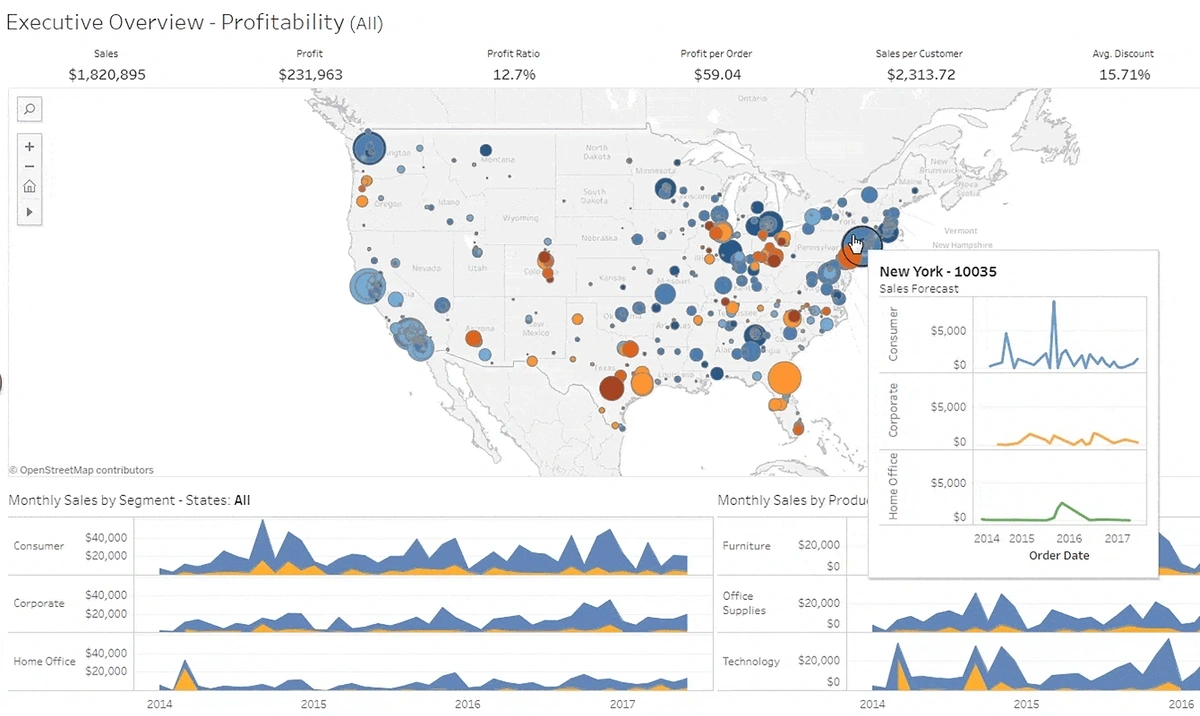
Data mining, querying, reporting, and visualization are all part of a BI system.
An example of visual analytics from a BI platform.
Many business leaders consider BI imperative for organizational survival and success.
About one-quarter of organizations are currently using BI. That number grows as high as 80% when considering organizations with 5,000+ employees.
Consider Delta Airlines – the employer of nearly 90,000 individuals.
The company has invested over $100 million in a BI platform that tracks baggage handling.
The data intelligence gained from that platform guides Delta teams in figuring out issues and delays related to baggage — a huge source of stress for customers.
However, the application of BI can be valuable at nearly every stage of the customer journey.
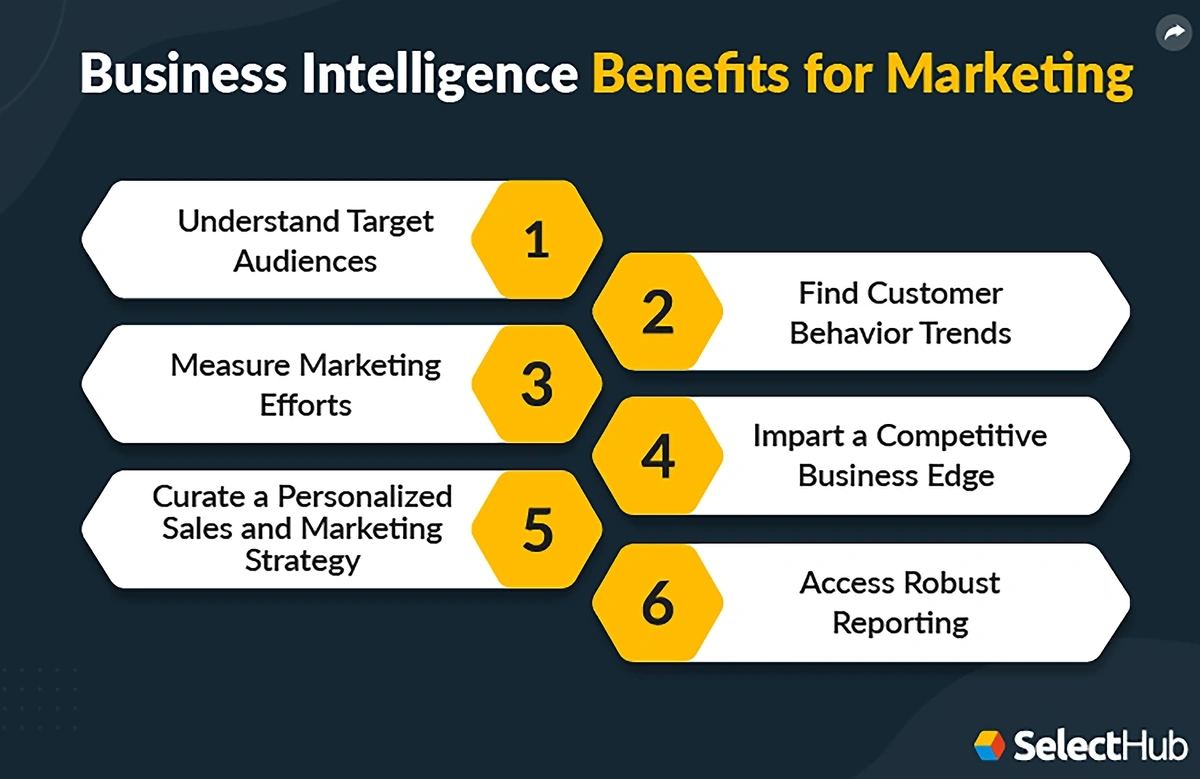
Businesses can improve the performance of their marketing campaigns by integrating analysis from BI platforms.
Organizations can use BI to create buyer personas and segment customer groups.
With all of this data, enterprises are able to create personalized sales and marketing campaigns.
In another example, BI platforms are a critical part of the digitization of the manufacturing industry.
BI platforms can help manufacturing organizations improve supply chains, avoid delays, and increase profitability.
These tools give manufacturers a data-driven method for streamlining production while keeping quality high.
BI can even be instrumental in handling supply chain disruptions and expenses.
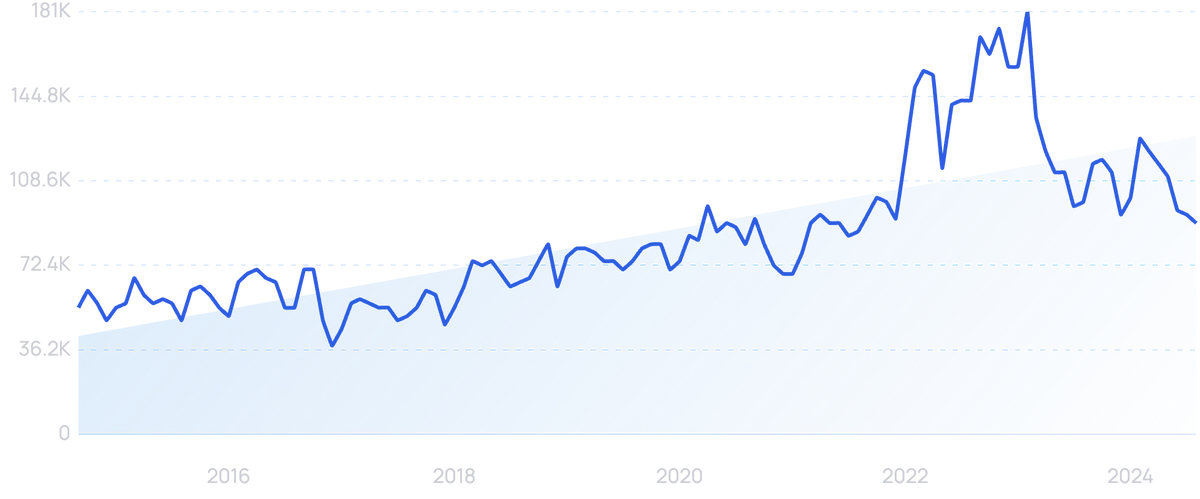
When organizations want to present their data in a way that’s easy to understand, they’re turning to their BI platforms to create data visualizations. This allows for more effective data storytelling.
Search volume for “data visualization” jumped in late 2022.
These visualizations are things like charts, graphs, maps, and the like.
One of the most popular BI systems, Tableau, has a wealth of data visualization options for users.
And, the company provides a free platform called Tableau Public where users can get inspiration for their own data visualizations.
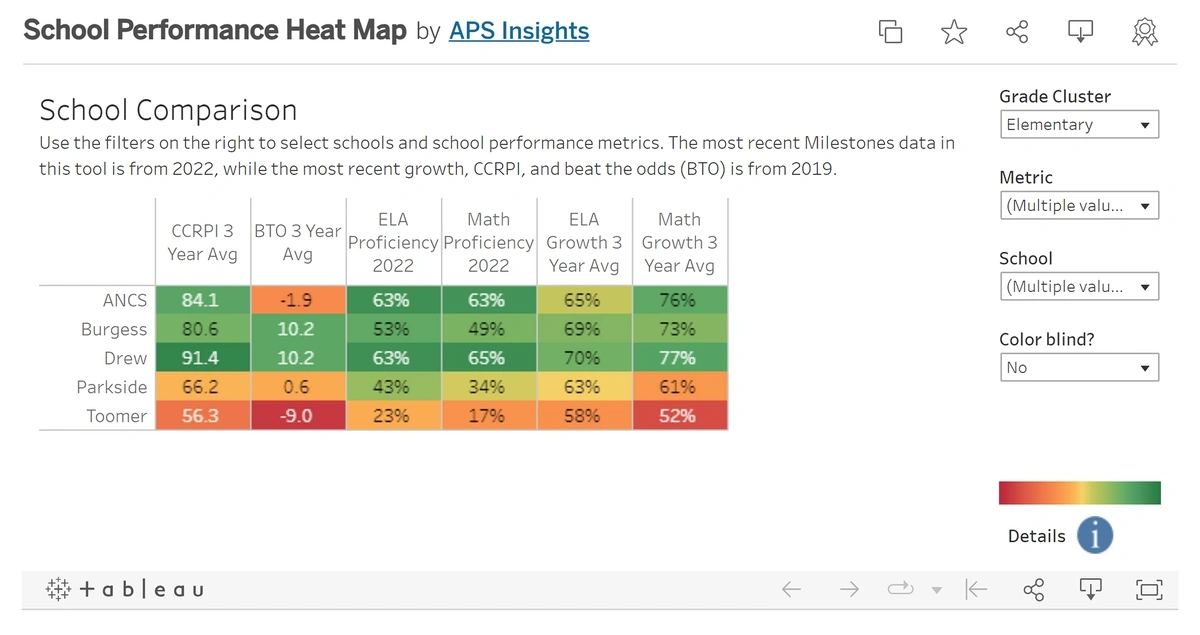
Users can create box-and-whisker plots that provide a quick way to see data distribution, heat maps that show specific data as specific colors, and tree maps that nest rectangles together in order to display hierarchical data.
Heat maps assign colors to sets of data so that viewers can quickly take in the impact of the data.
With such a diverse array of applications, BI is on the way to becoming a universal standard for enterprises.
According to Fortune Business Insights, the business intelligence market could reach $54.27 billion by 2030, a $27 billion increase over 2022.
3. More Use Cases for Edge Computing
With the explosion of data in recent years and the need for real-time analytics, many enterprises are moving their data analysis to the edge, handling the data at the device that generates it.
By 2025, Gartner predicts more than 50% of critical data will be created and processed outside of the enterprise’s data center and cloud.
It will instead be processed in an edge computing environment.
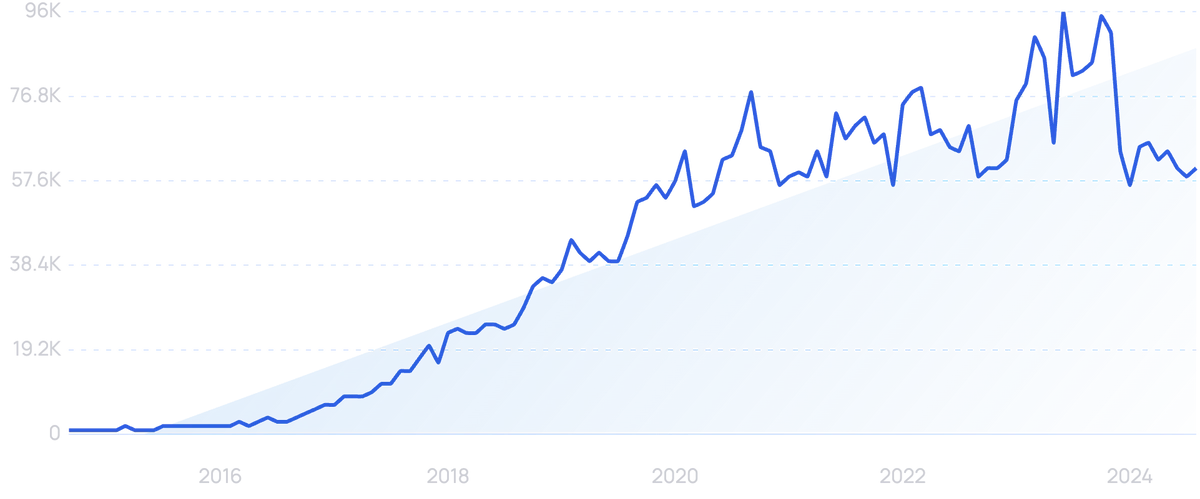
Search volume for “edge computing” is up more than 6,200% over the last 10 years.
According to an analysis from EdgeIR, global spending on edge computing will reach $232 billion by the end of this year. That’s a 13.1% increase over 2022.
Why the rapid transition toward edge computing?
The world today generates more than 400 million terabytes of data each day from a total of 24.4 billion connected devices.
By 2025, the world’s data will exceed 180 zettabytes from over 30 billion connected devices.
Also, small, open-source AI models are making it increasingly possible to run LLMs locally.
(Albeit limited compared to the top AI platforms like Claude and Perplexity).
As the wealth of data has grown, many organizations have transitioned to data storage in the cloud.
However, even conventional cloud computing is under-equipped to handle the vast, ever-growing ocean of real-world data generated daily.
Limitations in bandwidth, lag in data relay, and network disruptions can cripple critical industrial and commercial data processes.
This, in turn, escalates operating costs and risks.
The better alternative, data industry experts say, is edge computing.
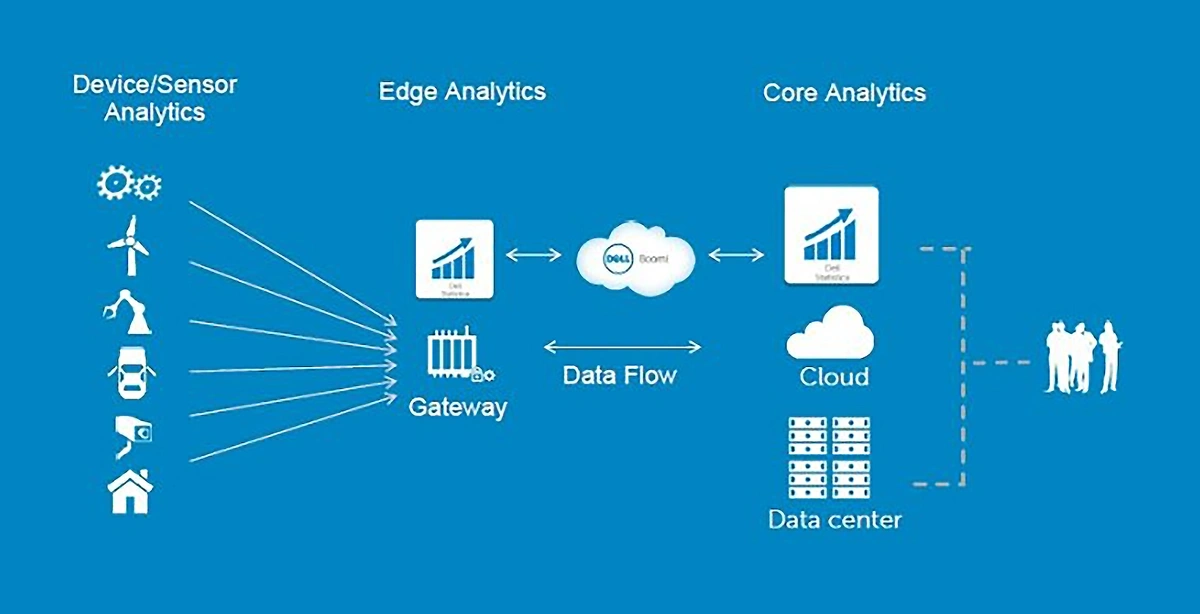
Edge computing involves processor-intensive, often repetitive, mission-critical data analytics within devices on the outer edge of a network.
Only data summaries are sent to “fog” nodes, which are then passed to cloud storage for higher-level processing.
Edge analytics streamlines data analytics and provides real-time insights.
Utilizing edge computing means analytics are delivered in real time. This is critical for enterprises that depend on rapid responses like healthcare and manufacturing.
But it can also filter out the information that’s not needed — estimates show that up to 90% of deployed data is useless.
This data does not get transferred to the cloud, saving bandwidth and budget.
Edge computing also has the benefit of increased privacy and data protection. Since data is never sent to the cloud, it’s more secure.
Edge analytics are an important part of the Industry 4.0 revolution.
Industrial settings have a vast number of IoT devices that generate large volumes of data every day.
In order to be useful, that data must be processed in milliseconds.
Routing data to the cloud and back doesn’t make sense in this setting, but edge computing does.
Data like temperature, humidity, vibrations, and the like can be analyzed immediately and discarded if not needed for long-term analysis.
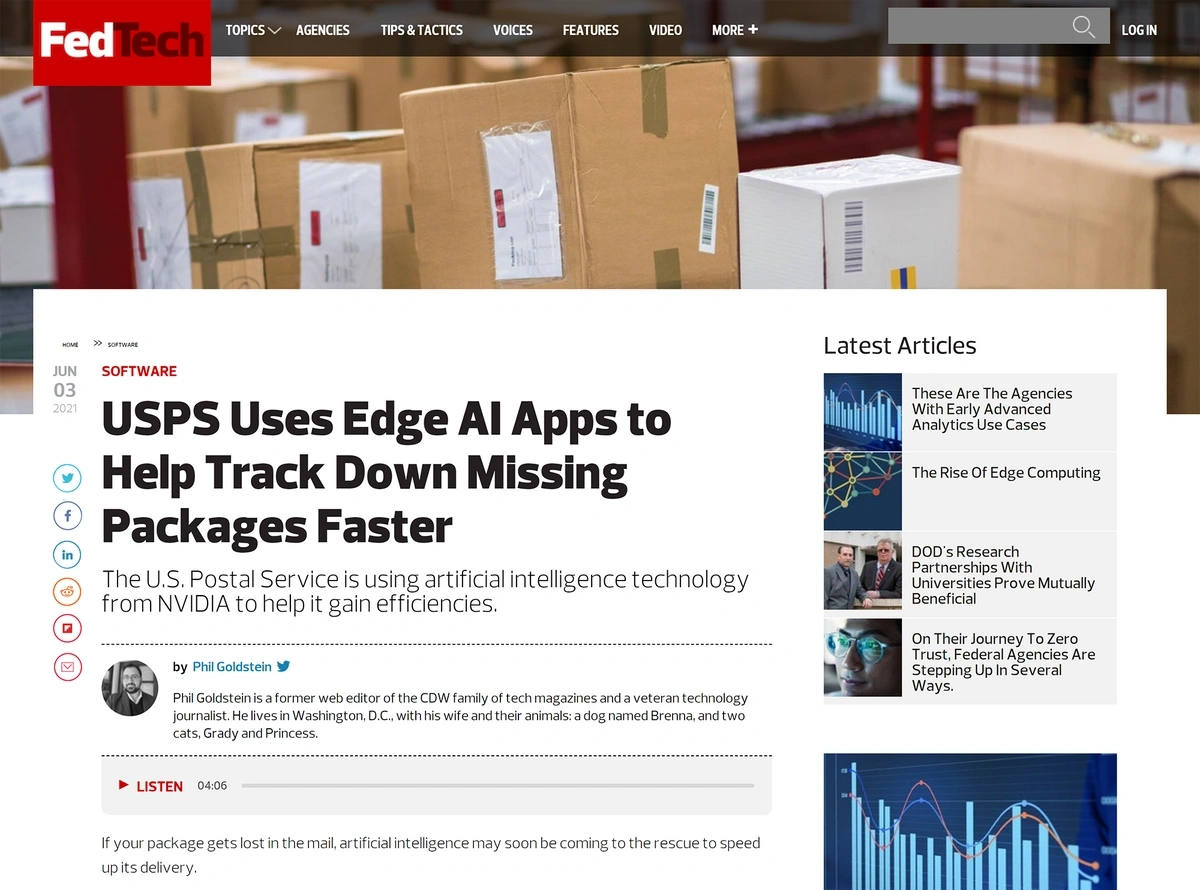
Even the United States Postal Service is taking advantage of edge analytics.
Edge analytics is helping the USPS find missing packages.
The organization uses edge analytics to process millions of package images (each edge server processes 20 terabytes of images per day) in order to hunt down missing packages.
USPS officials say this task used to take the work of 8-10 people over the course of several days to find missing packages. With edge analytics, it takes just one person and a few hours.
4. Increasing Reliance on Data-as-a-Service
As more data is generated daily, it is becoming apparent that every business must utilize data to stay competitive.
Still, not every business has the ability to source, store, and analyze data as easily as the largest tech companies.
That is where Data-as-a-Service (DaaS) comes in.
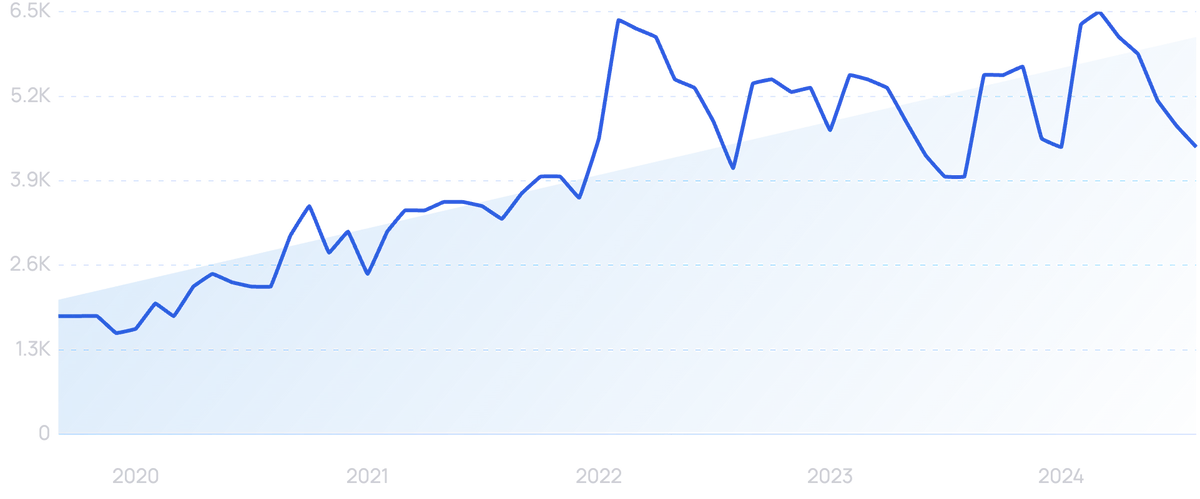
Searches for “Data as a Service” have grown 143% in the past 5 years.
DaaS companies typically offer data collection, storage, and analysis services on a subscription basis.
It runs via cloud computing and delivers services to end users over the network instead of having the data analyzed or stored locally.
Depending on the customer, the DaaS provider could collect and utilize internal data that is native to the customer or supply the customer with datasets it might not have access to on its own.
As more of the business world moves to cloud-first technology, it seems likely that the switch to DaaS will be swift as well.
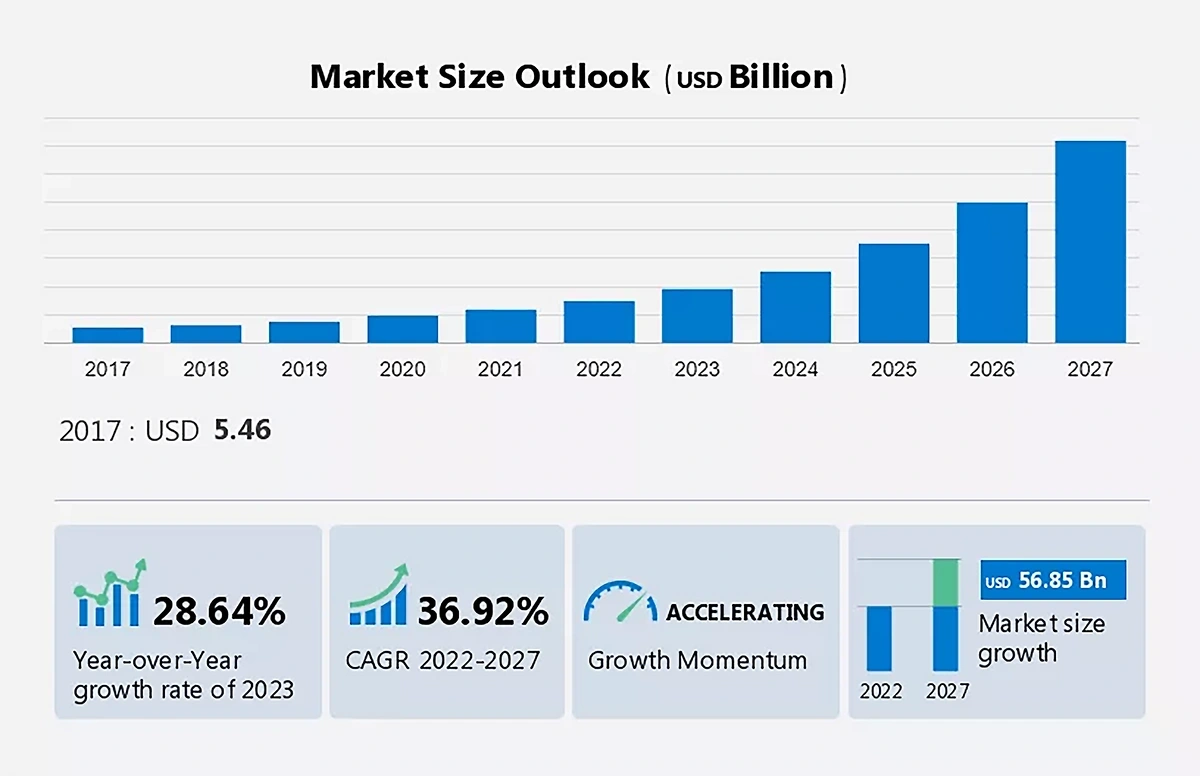
In fact, Technavio estimates the DaaS market will add $56.85 billion in value before 2027.
The DaaS market is expected to grow at a CAGR of nearly 40% through 2027.
Snowflake is one of the largest and most popular companies in this market.
The company is famous for its data warehousing services, but it can also act as a pure DaaS provider.
Snowflake allows customers to store and analyze data on its platform but also hosts vendors selling data products to end users through its platform.
On its platform, the company offers more than 2,800 active data sets.
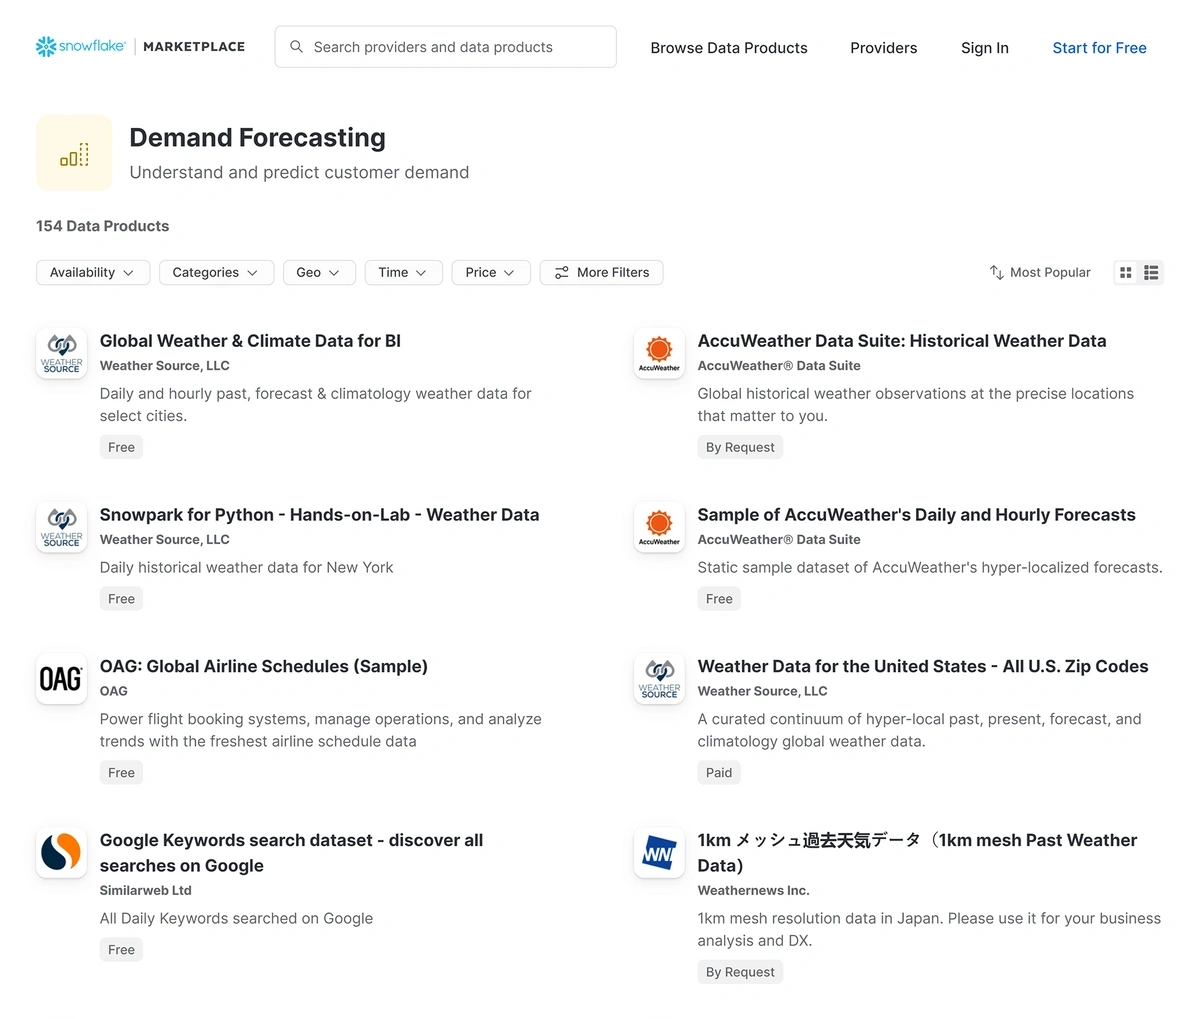
A sample of Snowflake’s marketplace shows 154 available data products in the demand forecasting category.
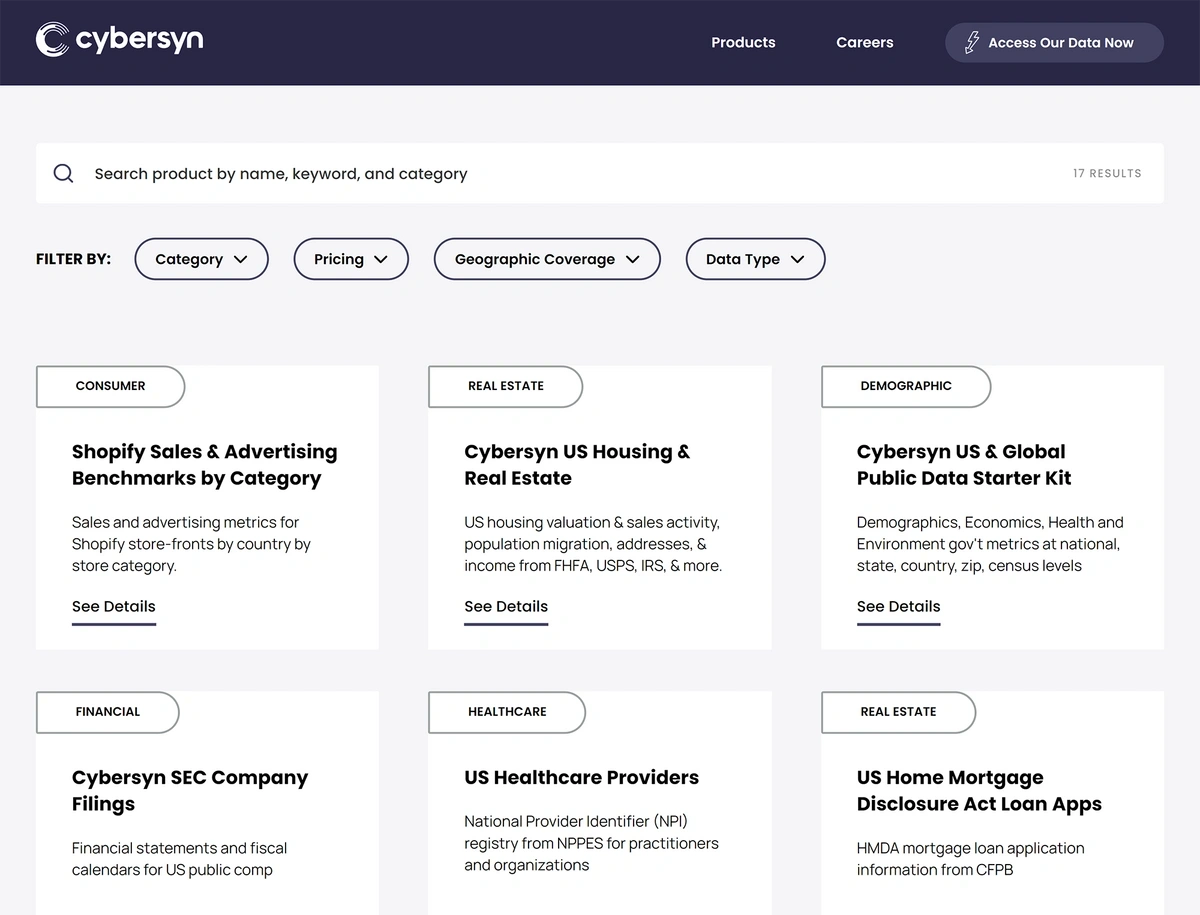
Snowflake also recently invested in a New York-based company called Cybersyn during a $62.9 million Series A funding round in April 2023.
The company is focused on bringing together public and proprietary economic data to create datasets and sell them to third parties.
Cybersyn offers datasets related to healthcare, home mortgages, retail, and other industries.
5. The Democratization of Data Systems
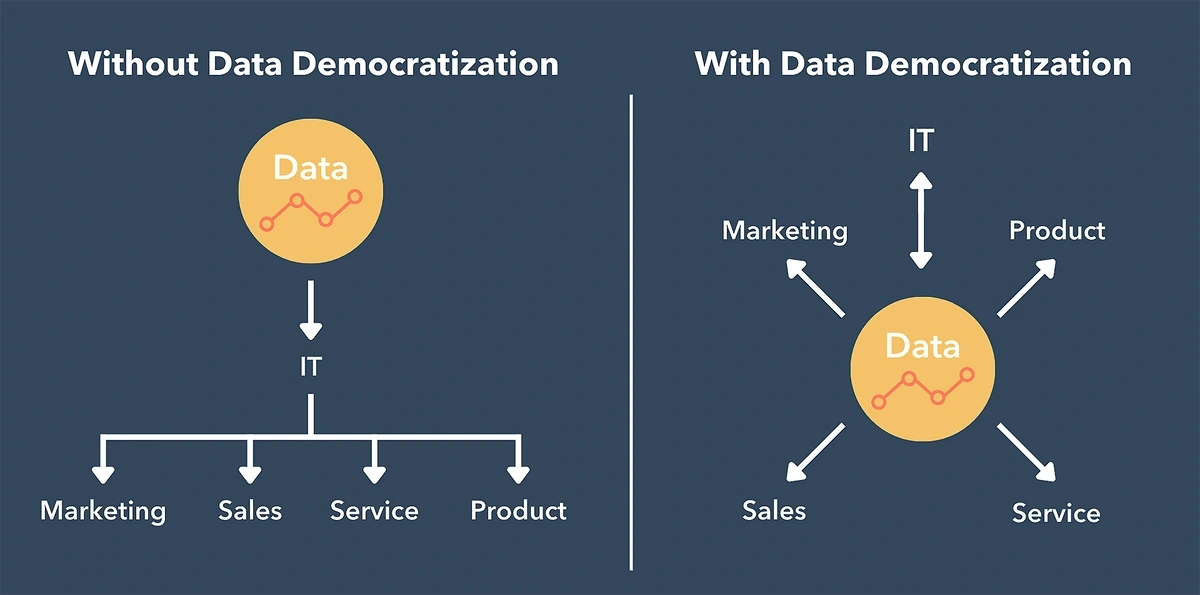
In a modern enterprise, data is often siloed.
It’s stuck in one department and other business users miss out on the value of that data.
That’s why data democratization is such an important trend for businesses. It involves opening up information so it’s available to everyone in an enterprise regardless of their technical expertise.
Data democratization enables end users to access the insights they need without needing to wait for IT to grant access.
In one survey, 80% of business leaders say having access to data improves decision-making.
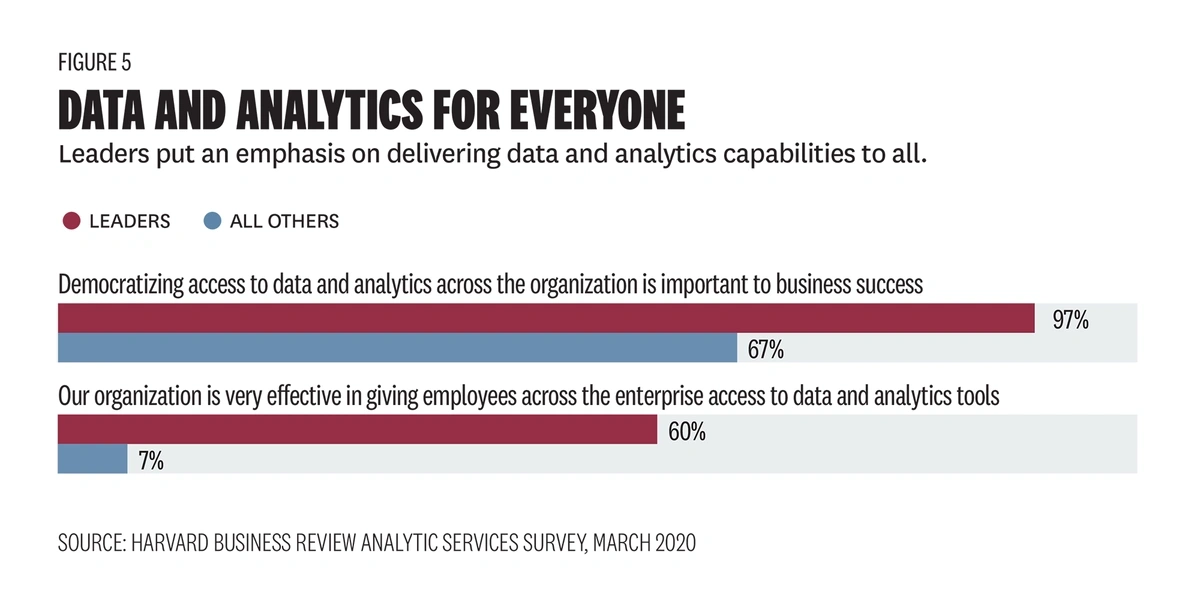
A Harvard Business Review survey found that 97% of business leaders say democratizing data is important to the success of their business.
But there’s still a long way to go. Only 60% of them say their organizations are effective at granting employees access to data and the tools they need to analyze it.
Nearly all respondents said data democratization is critical for business success.
Putting the data in the hands of decision-makers means that many employees in the company become citizen data scientists, people who can analyze data but don’t take on that task as their primary role.
Coca-Cola has invested in upskilling managers in order to create more citizen data scientists in their organization.
In the first year of the program, they trained more than 500 people in digital skills such as data analytics. They have plans to roll out the program to more than 4,000 employees in the coming years.
Beyond executing new training programs, enterprises are also selecting self-service data analytics tools that enable employees to query and analyze data without any prior training.
Alteryx offers a variety of data analytics software options that are accessible to ordinary end-users.
Their platform offers a code-free, intuitive way to dig into the data. The platform utilizes ML and NLP, but Alteryx also recently released generative AI features.
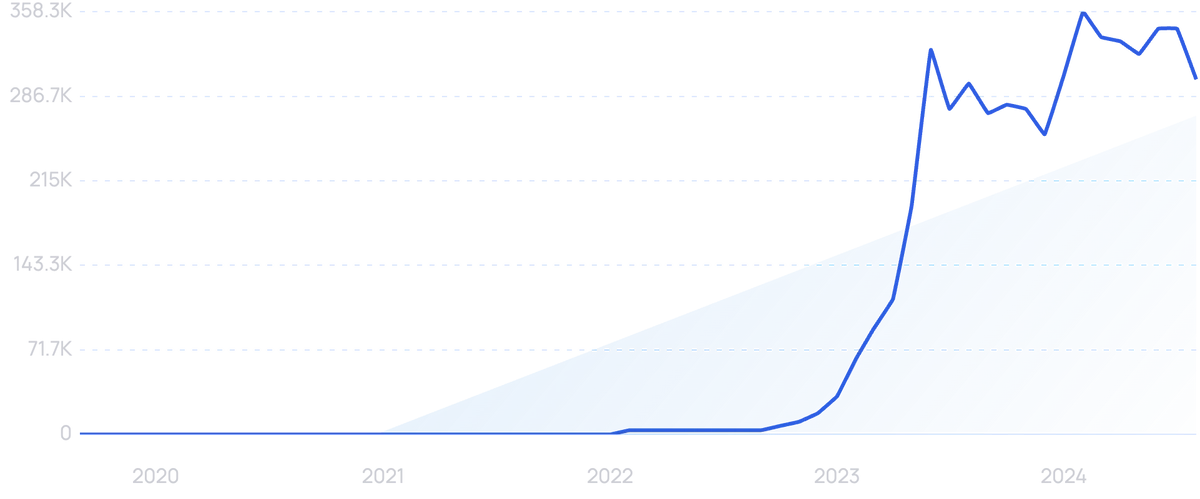
Search volume for “generative AI” is exploding.
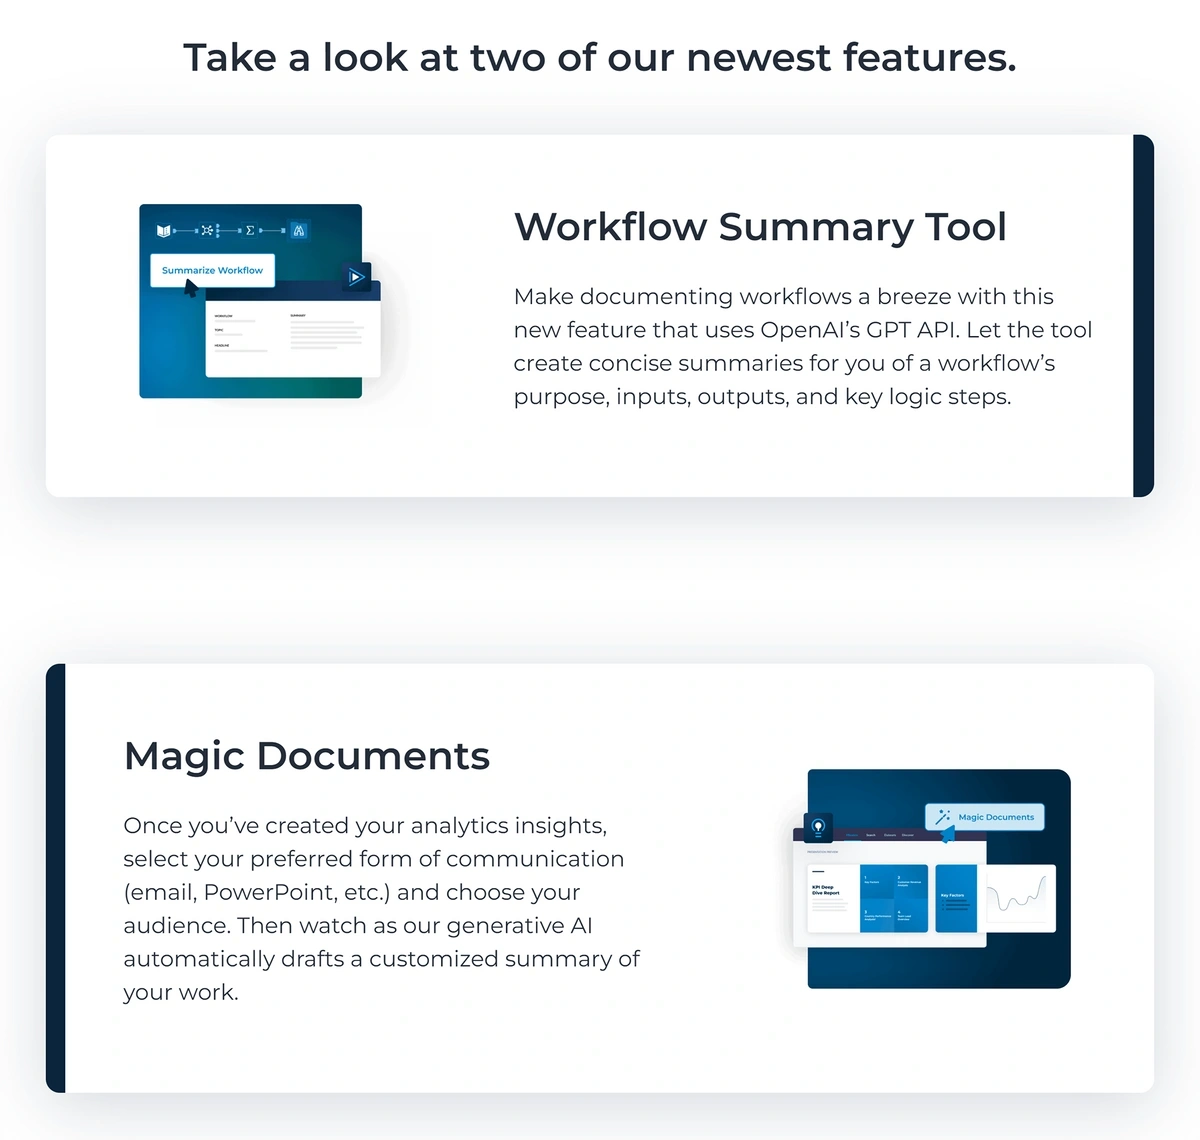
These features are being implemented as “Magic Documents” that automate summarizations of data insights and a “Workflow Summary” that uses ChatGPT to document workflows.
The platform will also get an OpenAI connector that serves as an open-ended generative AI solution for businesses.
The new generative AI features from Alteryx are focused on increasing the efficiency of analyzing data and generating reports.
6. Implementing a Data Mesh Architecture
Data mesh is an architecture that supports self-service analytics.
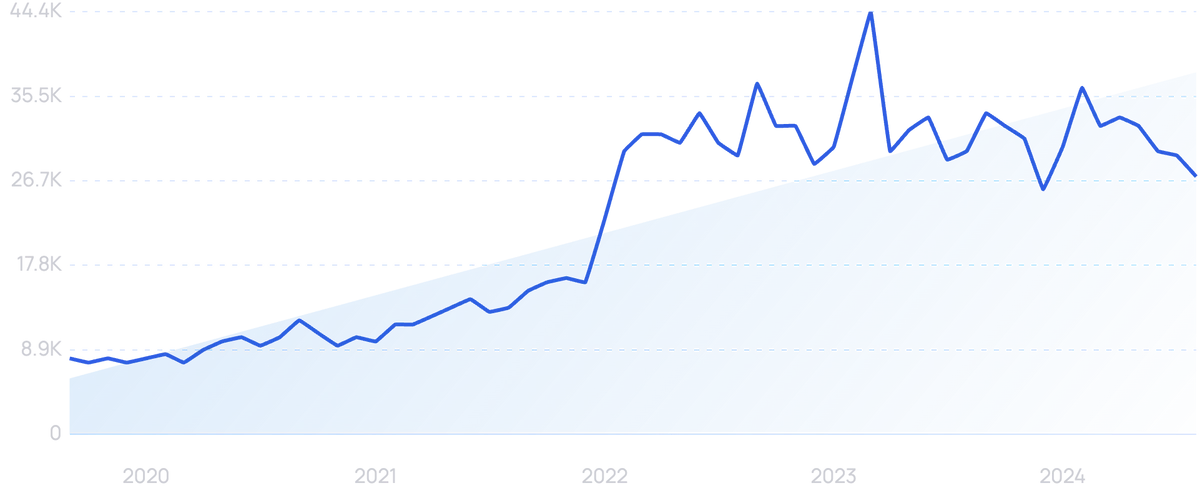
Search volume for “data mesh” has more than doubled over the past 5 years.
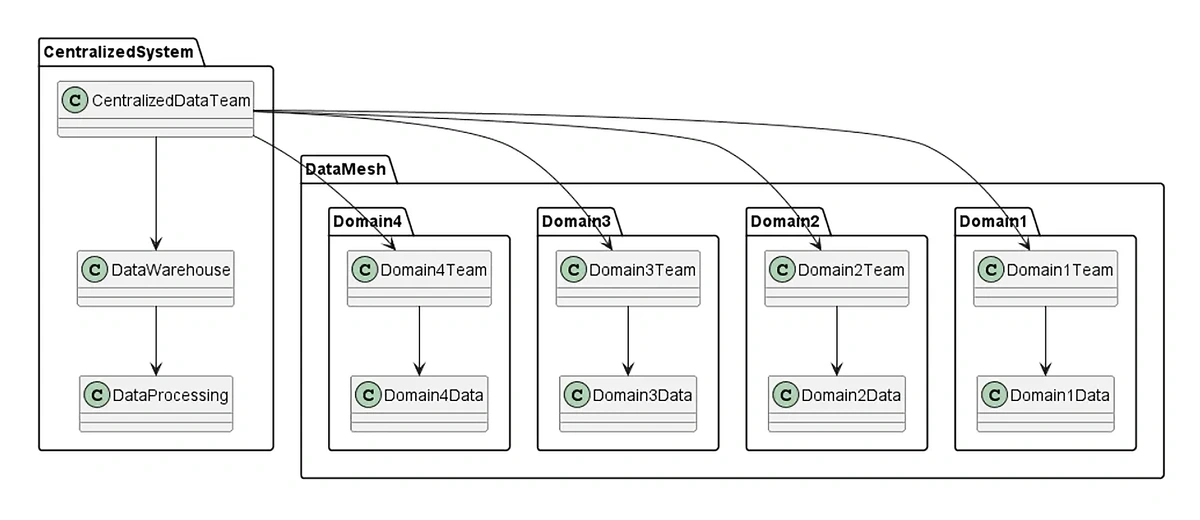
It’s an approach that advocates for decentralizing data ownership and management, treating data as a product, and establishing domain-oriented data teams.
The key idea behind data mesh is to distribute data responsibility across different teams within an enterprise. That enables the teams to take ownership of their own data domains and make data-driven decisions independently.
Governance is also embedded within domain teams rather than being imposed top-down. Each team has the autonomy to govern and manage their data products according to their specific domain requirements.
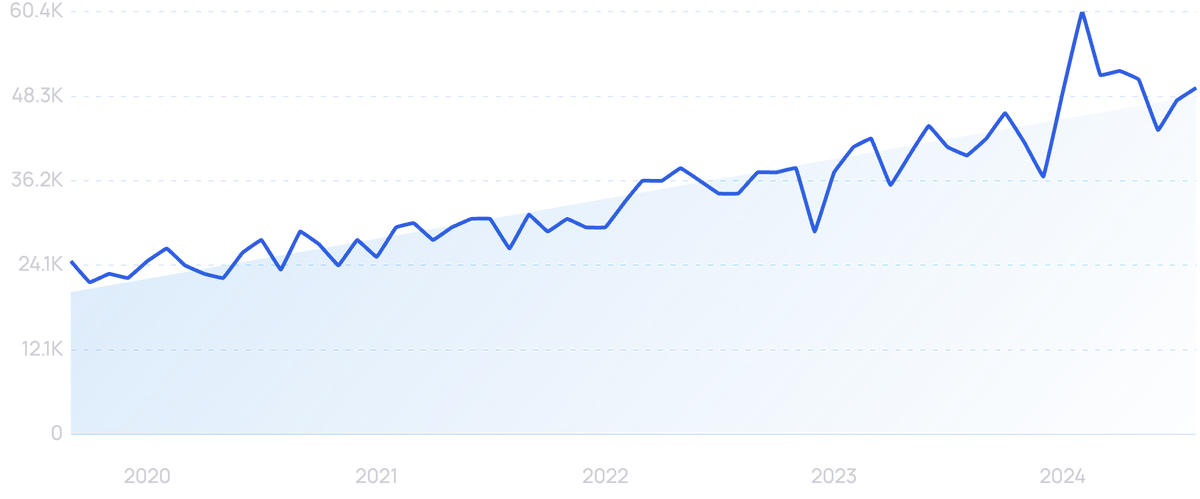
Search volume for “data governance” has increased by more than 100% in recent years.
Because data is distributed, each enterprise team can use the tools and technologies that make sense for their specific domain.
The inventory management team might use one system while the marketing and sales teams use a different tool.
The end result is that teams have the data they need and the tools they need to innovate, experiment, and engage in effective decision-making.
Data mesh offers a scalable and agile solution for enterprises handling large amounts of data.
A data mesh approach has several benefits for businesses: it’s more cost-efficient because it reduces the strain on the storage system; it facilitates interoperability; it increases security and regulatory compliance.
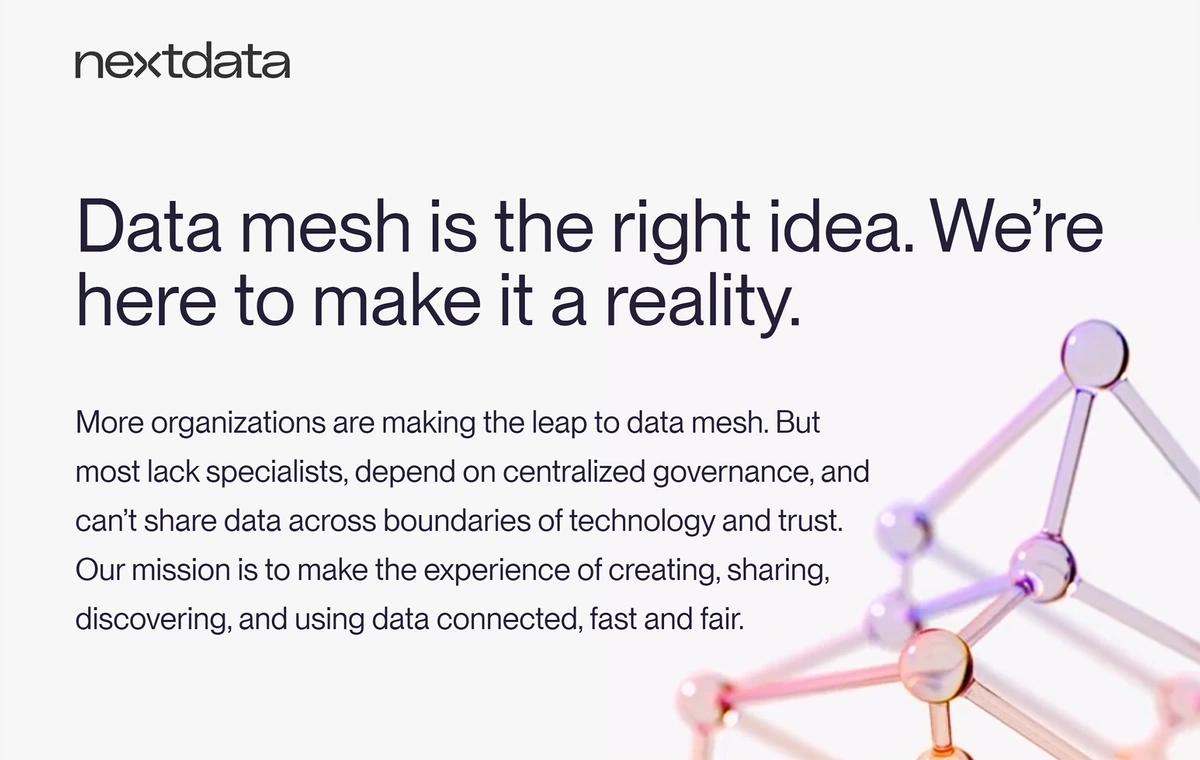
The person who first introduced the world to the concept of data mesh, Zhamak Dehghani, announced her own data company — Nextdata — in January 2023.
Nextdata aims to help enterprises decentralize data using the data mesh architecture and data product containers.
Nextdata offers enterprises a way to implement data mesh solutions.
Nextdata’s product is still in the design and testing phase.
One example of a data mesh architecture in action comes from the financial industry where data is incredibly valuable but sharing it comes with inherent security and privacy risks.
JPMorgan Chase Bank built a data mesh solution with the help of AWS.
Prior to integrating the data mesh, teams would need to extract and join data from multiple systems in multiple data domains in order to create reports.
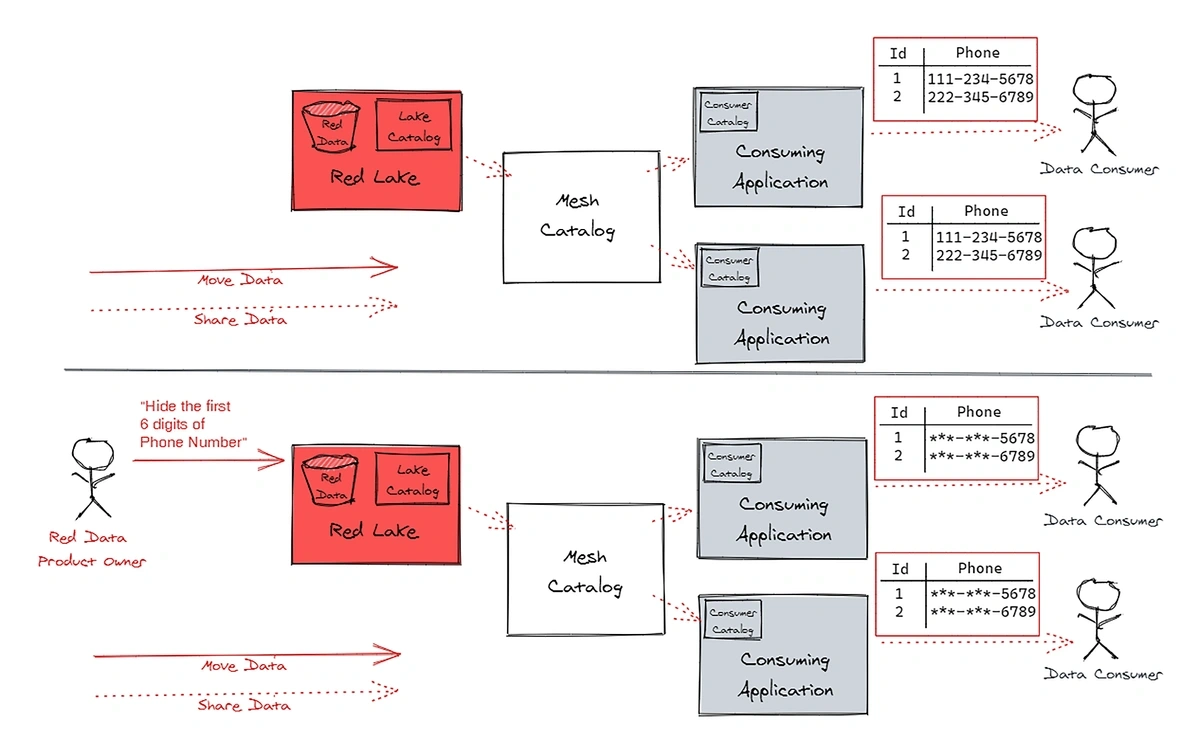
But with the data mesh, teams that own data make it available in data lakes. Other teams can find that data via the enterprise data catalog and request it.
Data flows directly from one team’s application to the other team’s application.
With a data mesh, teams can share data and trace where it originated.
7. Using Synthetic Data to Deliver High-Quality Data While Ensuring Privacy
Synthetic data is fake, generated by a computer program. It’s not based on any real-world person or event. But it’s becoming incredibly valuable to the field of data analytics.
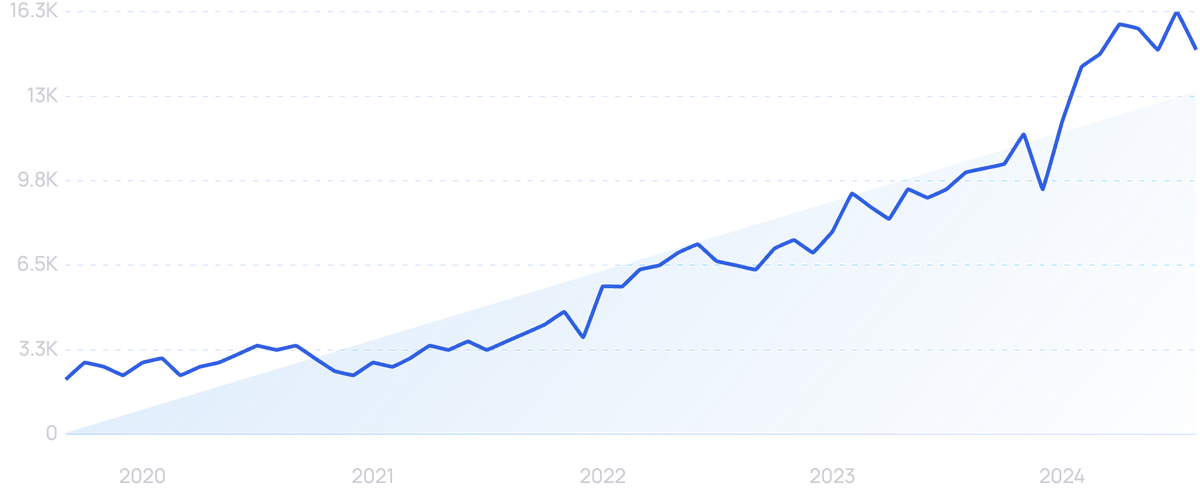
Search volume for “synthetic data” is up more than 600% since 2019.
As more and more enterprises start to implement AI analytics systems, they need data to use in training those systems.
Some companies struggle to come up with the large amount of data and high-quality data needed for training AI models.
That’s where synthetic data comes in.
Synthetic data can be fully synthetic or partially synthetic.
This data is created by taking a database, creating an ML model for it, and generating a second set of data from it.
Synthetic data has the same patterns and properties as real data, but it’s not tied to any actual data identifiers.
A large volume of synthetic data can be created in a short period of time. And, it’s automatically tagged as it’s generated.
It’s also the prime way to get high-quality data regarding events that don’t happen in the real world very often.
Another big sticking point is security and privacy.
Synthetic data is ideal for enterprises that need to keep data private. Anonymizing data can be ineffective, but that’s never an issue with synthetic data because it was never real.
For example, synthetic data is being used in the medical field.
UC Davis Health in Sacramento, California, won a $1.2 million grant in April 2022 to innovate new ways to generate synthetic data to help forecast disease incidences.
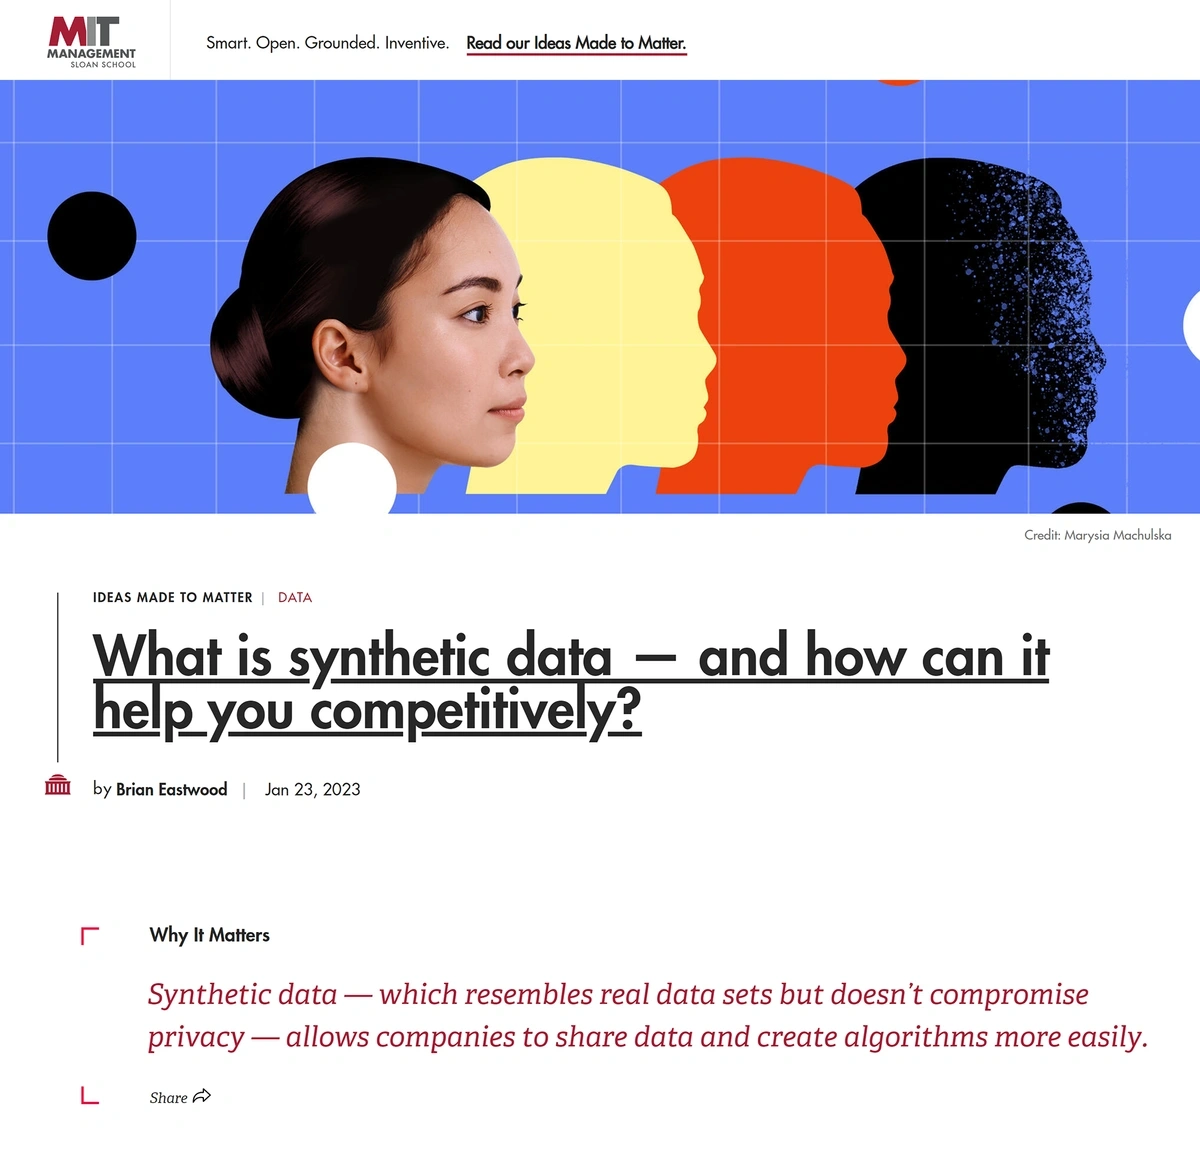
MIT researchers developed a Synthetic Data Vault, an open-source tool for creating synthetic datasets.
A German health insurance group, Provinzial, is using synthetic data for predictive analytics.
They’ve used the data to build an analytics recommendation engine that predicts which services and products their customers will need next.
The enterprise saved three months because they didn’t need to go through privacy evaluations.
They also reduced the time to date by 4 weeks.
In an example from the public sector, the city of Vienna utilized synthetic data as it developed more than 300 software applications for the city.
The city needed demographic data but that’s protected under GDPR.
So, they utilized their existing datasets to generate synthetic data that matched the real population and number of households but did not include any identifiers related to personal data.
They analyzed the synthetic data in order to create tools for tourists, apps for individuals riding public transportation, and other solutions related to geographical data.
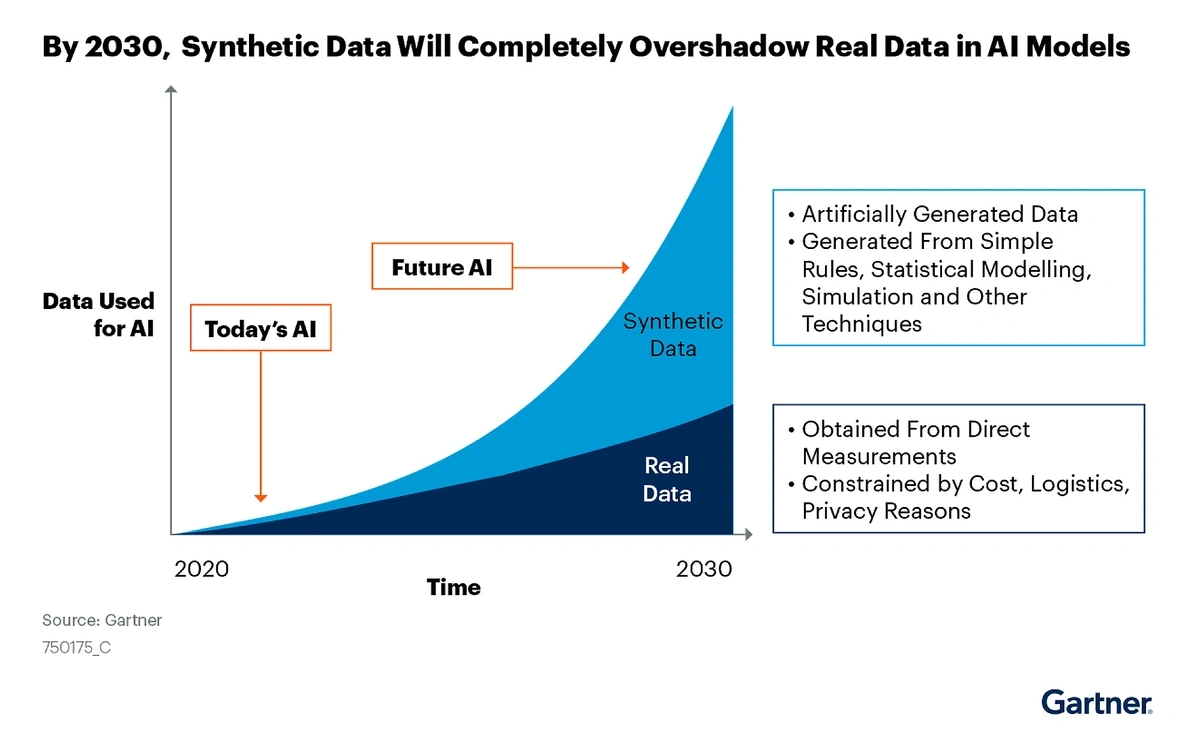
Gartner predicts that 60% of the data used by AI and analytics solutions will be synthetic data by the end of the year.
AI models are predicted to use more synthetic data as we move toward 2030.
Conclusion
As organizations across the globe race to stay ahead of the competition, data analytics will likely continue to be a differentiating factor. The ability to generate and use business intelligence is a critical determinant of enterprise growth.
Early adopters are beginning to recognize the power of edge computing and the ability to turn their data into real-time insights. However, some are going even further to implement ML platforms that can produce insights without human intervention. Others are seeing more data-driven decisions across the enterprise thanks to data democratization.
In short, the data analytics space looks to have plenty of room for future growth.
Stop Guessing, Start Growing 🚀
Use real-time topic data to create content that resonates and brings results.
Exploding Topics is owned by Semrush. Our mission is to provide accurate data and expert insights on emerging trends. Unless otherwise noted, this page’s content was written by either an employee or a paid contractor of Semrush Inc.
Share
Newsletter Signup
By clicking “Subscribe” you agree to Semrush Privacy Policy and consent to Semrush using your contact data for newsletter purposes
Written By


Josh is the Co-Founder and CTO of Exploding Topics. Josh has led Exploding Topics product development from the first line of co... Read more


