Exploding Topics
Remineralizing Gum search volume grew from under 100 to 27,100 monthly searches between February 2024 and January 2026.
Remineralizing gum
+5100%
GLP 1 Supplement search volume grew from 5,920 to 74,000 monthly searches between February 2024 and January 2026.
GLP 1 supplement
+1150%
Soursop Bitters search volume grew from 9,900 to 110,000 monthly searches between March 2024 and February 2026.
Soursop bitters
+1011%



Get Advanced Insights on Any Topic
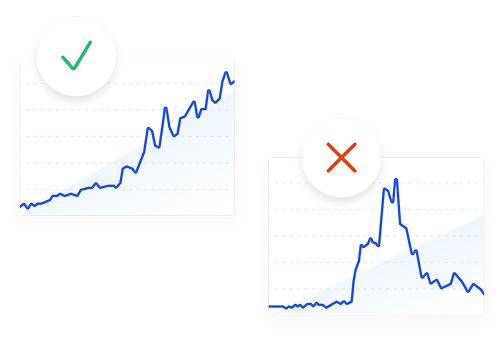
Discover Trends 12+ Months Before Everyone Else
How We Find Trends Before They Take Off
Exploding Topics’ advanced algorithm monitors millions of unstructured data points to spot trends early on.
Keyword Research
Performance Tracking
Competitor Intelligence
Fix Your Site’s SEO Issues in 30 Seconds
Find technical issues blocking search visibility. Get prioritized, actionable fixes in seconds.
Powered by data from
Latest Blog Posts
Featured Case Studies
See what's trending before everyone else
Each week, we'll send you our best Exploding Topics. Plus, expert insight and analysis.
60+ AI Chatbot Statistics: Adoption, Perception, and Shifts (2026)

 Add Exploding Topics on GoogleAdd Exploding Topics as your preferred source to see more of our stories on Google.
Chatbots are almost universally adopted today, featuring significant capabilities for customers and businesses beyond their traditional functions as simple rule-based bots.
In this report, we’ll present the major shifts driving the chatbot industry forward and analyze how this technology is being adopted by organizations and consumers in their daily lives.
Top Chatbot Stats
- The global chatbot market is valued at $13.28 billion in 2026.
- By 2030, the global chatbot market will grow to $37.53 billion.
- 49% of Americans use AI chatbots today.
- The cost to develop and implement a chatbot can range between $2,000 and $250,000, depending on complexity, industry, and use case.
Chatbot Market Size Statistics
The global chatbot market reached $10.25 billion in 2025 and is projected at $13.28 billion by the end of 2026 (Research and Markets).
That’s a major jump from a value of $2.47 billion 5 years ago,
The market is expected to grow to $37.53 billion in 2030 at a compound annual growth rate (CAGR) of 29.7%.
There's no sign that this ascent is stalling in the foreseeable future. Fortune Business Insights estimates the market to reach $60.21 billion by 2034 at a 24.51% CAGR.
LLMs remain the primary driver of this growth, which are seeing increased demands for faster response times and from businesses to improve operational efficiency.
| Year | Market Value |
| 2021 | $2.47 billion |
| 2025 | $10.25 billion |
| 2026 | $13.28 billion |
| 2027 | $17.22 billion |
| 2028* | $22.33 billion |
| 2029* | $28.96 billion |
| 2030* | $37.53 billion |
| 2034* | $60.21 billion |
Chatbot Usage & Adoption Statistics
88% of people had at least one conversation with a chatbot in the past year (Tidio).
This makes sense, considering the rising adoption of AI agents with their advanced capabilities in understanding queries and resolving problems when trained on a business's knowledge base.
According to a recent Salesforce research, AI agents in customer service have increased from 39% in 2025 to 66% in 2026.
In fact, businesses cite customer satisfaction as the single top KPI most favorably impacted by the introduction of AI chatbots.
That said, some surveys show customer perception isn’t as extremely positive as businesses assume.
Even though 65% of customer service teams believe that their customers fully trust AI, Metrigy Consumer CX Index highlights that trust is much lower than that.
About 44% of consumers trust that AI can satisfactorily entertain their requests and needs.
The same divide was seen in a HostingAdvice survey, revealing that 92% businesses think AI chatbots improve customer satisfaction, yet 64% of customers over 30 report high dissatisfaction.
The theme is that the older you are, the higher the chance of dissatisfaction with AI chatbots.
Despite that, the percentage of adults in the US who use AI chatbots has jumped from 33% to 49% between 2024 and 2026 (Pew Research).
ChatGPT is the most popular AI chatbot in the US, with 44% of AI users being ChatGPT users.
The rest use other LLMs like Gemini, Copilot, and Meta AI, but significantly less than ChatGPT.
Here’s a breakdown of popular LLMs in the US by usage:
| AI Chatbot | Percentage of Users (US) |
| ChatGPT | 44% |
| Gemini | 24% |
| Copilot | 17% |
| Meta AI | 14% |
| Grok | 8% |
| Claude | 6% |
| Character.ai | 3% |
Globally, Meta AI has the highest number of active users all over the world at 1.2+ billion.
Behind Meta AI is ChatGPT, which has crossed 1 billion active users.
Next, Google Gemini, which also crossed 1 billion users on August 2026 for the first.
Grok is one of the fastest growing chatbots, with more than 117 million active users.
Below is a complete list of the top ten AI chatbots, ranked by total active users.
| Rank | AI Chatbot | Total Monthly Active Users |
| 1 | Meta AI | 1.2 billion |
| 2 | ChatGPT | 1 billion |
| 3 | Google Gemini | 1 billion |
| 4 | Claude | 245 million |
| 5 | Grok | 117 million |
| 6 | Microsoft Copilot | 100+ million |
| 7 | Perplexity | 100+ million |
| 8 | Character.ai | 45 million |
Despite having the most users, Meta AI does not lead in total user traffic.
Below is a comparison of the top ten AI chatbots, ranked by total monthly visitors. All traffic data was gathered using the Semrush Traffic Analytics tool.
| Rank | AI Chatbot | Total Monthly Visits |
| 1 | ChatGPT | 6.6 billion |
| 2 | Claude | 1.2 billion |
| 3 | Gemini | 826.4 million |
| 4 | DeepSeek | 339.1 million |
| 5 | Grok | 217.3 million |
| 6 | Perplexity | 124.9 million |
| 7 | Meta AI | 40.6 million |
| 9 | Copilot | 2.3 million |
Most Popular Chatbot Use Cases
Among AI users, 42% of the participants cited information search as their primary use case, the most popular of all uses (Pew Research).
The second most popular use case is using AI chatbots for work-related tasks (38%).
Here’s a breakdown of the most chatbot use cases:
| Chatbot Use Case | Percentage of Users |
| Information search | 42% |
| Workplace tasks | 38% |
| Fun and entertainment | 25% |
| Create/edit images/videos | 24% |
| Medical advice | 20% |
| News | 13% |
| Emotional support or advice | 10% |
| Companionship | 4% |
Organizational use of AI chatbots is also increasing. They are even being used to replace existing jobs.
According to McKinsey, revenue gains from AI are most pronounced in marketing and sales, and product and service development.
The impact of AI is seen very positively by C-level respondents in a recent McKinsey survey.
80% of C-level respondents say AI has improved their productivity.
Over half of these respondents also claim that AI enables them to make better decisions and develop new skills.
Perceptions aren't universally positive, however. Mid-level managers and individual contributors more frequently report concerns and hesitations related to AI use at the workplace.
The top 3 fears from these individuals are pressure to take on more work, anxiety about career prospects, and reduced ability to think critically.
Sales Chatbots
63% of B2B organizations use AI to qualify leads (ZappIQ AI).
The impact of AI chatbots in sales is perceived to be quite significant, with conversational bots contributing 10%-15% in conversions compared to the baseline of traditional contact forms at 3.8%.
Consumer habits are becoming increasingly inclined to expect instant responses with a high degree of personalization.
Conversational chatbots are great at responding with speed, which means they act within the critical time window where a prospect is most likely to be converted.
A recent Salesforce survey showed that 89% of service professionals using AI believe it increases self-resolution for customers. 88% of them believe that conversational AI accelerates resolution time overall (Salesforce).
And with AI capable of handling routine tasks, representatives have more time on their hands for more important work.
For instance, up to 65% of service teams feel they have better opportunities for developing relationships with customers with AI assisting with other simpler routine tasks.
Chatbot Cost Statistics
Custom AI chatbots can be relatively cheap or extremely expensive, depending on their technological sophistication.
Basic chatbots without operating on hard-coded rules can be as cheap as $2,000 and as expensive as $15,000 (Octal IT).
Here’s an estimate based on chatbox complexity:
- Rule-based/basic FAQ bot: $2,000 - $15,000
- Mid-level AI/Support bot: $15,000 - $50,000
- Generative AI/custom LLM bot: $35,000 - $150,000
- Enterprise/Multi-agent system: : $80,000 - $250,000+
This includes planning, design, integration, testing, and deployment costs.
Planning alone can cost as high as $10,000. Backend development and third-party integrations are also costly phases of a chatbot development project (appinventiv).
Here’s a look at the expected costs for each development and implementation phase for chatbots:
| Development Stage | Cost Range |
| Planning and Research | $3,000 - $10,000 |
| Design (UX/UI) | $8,000 - $25,000 |
| AI Model & RAG Pipeline Development | $20,000 - $80,000 |
| Front-End Development & Widgets | $10,000 - $35,000 |
| Back-End & Third-Party Integrations | $12,000 - $40,000 |
| Testing, QA & Guardrail Tuning | $5,000 – $15,000 |
| Deployment | $4,000 – $15,000 |
| Maintenance and Updates | $2,000 – $25,000/year |
However, the development stage is not the only factor that determines the cost of an AI chatbot. Cost can vary depending on specific industry requirements.
Here are the chatbot development costs broken down by industry:
| Industry | Estimated Cost Range |
| Banking & Finance | $120,000 – $300,000 |
| Healthcare | $100,000 – $250,000 |
| E-Commerce & Retail | $50,000 – $150,000 |
| SaaS & Technology | $50,000 – $120,000 |
| E-commerce and Retail | $35,000 - $70,000 |
| Manufacturing & Supply Chain | $45,000 – $110,000 |
| Travel & Hospitality | $25,000 – $70,000 |
| Education & HR | $25,000 – $65,000 |
Sources: appentiv, EasyComm, Octal IT, Salt Technologie
Chatbot Statistics By Region
North America has the biggest chatbot market share globally at 31.3%. It’s closely followed by Asia-Pacific at 28.5% (Grand View Research).
The market share in these regions, particularly in Asia-Pacific, is largely driven by generative chatbot integration in enterprise.
Forecasts are seeing Asia-Pacific to remain the fastest-growing region in terms of chatbot adoption and market expansion with a CAGR of 23.5%.
| Region | Market Share |
| North America | 31.3% |
| Asia Pacific | 28.5% |
| Europe | 25.3% |
| Latin America | 8.8% |
| Middle East and Africa | 6.1% |
User distribution of chatbots like ChatGPT also reveals a similar pattern across regions.
According to Semrush traffic data, the United States accounts for 17.88% of ChatGPT’s website traffic, or 161.1 million monthly unique visitors.
India ranks second with 7.88% of the total ChatGPT traffic share:
| Country | Traffic Share | Unique Visitors |
| United States | 17.88% | 161.1M |
| India | 7.88% | 62.2M |
| Brazil | 5.7% | 39.5M |
| Bangladesh | 6.71% | 34.6M |
| Germany | 3.6% | 27.7M |
| Japan | 3.4% | 25.2M |
| United Kingdom | 2.85% | 20.9M |
Conclusion
Using AI-powered chatbots can improve the customer experience while reducing support, marketing, and sales costs. Meanwhile, consumers are finding new ways to use chatbots daily.
That said, generative AI has a long way to go before finding widespread trust it needs to be adopted without possible blowback. The trends clearly reveal that AI technology evolves dizzyingly faster than society can catch up.
These challenges are likely to remain in the foreseeable future, forcing business leaders to implement AI chatbots in ways that support their teams without causing job-related anxieties while earning consumer trust and satisfaction to a high degree.
Stop Guessing, Start Growing 🚀
Use real-time topic data to create content that resonates and brings results.
Exploding Topics is owned by Semrush. Our mission is to provide accurate data and expert insights on emerging trends. Unless otherwise noted, this page’s content was written by either an employee or a paid contractor of Semrush Inc.
Share
Newsletter Signup
By clicking “Subscribe” you agree to Semrush Privacy Policy and consent to Semrush using your contact data for newsletter purposes
Written By


Josh is the Co-Founder and CTO of Exploding Topics. Josh has led Exploding Topics product development from the first line of co... Read more