


Get Advanced Insights on Any Topic
Discover Trends 12+ Months Before Everyone Else
How We Find Trends Before They Take Off
Exploding Topics’ advanced algorithm monitors millions of unstructured data points to spot trends early on.

Keyword Research
Performance Tracking
Competitor Intelligence
Fix Your Site’s SEO Issues in 30 Seconds
Find technical issues blocking search visibility. Get prioritized, actionable fixes in seconds.
Powered by data from
Latest Blog Posts
Featured Case Studies
See what's trending before everyone else
Each week, we'll send you our best Exploding Topics. Plus, expert insight and analysis.
57+ Incredible Fintech Stats (2024-2026)

The fintech space is making fast strides across many financial sectors, including consumer and B2B.
Fintech investment and consumer adoption are clearly on the rise. But to what extent? And where is this industry headed?
This list has you covered with a wide range of key, up-to-date financial technology (fintech) statistics.
Contents
- Fintech Industry Size
- Fintech Investment Statistics
- VC fintech Funding
- Leading fintech Companies
- Fintech Adoption Rates
- What The Experts Say
Top Fintech Stats (Editor's Picks)
- As of 2023, the fintech space is worth over $226 billion.
- There are approximately 30,000 fintech startups.
- Around 90% of Chinese citizens use fintech banking.
- Visa is the largest fintech company with a valuation of almost half a trillion USD.
Fintech Industry Size
The fintech industry is worth approximately $226.76 billion (EMR)
The fast-growing space is projected to reach $917.17 billion by 2032, growing at a CAGR of 16.8%.
Global fintech industry revenue has nearly doubled since 2017 (Deloitte)
In 2017, global Fintech industry revenue was approximately $90.5 billion. That figure has grown by over 100% since then.
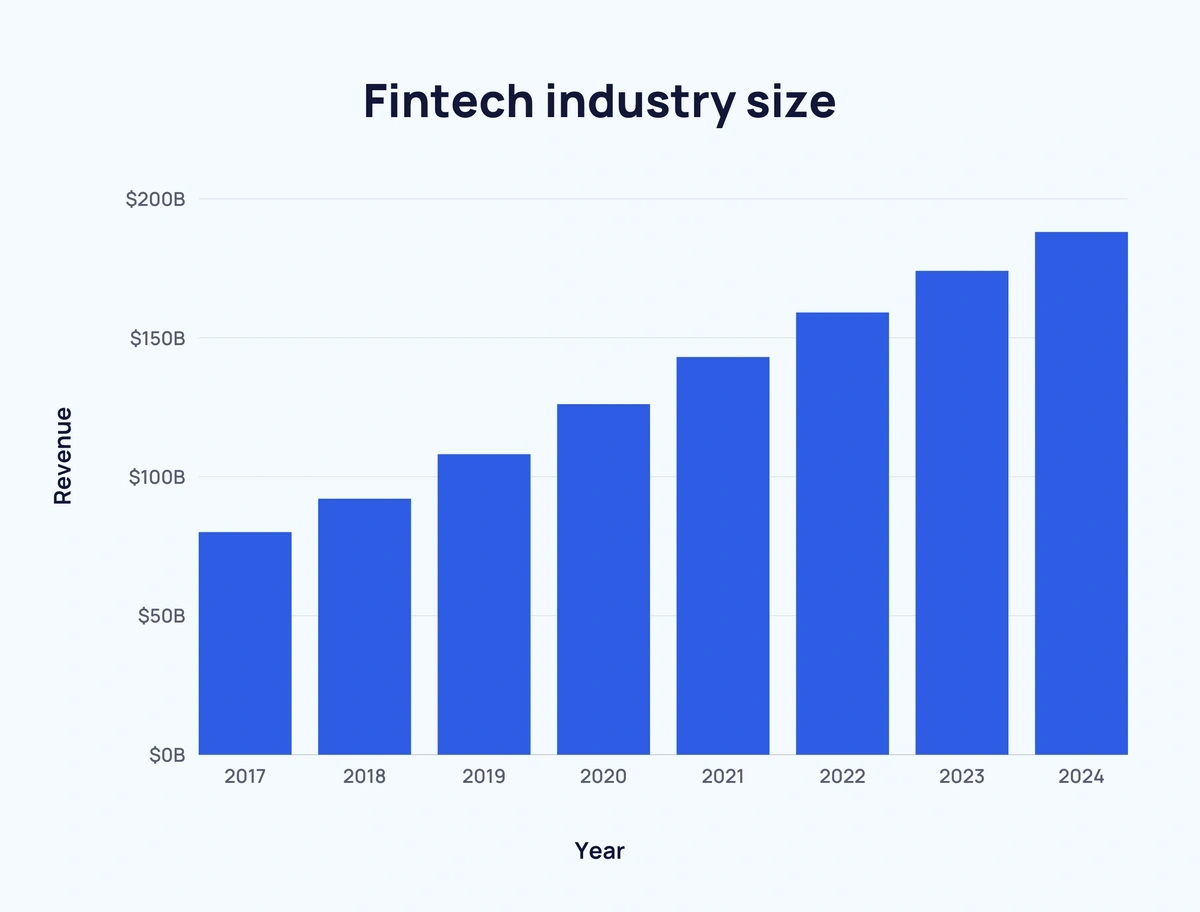
Here is a full breakdown of fintech industry revenue (converted from Euros) between 2017 and 2024:
| Year | Americas | EMEA | Asia Pacific | Total | Change over the previous year |
| 2017 | $30.5 billion | $20 billion | $33.7 billion | $84.2 billion | - |
| 2018 | $36.2 billion | $21 billion | $40 billion | $97.2 billion | ↑ 15.4% |
| 2019 | $44.2 billion* | $22 billion* | $47.3 billion* | $111.5 billion* |
↑ 14.7%* |
| 2020 | $51.6 billion* | $24.2 billion* | $56.8 billion* | $132.6 billion* | ↑ 18.9%* |
| 2021 | $57.9 billion* | $25.3 billion* | $67.3 billion* | $150.5 billion* | ↑ 13.5%* |
| 2022 | $61 billion* | $27.4 billion* | $77.9 billion* | $166.3 billion* | ↑ 10.5%* |
| 2023 | $64.2 billion* | $29.5 billion* | $89.4 billion* | $183.1 billion* | ↑ 10.1%* |
| 2024 | $66.3 billion* | $30.5 billion* | $101 billion* | $197.8 billion* | ↑ 8%* |
*2018 prediction.
The number of fintech startups has more than doubled since 2019 (BCG)
There are currently over 26,000 fintech startups worldwide. This figure has grown dramatically over the past few years (up from only around 12,000 fintech startups in 2019).

Fintech Investment Statistics
Fintech industry investment halved in H1 2023 (SPGlobal)
There had been a general upward trend over the last decade.
In 2012, investment in fintech totaled $4 billion. This increased year-over-year until 2015, reaching $67.1 billion - a 17x increase.
This figure then slowly declined before surging to $147.9 billion in 2018. And increasing further to $215.4 billion in 2019.
In the first half of 2021, investment in fintech companies reached a then-record-breaking $98 billion - a $19.9 billion increase in the second half of 2020.
By the end of 2021, fintech investment reached $210 billion.
But in H1 2023, investment fell 49% from around $46 billion in H2 2022 to $23 billion.
VC Fintech Funding
Venture capital investment has consistently topped $40 billion per year (KPMG)
Venture capital funding in the fintech industry more than doubled between 2020 and 2021.
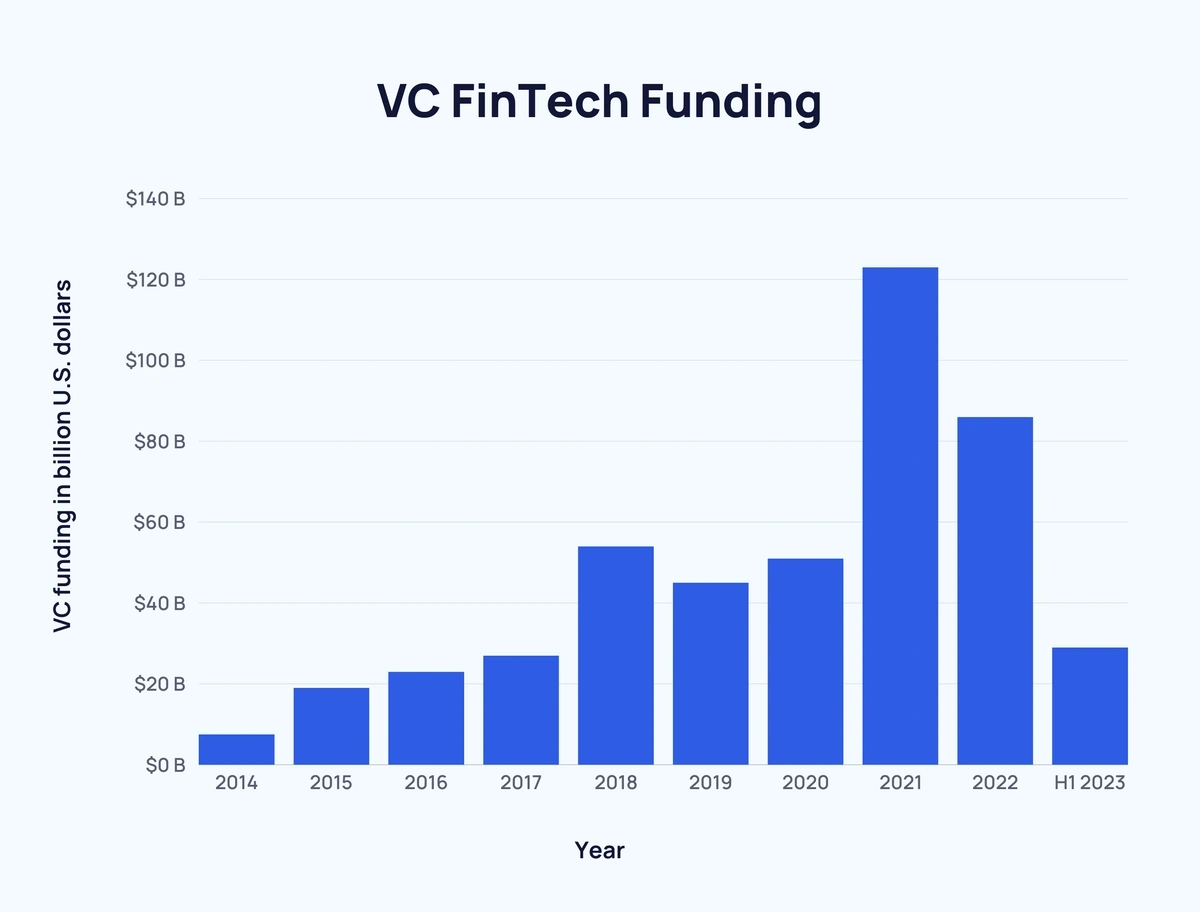
Here is a breakdown of the last few years of VC funding in the fintech space:
| Year | VC Funding | % Change | Number of Deals | % Change |
| 2014 | $8 billion | - | - | - |
| 2015 | $17.3 billion | 116% | - | - |
| 2016 | $20.4 billion | 18% | - | - |
| 2017 | $23.4 billion | 15% | 2,348 | - |
| 2018 | $53.2 billion | 127% | 3,226 | 37% |
| 2019 | $45.6 billion | -14% | 3,650 | 13% |
| 2020 | $49.9 billion | 9% | 3,995 | 9% |
| 2021 | $122.9 billion | 146% | 6,623 | 66% |
| 2022 | $88.3 billion | -28% | 6,128 | -7% |
| H1 2023 | $27.3 billion | - | 1,818 | - |
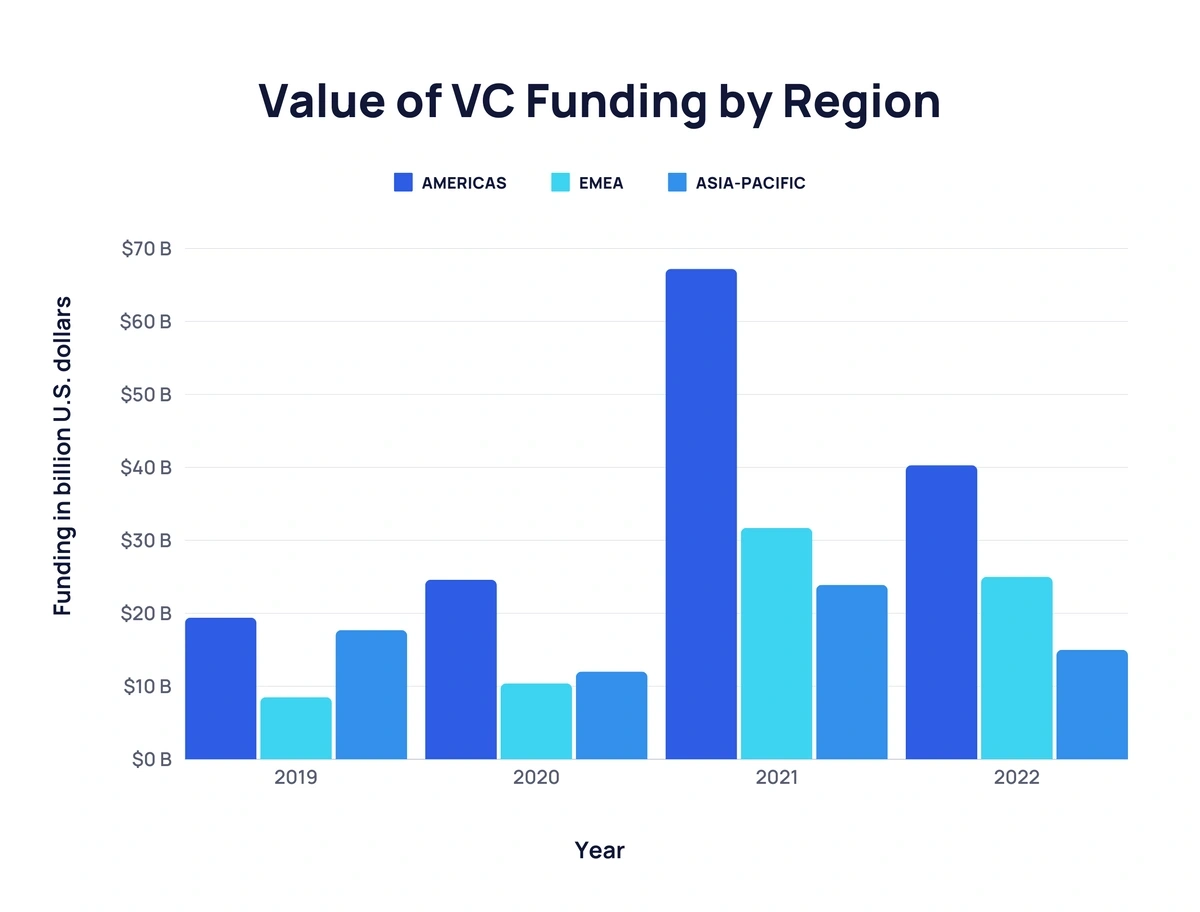
The Americas are responsible for the largest portion of fintech VC funding (KPMG)
Below are VC fintech funding stats broken down by region:
| Year | Americas | Europe, Middle East, Africa | Asia Pacific |
| 2019 | $19.4 billion | $8.5 billion | $17.7 billion |
| 2020 | $24.6 billion | $10.4 billion | $12 billion |
| 2021 | $67.2 billion | $31.7 billion | $23.9 billion |
| 2022 | $40.3 billion | $25 billion | $15 billion |
Three different fintech sectors receive $5 billion+ in VC funding per year (CB Insights)
Between 2016 and Q1 2021, capital markets received the most VC investment ($8.07 billion).
This was followed by payments ($6.03 billion) and wealth management ($5.43 billion).
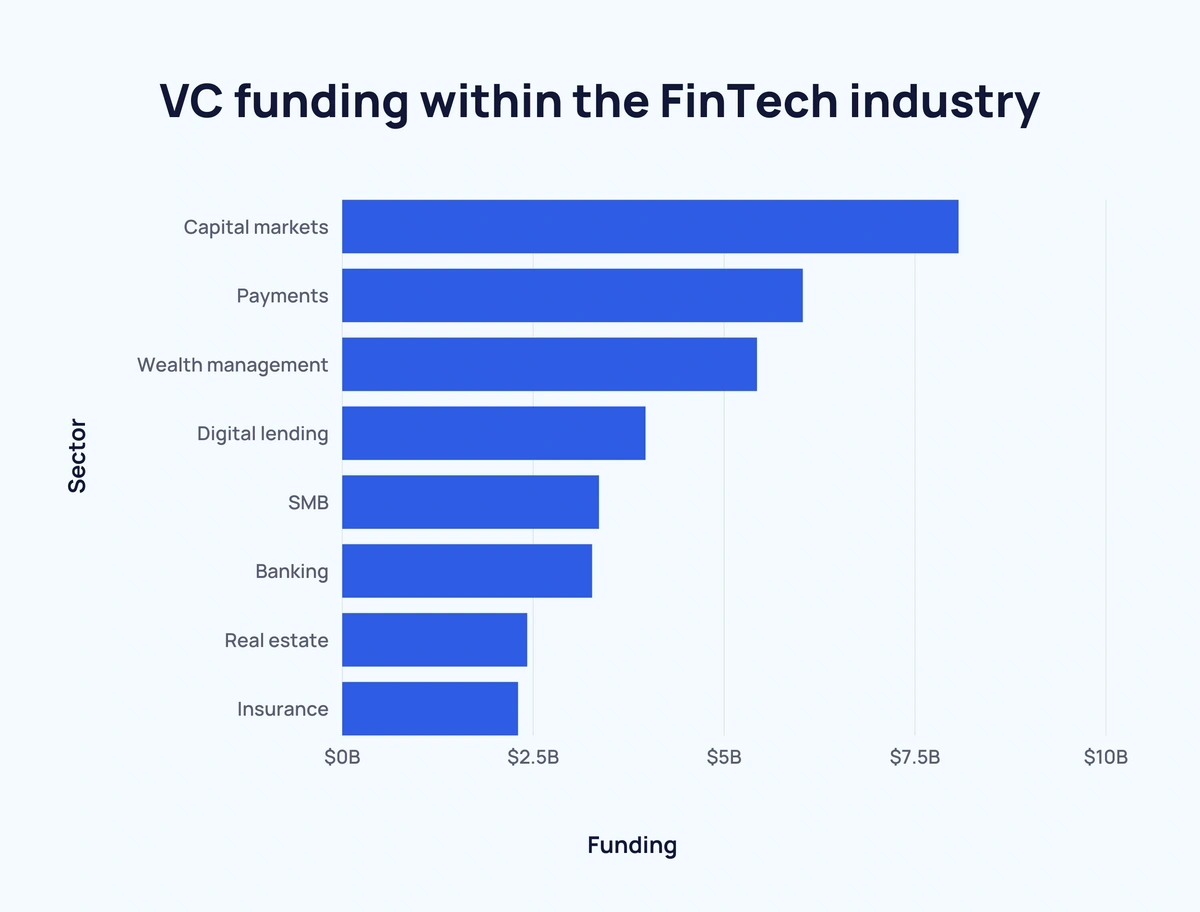
Here’s a detailed look at the distribution of VC funding within the fintech industry over the last few years:
| Rank | Sector | Funding |
| #1 | Capital markets | $8.07 billion |
| #2 | Payments | $6.03 billion |
| #3 | Wealth management | $5.43 billion |
| #4 | Digital lending | $3.97 billion |
| #5 | SMB | $3.36 billion |
| #6 | Banking | $3.27 billion |
| #7 | Real estate | $2.42 billion |
| #8 | Insurance | $2.30 billion |
Leading Fintech Companies
Visa is the largest fintech company by market cap (Google Finances)
In terms of fintech companies, Visa leads the way with a market capitalization of $500 billion.
This is followed by Mastercard with a $389 billion valuation.
25+ other fintech companies have passed the $10 billion "Decacorn" mark.
Almost half of the top 20 fintech companies by market cap are based in the US (Google Finances)
10 of the top 20 fintech companies by market cap are American.
Just two are based in China, yet they ranked fourth and sixth by market cap.
The UK, Ireland, Brazil, the Netherlands, India, Romania, Luxembourg, and Singapore each have one.
Here are the top 20 fintech companies by market value according to a 2024 report:
| Rank | Company | Country | Market Cap |
| 1 | Visa | United States | $555 billion |
| 2 | Mastercard | United States | $428 billion |
| 3 | Intuit | United States | $184 billion |
| 4 | Tencent | China | $139 billion |
| 5 | Fiserv | United States | $87 billion |
| 6 | Ant Financial | China | $79 billion |
| 7 | PayPal | United States | $64 billion |
| 8 | Adyen | Netherlands | $50 billion |
| 9 | Stripe | Ireland | $50 billion |
| 10 | Nubank | Brazil | $42 billion |
| 11 | Square | United States | $41 billion |
| 12 | Coinbase | United States | $34 billion |
| 13 | Chime | United States | $25 billion |
| 14 | Polygon | India | $20 billion |
| 15 | Revolut | United Kingdom | $20 billion |
| 16 | Ripple | United States | $15 billion |
| 17 | UIPath | Romania | $15 billion |
| 18 | Blockchain.com | Luxembourg | $14 billion |
| 19 | Grab | Singapore | $15 billion |
| 20 | Plaid | United States | $13.4 billion |
Fintech Adoption Rates
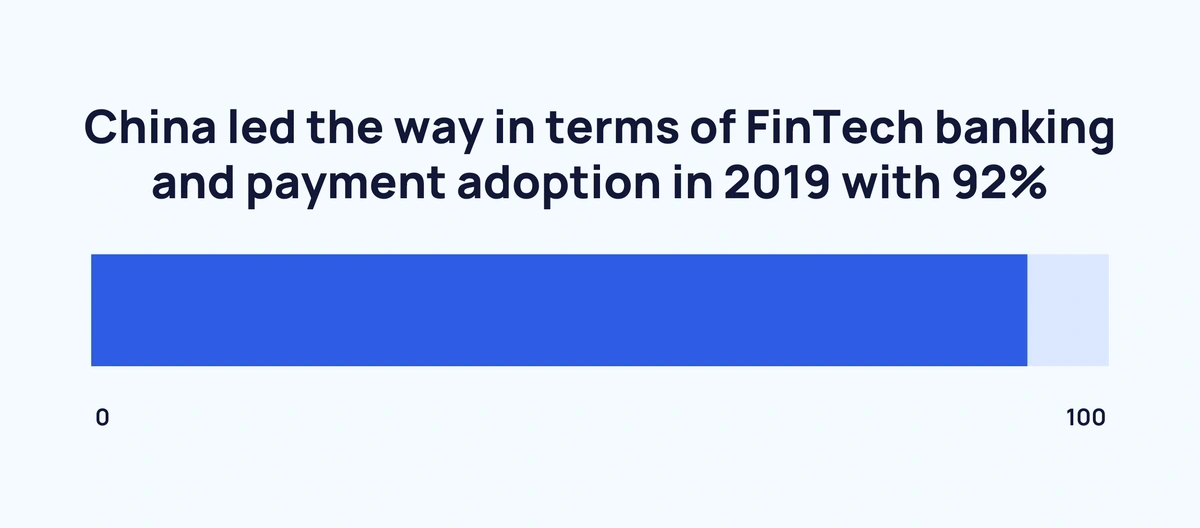
90% of Chinese citizens use fintech banking, payment, and financial management solutions (EY)
Looking at individual countries, China led the way in terms of fintech banking and payment adoption in 2019 with 92%. In fact, China is the front-runner in terms of fintech adoption across the board.
Here’s a closer look at five countries’ fintech adoption rates across different fintech categories:
| Country | Banking and payment | Financial management | Financing | Insurance |
| China | 92% | 91% | 89% | 62% |
| US | 52% | 49% | 41% | 31% |
| Mexico | 49% | 36% | 31% | 23% |
| South Africa | 47% | 43% | 34% | 26% |
| UK | 41% | 37% | 34% | 24% |
| Total | 56% | 51% | 46% | 33% |
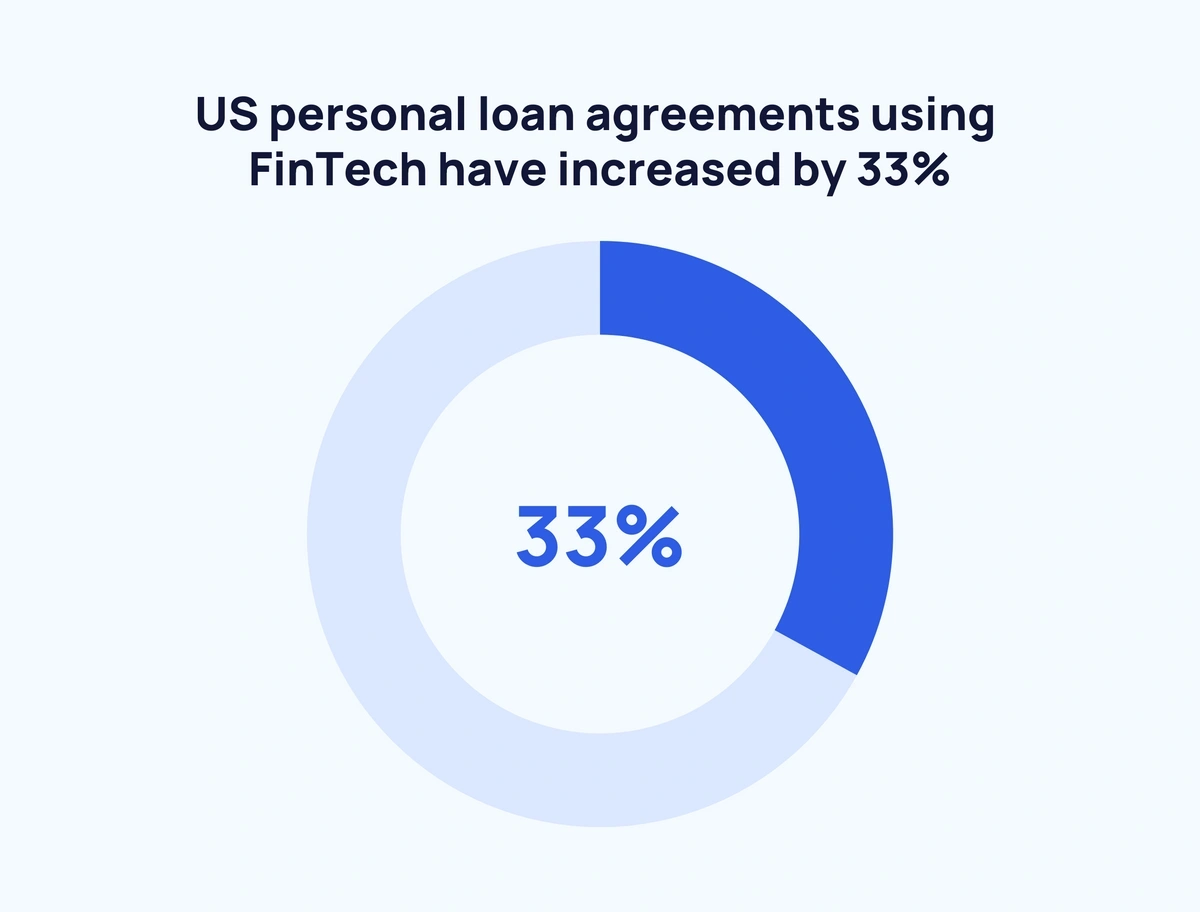
US personal loan agreements using fintech have increased by 33% (TransUnion)
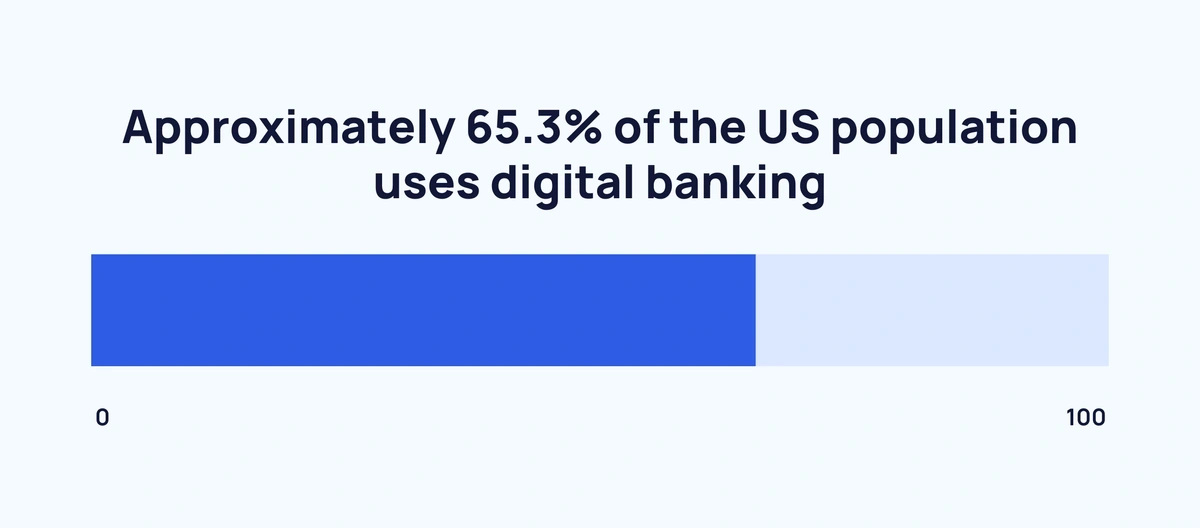
Taking a closer look at the US, digital banking has been on the rise over the last five years.
In 2018, an estimated 61.3% of Americans used some form of digital banking. This figure has increased year-over-year by at least 0.5%.
As of 2022, approximately 65.3% of the US population uses digital banking.
Leading up to 2018, Americans had increasingly sourced personal loan agreements using fintech. Between 2013 and 2018 there was a year-over-year growth from 5% to 38%.
What the Experts Say
Most senior banking executives believe fintech has a large impact on the wallet and mobile payments (Capgemini)

Searches for "digital wallet" are up 250% in the last 10 years
A recent survey found that banking executives believed non-traditional financial firms were having a notable impact on certain sections of the financial industry.
Here is a breakdown of the proportion of senior banking executives that believed fintech companies were having a large impact in 2018 (per section):
- Wallets and mobile payments - 66.7%
- Cards and other traditional payments - 62.5%
- Savings and checking accounts - 33.3%
- Value-added services - 29.2%
- Loans/mortgages - 12.5%
- Wealth and asset management services - 8.3%
These beliefs reflect many of the increased adoption rates seen above. And proved to be a relatively strong indicator of fintech growth in these sectors.
Conclusion
That concludes our deep dive into the fintech space.
It is clear that fintech is very much a part of the future in finance. And it’s an industry well worth monitoring in the coming years.
If you enjoyed reading our fintech stats, you may want to read our regularly-updated lists of fintech trends and fintech companies.
Stop Guessing, Start Growing 🚀
Use real-time topic data to create content that resonates and brings results.

Exploding Topics is owned by Semrush. Our mission is to provide accurate data and expert insights on emerging trends. Unless otherwise noted, this page’s content was written by either an employee or a paid contractor of Semrush Inc.
Share
Newsletter Signup
By clicking “Subscribe” you agree to Semrush Privacy Policy and consent to Semrush using your contact data for newsletter purposes
Written By


Josh is the Co-Founder and CTO of Exploding Topics. Josh has led Exploding Topics product development from the first line of co... Read more