Get Advanced Insights on Any Topic
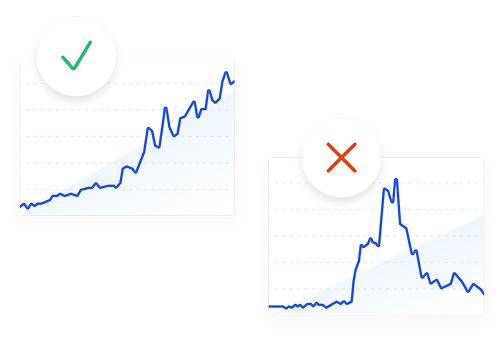
Discover Trends 12+ Months Before Everyone Else
How We Find Trends Before They Take Off
Exploding Topics’ advanced algorithm monitors millions of unstructured data points to spot trends early on.

Features
Keyword Research
Performance Tracking
Competitor Intelligence
Fix Your Site’s SEO Issues in 30 Seconds
Find technical issues blocking search visibility. Get prioritized, actionable fixes in seconds.
Powered by data from
Grafana
Open-source platform designed for monitoring and observability, enabling users to query, visualize, alert on, and understand their metrics regardless of storage location. It stands out by offering customizable and interactive dashboards, extensive data source support, alerting capabilities, and plugin extensibility, making it a versatile tool for data visualization and analysis. Grafana is primarily targeted at IT professionals, developers, and organizations seeking comprehensive monitoring solutions to enhance their operational insights and performance.
Grafana was discovered on May 1st 2020 and it currently has a search volume of 301K with a growth of 0%.
Growth
- Exploding
- Regular
- Peaked
Speed
- Exponential
- Constant
- Stationary
Seasonality
- High
- Medium
- Low
Volatility
- High
- Average
- Low
Save this topic and build your own trend dashboard.
Available with Exploding Topics Pro, try it now.

1.1M+ trends in our growing database.


