


Get Advanced Insights on Any Topic
Discover Trends 12+ Months Before Everyone Else
How We Find Trends Before They Take Off
Exploding Topics’ advanced algorithm monitors millions of unstructured data points to spot trends early on.

Keyword Research
Performance Tracking
Competitor Intelligence
Fix Your Site’s SEO Issues in 30 Seconds
Find technical issues blocking search visibility. Get prioritized, actionable fixes in seconds.
Powered by data from
Latest Blog Posts
Featured Case Studies
See what's trending before everyone else
Each week, we'll send you our best Exploding Topics. Plus, expert insight and analysis.
27 Buy Now, Pay Later Statistics (2024 & 2025)

This is a thorough list of up-to-date buy now, pay later (BNPL) statistics and trends.
Several BNPL services have seemingly sprung up out of nowhere and are now dominating the market.
Read on to discover all the need-to-know BNPL stats for 2024 and beyond.
Contents
- General BNPL Stats
- BNPL Industry Size
- BNPL User Demographics
- BNPL Usage Stats
- BNPL Industry Forecast
Top 2024 BNPL Stats
Here are an assortment of key BNPL statistics to get started:
- There are currently around 360 million BNPL users.
- The BNPL market is worth over $500 billion.
- 16% of 18 to 34-year-olds use BNPL.
- Sweden has the largest BNPL market share.
- Klarna has almost 150 million active users.
- Clothing is the most popular BNPL purchase.
- Almost half of US citizens are interested in BNPL services.
General BNPL Stats
There are 360 million BNPL users worldwide (Juniper Research)
As of 2022, there are an estimated 360 million people worldwide using BNPL services.
And that figure is set to more than double over the next five years.
By 2027, it is expected that there will be 900 million BNPL users - an increase of 157%.
BNPL is a $532.9 billion global industry (Lafferty)
The BNPL space is experiencing accelerated growth.
In 2020, the BNPL market was valued at $87.2 billion. This grew by around 43% to $125.09 billion in 2021. And reached an estimated $179.5 billion in 2022.
By 2030, the BNPL market is forecast to be worth an impressive $3.27 trillion.
Around 1 in 5 BNPL live in the US (Insider Intelligence)
The latest data indicates that a large share of BNPL users live in the US. In fact, the latest data indicates that there are currently 79 million US-based BNPL users.
That's an increase of 56.1% over the previous year.
And accounts for around 22% of all BNPL users.
3 in 5 people have used a BNPL service (C+R Research)
Recent data shows that 60% of people have tried a Buy No, Pay Later, service.
And just under half (46%), are likely to be currently making a payment via BNPL service.
Yet, 66% of people believe it is "financially risky" to use BNPL services.
Almost half of Gen Z are expected to use BNPL by 2025 (eMarketer)
Gen Z is the generation that uses BNPL the most. And adoption rates among Gen Z are expected to increase from 36.8% in 2021 to 47.4% in 2025.
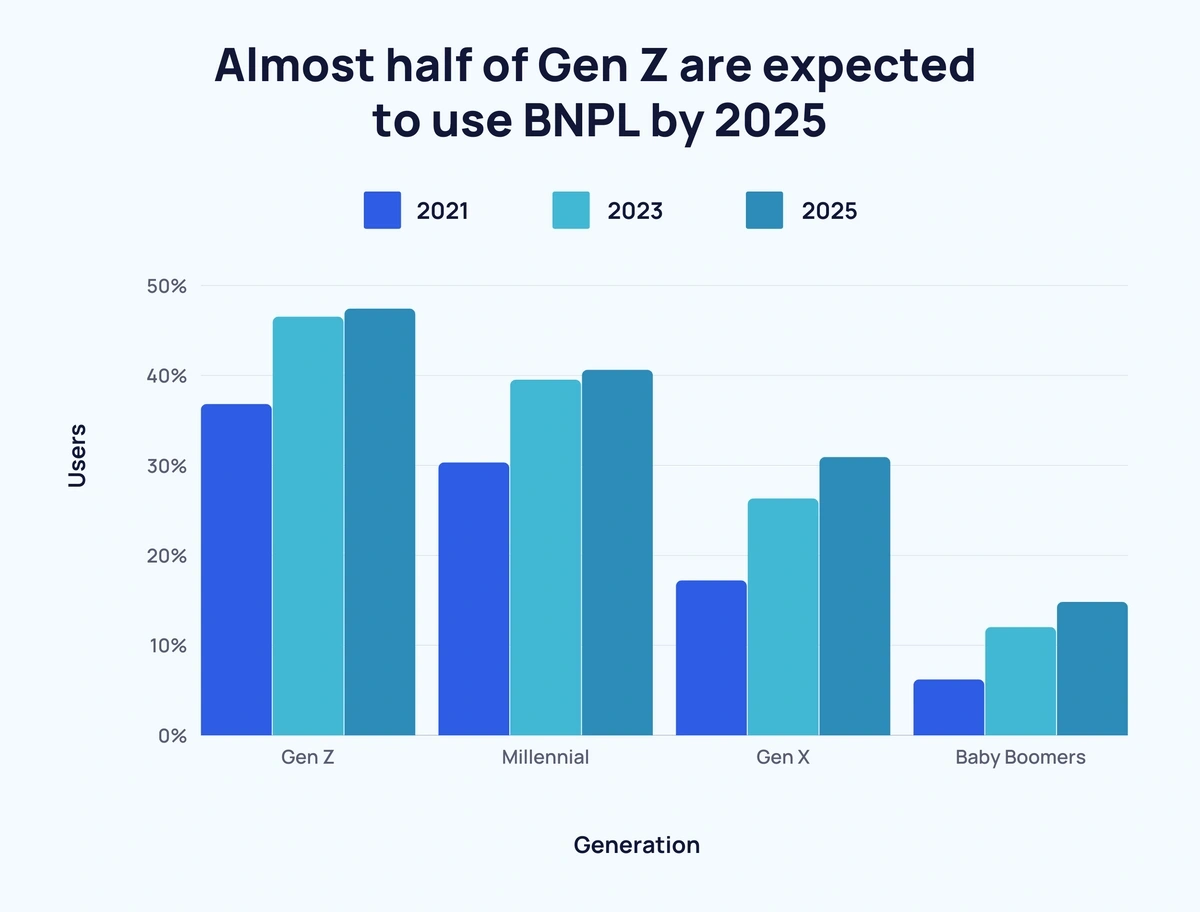
Although older generations are significantly less likely to use BNPL services, an increase is expected across the board nonetheless.
Here’s a breakdown of BNPL users by generation:
| 2021 | 2023 | 2025 | % Change | |
| Gen Z | 36.8% | 46.5% | 47.4% | ↑ 10.6% |
| Millennial | 30.3% | 39.5% | 40.6% | ↑ 10.3% |
| Gen X | 17.2% | 26.3% | 30.9% | ↑ 13.7% |
| Baby Boomers | 6.2% | 12% | 14.8% | ↑ 8.6% |
BNPL Industry Size
US BNPL lending is forecast to reach over $100 billion in 2024 (MAG)
BNPL lending in the US is forecast to exceed $100 billion by 2024.
In 2019, US BNPL lending totaled $3 billion. This figure increased by 13x in 2020 to $39 billion.
In 2022, BNPL lending was predicted to reach $74 billion.
And in 2024, that figure is expected to increase by $30 billion to $114 billion.
Sweden has the largest market share in the BNPL market (Worldpay)
Sweden has long dominated the BNPL market.
Back in 2016, Sweden led the way for BNPL domestic e-commerce payments with 2x more than The Netherlands.
By 2020, Sweden’s domestic BNPL e-commerce payment proportion had more than doubled. Germany and Norway were ranked second and third.
Australia and New Zealand are the only non-European countries in the top 10. In fact, all of the other eight countries that use BNPL the most are located in Northwest Europe.
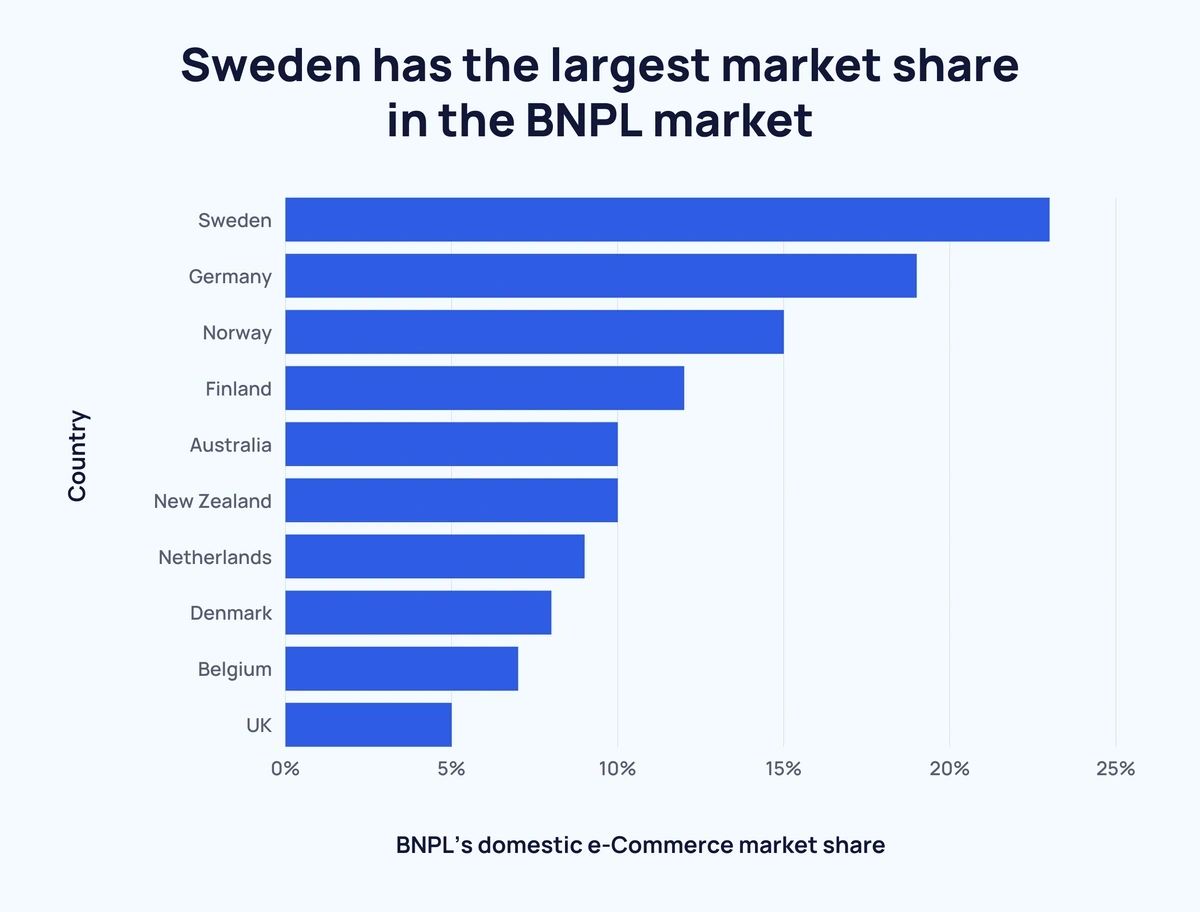
The global average for e-commerce payments made using BNPL is 2.1% (as of 2020).
Here’s a breakdown of the proportion of domestic e-commerce payments made with BNPL in 2020:
| Rank | Country | BNPL’s domestic e-commerce market share |
| 1 | Sweden | 23% |
| 2 | Germany | 19% |
| 3 | Norway | 15% |
| 4 | Finland | 12% |
| =5 | Australia | 10% |
| =5 | New Zealand | 10% |
| 7 | Netherlands | 9% |
| 8 | Denmark | 8% |
| 9 | Belgium | 7% |
| 10 | United Kingdom | 5% |
| 11 | France | 4% |
| =12 | Japan | 3% |
| =12 | India | 3% |
| =12 | Indonesia | 3% |
| =12 | Singapore | 3% |
| =12 | Philippines | 3% |
| =17 | Italy | 2% |
| =17 | Spain | 2% |
| =17 | United States | 2% |
| =17 | Poland | 2% |
BNPL service Klarna has approximately 1 million monthly active users (Airnow)
Swedish fintech company Klarna is a big reason behind the nation’s heavy use of BNPL services. The firm has seen its monthly active users shoot up since the start of 2019.
In January 2019, Klarna had under 20,000 monthly active users.
By January 2020, this figure grew to over 180,000.
A year later, Klarna had almost 700,000 monthly active users.
And, by September 2021, there were approximately 970,000 monthly active users on the Klarna platform.
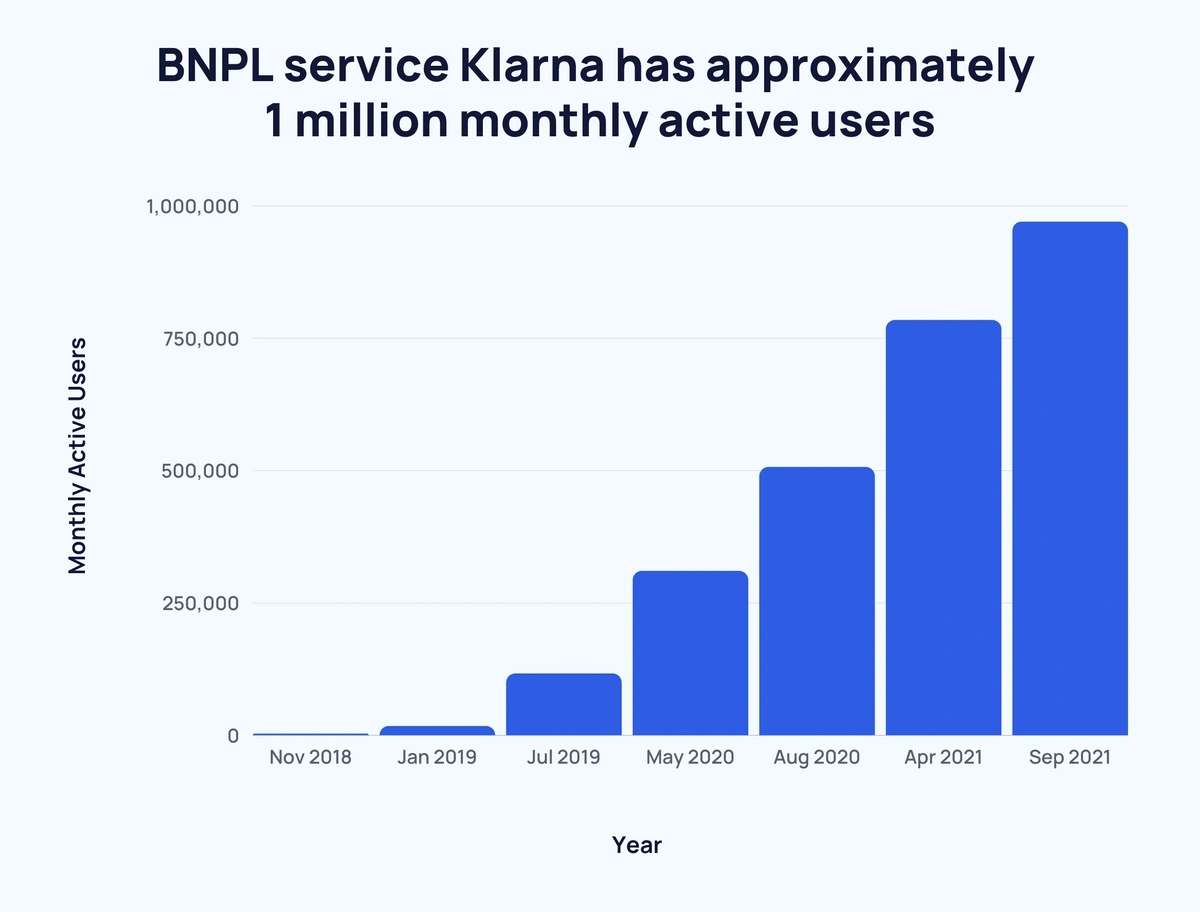
Here is a closer look at Klarna’s monthly active users over time:
| Milestone | Year | Google Play Store | iOS Store | Monthly Active Users |
| 1,000 | Nov 2018 | 1,431 | 1,258 | 2,689 |
| 10,000 | Jan 2019 | 7,008 | 9,890 | 16,898 |
| 100,000 | Jul 2019 | 14,896 | 101,395 | 116,291 |
| 250,000 | May 2020 | 48,489 | 261,520 | 310,009 |
| 500,000 | Aug 2020 | 92,456 | 413,921 | 506,377 |
| 750,000 | Apr 2021 | 198,240 | 585,982 | 784,222 |
Klarna has around 14x more users than any other BNPL service (Klarna)
Klarna is currently the most popular BNPL service provider (based on total users). The fintech company had approximately 147 million active users.
In the second place, Affirm has 11.2 million active users. And Afterpay has 10.5 million.
PayPal Credit is the BNPL market leader in the US (Forbes)
Klarna also has a huge influence in the US, but PayPal Credit is far and away the most popular BNPL service.
As of 2020, PayPal Credit had 34.6 million users in the US - over 4x more than second-placed Klarna (7.9 million).
Affirm (5.6 million), AfterPay (5.6 million), and FuturePay (3 million) make up the rest of the top five US BNPL services.
In total, eight different BNPL services have over 1 million users.
BNPL User Demographics
Men are more likely to use BNPL services than women (The Motley Fool)
A survey of 2,000 respondents found that 55.8% had used a BNPL service.
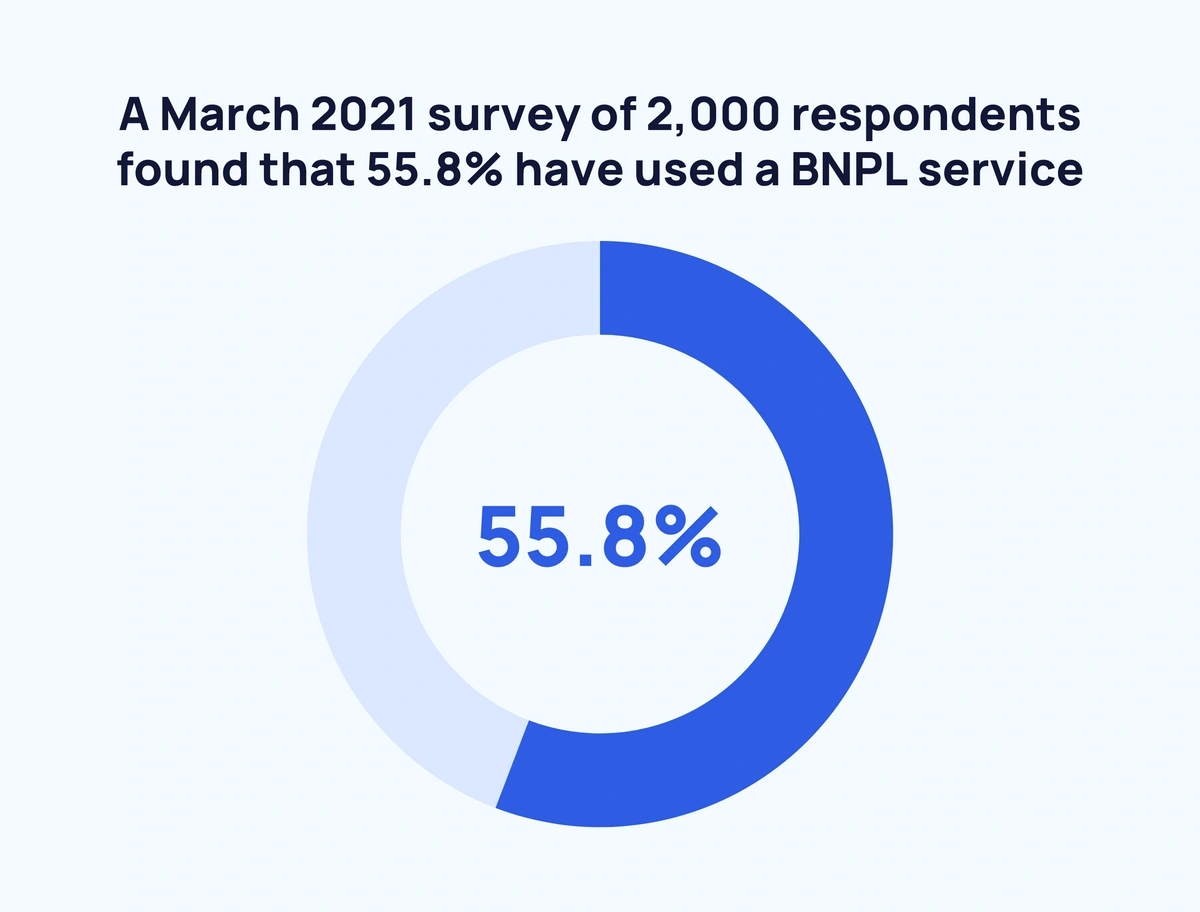
Broken down by gender, 62.8% of males surveyed had used a BNPL service.
While 51.36% of females claimed to have used a BNPL service at some stage.
Consumers 18-34 years old are 3x more likely to use BNPL regularly than consumers older than 55 (The Motley Fool)
A recent Motley Food survey revealed that 16% of 18 to 34-year-olds use BNPL regularly.
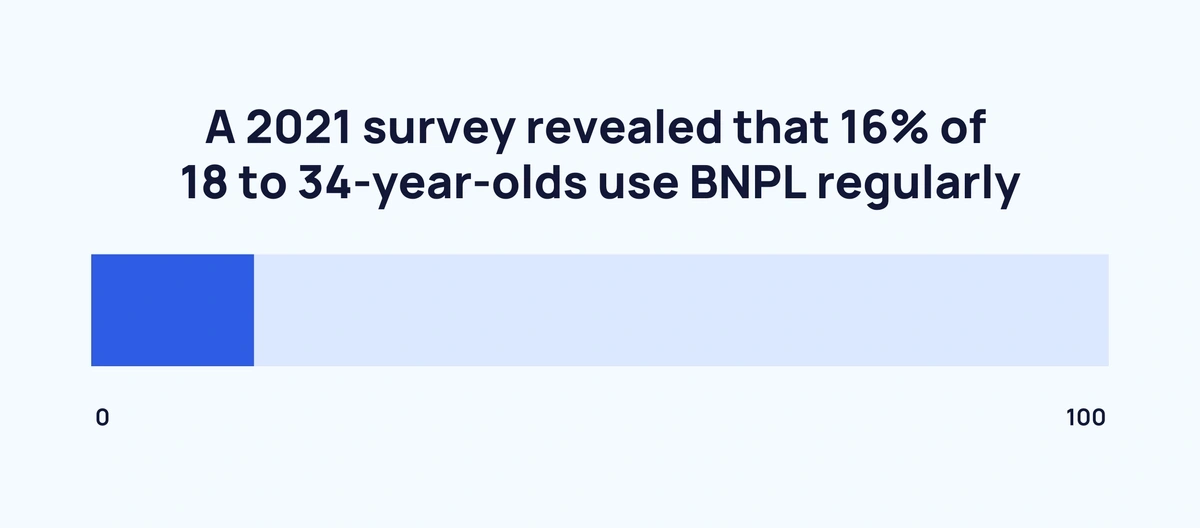
This was markedly higher than the other two age groups that participated - 35 to 54-year-olds (9%) and 55+ years (5%).
Across the board, there was a negative correlation between age and the likelihood of using BNPL services:
| Age Group | 18-34 Years | 35-54 Years | 55+ Years |
| Use It Regularly | 16% | 9% | 5% |
| Have Used Before, Not Regularly | 15% | 10% | 8% |
| Have Not Used, Very Interested | 10% | 4% | 5% |
| Have Not Used,
Somewhat Interested | 14% | 16% | 11% |
| Have Not used, Not Interested | 37% | 51% | 56% |
| Don’t Know What This Is | 8% | 9% | 15% |
BNPL Usage Stats
Around 1 in 3 BNPL users use the service each month (C+R Research)
According to a recent survey, 29% of BNPL users use the service regularly (at least once a month.)
Notably, 80% of BNPL users use a service at least every six months.
Here's a breakdown of the data:
| Frequency Consumers Use BNPL Services | Proportion of Respondents |
| More than once a week | 2% |
| Once a week | 8% |
| Once a month | 19% |
| Once every three months | 22% |
| Once every six months | 29% |
| Once a year or less | 20% |
Clarity of fees is the most important factor for BNPL users (PYMNTS)
A September 2020 survey found that almost half of respondents (41.8%) cited “clarity of fees or interest rates” as the most common reason for using BNPL.
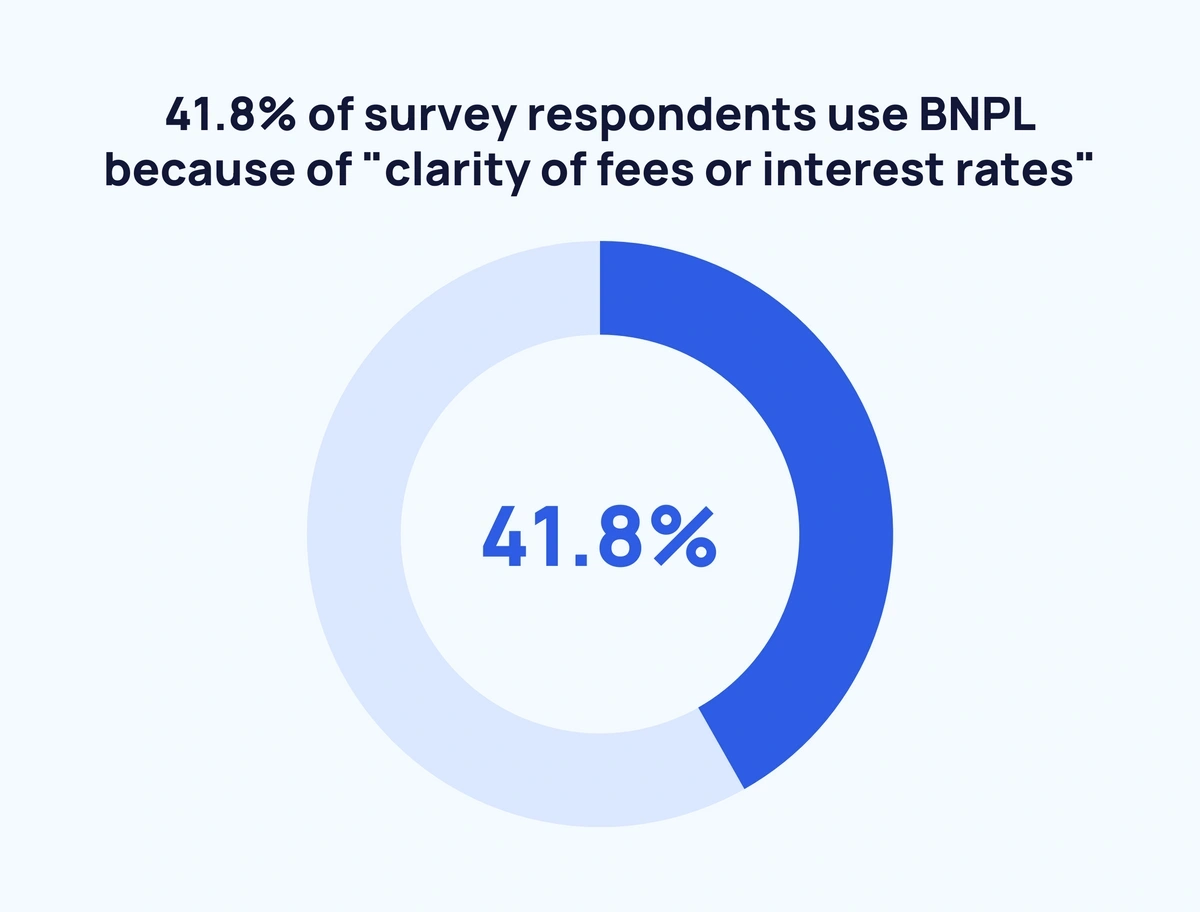
This was closely followed by “ability to monitor spending” (39.1%), “convenience of the option” (37.2%), and “number of merchants who accept this payment type” (36.7%).
Of the seven reasons cited, “rewards offered” was the least popular with 24.3% of the vote.
Here is the full list and how they stack up against credit cards and digital wallets:
| Reason | BNPL | Credit Card | Debit Card |
| Clarity of fees or interest rates | 41.8% | 11.2% | 16.3% |
| Ability to monitor spending | 39.1% | 21.7% | 24.3% |
| The convenience of the option | 37.2% | 34.8% | 62.1% |
| No. of merchants who accept this payment type | 36.7% | 32.9% | 46.4% |
| Trust that information is secure | 33.1% | 19% | 33.3% |
| The company's website is easy to use | 31.3% | 19% | 33.3% |
| Amount of funds available with this option | 30.6% | 19.2% | 20.5% |
| Rewards offered | 24.3% | 68.7% | 14.7% |
The average user is currently paying for around 4 items via BNPL (C+R Research)
Data shows that, on average, consumers claim to be currently paying for 3.8 items in installments.
And the most frequent amount paid in installments per month sits between $101-$205.
However, the average cost of the last item purchased is $689. And the average owed is $883.
Clothing is the most popular category for BNPL purchases (PYMNTS)
Almost two-thirds (63.5%) of respondents who use BNPL purchased clothing.
Entertainment was the next most popular category for BNPL spending with 30.3% of the vote. Followed by reading material with 29.4%.
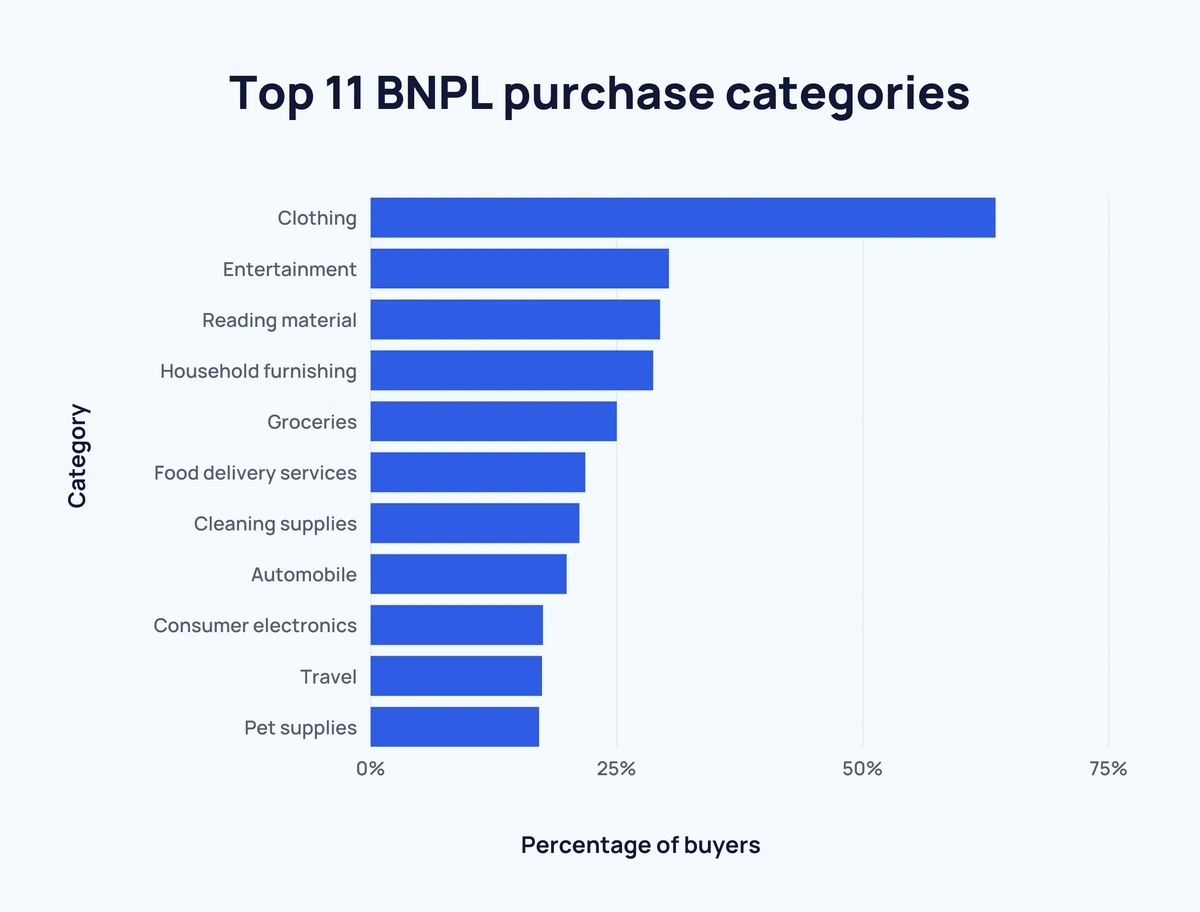
Here is the full list of the top 11 product categories that people tend to use BNPL with:
- Clothing - 63.5%
- Entertainment - 30.3%
- Reading material - 29.4%
- Household furnishing - 28.7%
- Groceries - 25%
- Food delivery services - 21.8%
- Cleaning supplies - 21.2%
- Automobile - 19.9%
- Consumer electronics - 17.5%
- Travel - 17.4%
- Pet supplies - 17.1%
12% of consumers claim to use BNPL "all the time" (C+R Research)
Around 2 in 3 (67%) of consumers use BNPL services at least half of the time when online shopping.
And more than one-third (35%) of consumers use BNPL most of the time.
Here's a closer look at the survey results:
| How Often Consumers Use BNPL When Online Shopping | Proportion |
| All of the time | 12% |
| Most of the time | 35% |
| Half of the time | 20% |
| Some of the time | 20% |
| Rarely/Never | 13% |
BNPL Industry Forecast
Around 2 in 5 people plan to replace their credit cards with BNPL (C+R Research)
Most people (56%) now prefer BNPL to credit cards. That's compared to just 25% who prefer credit cards. The remaining 19% prefer BNPL "sometimes".
Overall, 38% believe that BNPL will eventually replace their credit cards.
Here are the most popular reasons for this:
| Reasons for BNPL Preference | Proportion Who Agree |
| Easier to make payments | 45% |
| More flexible | 44% |
| Lower interest rates | 36% |
| Credit cards are maxed out | 33% |
| Easy approval process | 33% |
| Low credit card limit | 22% |
| No interest | 22% |
Around 2 in 5 Americans use or are interested in BNPL (eMarketer)
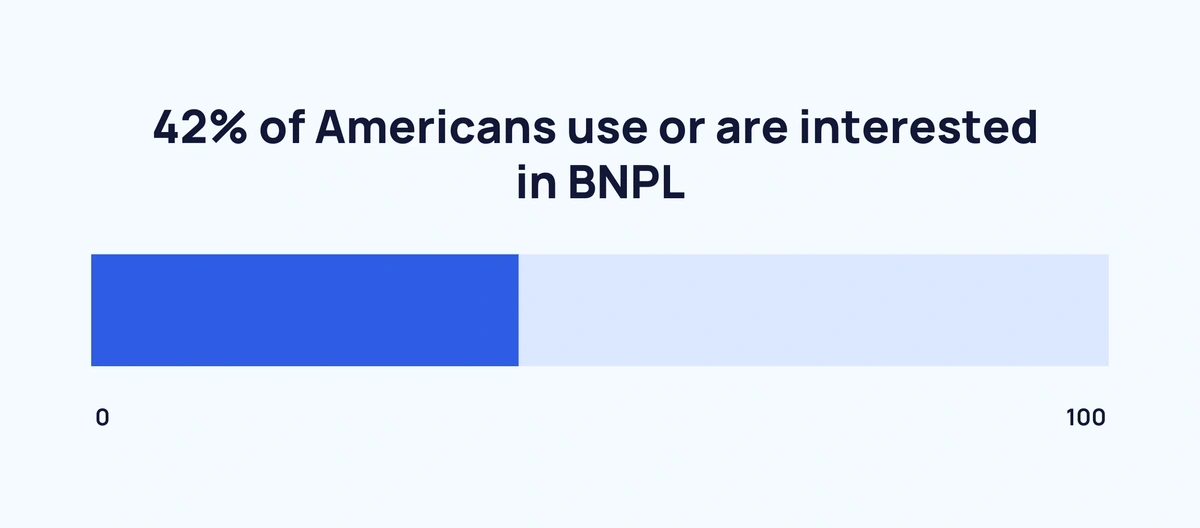
According to a February 2021 survey, 1 in 10 US consumers regularly use BNPL services at checkout.
Of the 80% who have not tried BNPL at all, just over one quarter are at least somewhat interested.
Almost half of all respondents (48%) have not used BNPL services and are not interested.
More than half of consumers regret an expensive purchase (C+R Research)
57% of consumers surveyed admitted to regretting a purchase because it was too expensive.
While 56% have fallen behind on payments. Worryingly, 46% claim that they are likely to make a late payment in the next year.
Conclusion
That wraps up our look at the current state of the BNPL industry.
It's clear that BNPL is one of the fastest-growing ecommerce trends at the moment. And a space that many fintech companies are focused on.
If you'd like to learn more about consumer behavior and buying habits, check out our reports on macro trends and our deep dive into the latest trends impacting the retail sector.
Stop Guessing, Start Growing 🚀
Use real-time topic data to create content that resonates and brings results.

Exploding Topics is owned by Semrush. Our mission is to provide accurate data and expert insights on emerging trends. Unless otherwise noted, this page’s content was written by either an employee or a paid contractor of Semrush Inc.
Share
Newsletter Signup
By clicking “Subscribe” you agree to Semrush Privacy Policy and consent to Semrush using your contact data for newsletter purposes
Written By


Josh is the Co-Founder and CTO of Exploding Topics. Josh has led Exploding Topics product development from the first line of co... Read more