Get Advanced Insights on Any Topic
Discover Trends 12+ Months Before Everyone Else
How We Find Trends Before They Take Off
Exploding Topics’ advanced algorithm monitors millions of unstructured data points to spot trends early on.
Features
Keyword Research
Performance Tracking
Competitor Intelligence
Fix Your Site’s SEO Issues in 30 Seconds
Find technical issues blocking search visibility. Get prioritized, actionable fixes in seconds.
Powered by data from
The Latest Cyber Monday Statistics (2025)
For decades, Black Friday was the premier retail event of the year, with shoppers lining up outside stores to get their hands on the hottest deals.
Since 2005, Cyber Monday has offered an online counterpart. Since then, the period from Thanksgiving to Cyber Monday is known as “Cyber Week” or “Cyber Five”.
With online shopping and e-commerce growing year-over-year, Cyber Monday is looking to unseat Black Friday as the Super Bowl of retail sales days. And while it’s not quite there yet, Cyber Monday continues to generate more sales every holiday season.
Here are the latest Cyber Monday statistics.
Top Cyber Monday Statistics
To get started, read up on these must-know Cyber Monday statistics:
-
Consumers spend a total of $13.3 billion on Cyber Monday each year
-
197 million Americans shopped during Cyber Week last year
-
US buyer activity increases by 512% on Cyber Monday (compared to an average day)
-
90% of the top 50 online retailers offer Cyber Monday discounts
-
The average American plans to spend $1,552 over the full holiday period
Next, we’ll take a look at the numbers from the last Cyber Monday in 2024.
General Cyber Monday Statistics
Here is Cyber Monday 2024 by the numbers:
Consumers spend $13.3 billion on Cyber Monday every year (Adobe)
Last year’s Cyber Monday was a record-setting day for e-commerce sales. The $13.3 billion sales total represents a 7.3% year-over-year growth for the online shopping holiday.
According to Adobe Analytics, shoppers spent $15.8 million every minute during the peak hours (08:00-10:00 PM EST).
197 million Americans shopped during last year’s Cyber Week (NRF)
Here's a breakdown of how many Americans shopped over Cyber Week in previous years:
|
Year |
Number of Shoppers (US) |
Change Over Previous Year |
|
2017 |
174.6 million |
- |
|
2018 |
165.8 million |
↓ 8.8 million |
|
2019 |
189.6 million |
↑ 6.2 million |
|
2020 |
186.4 million |
↓ 3.2 million |
|
2021 |
179.8 million |
↓ 6.6 million |
|
2022 |
196.7 million |
↑ 16.9 million |
|
2023 |
200.4 million |
↑ 3.7 million |
|
2024 |
197 million |
↓ 3.4 million |
Despite a slight drop in the number of shoppers last year, it was still the second-highest Cyber Week participation on record.
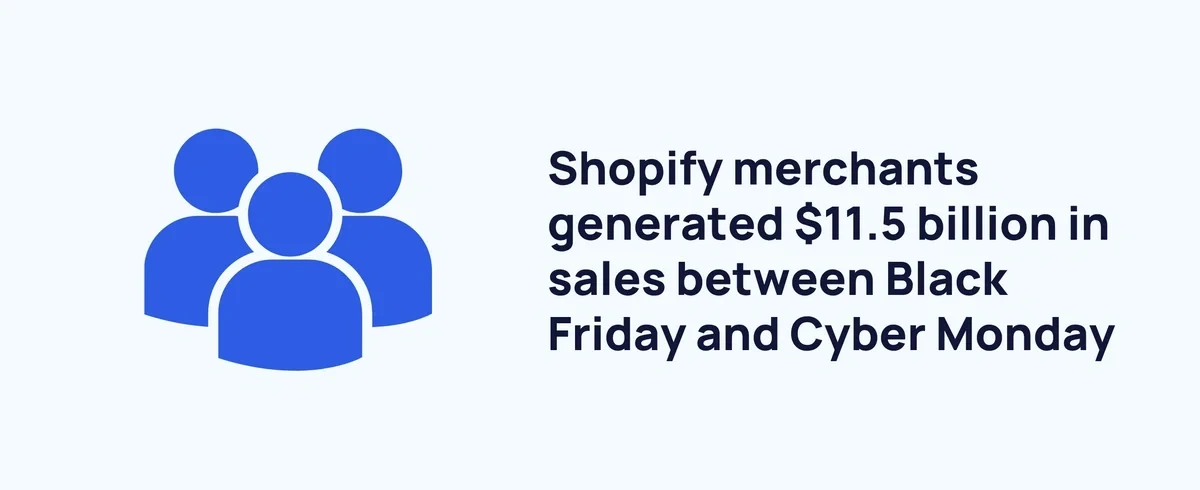
Shopify merchants generated $11.5 billion in sales between Black Friday and Cyber Monday (Shopify)
Shopify sales were up 24% over 2023’s Black Friday/Cyber Monday numbers. That's an increase of $2.3 billion.
In total, 76 million shoppers purchased from Shopify vendors in 2024 – an increase of 15 million on the previous year (61 million).
The average cart totaled $108.56 in 2024. This was almost identical to 2023, increasing by 46 cents.
More than 67,000 Shopify merchants had a record sales day during the Black Friday and Cyber Monday period.
Online shoppers outnumbered in-store shoppers all but one day during Cyber Week (NRF)
Cyber Monday is the top day for e-commerce during Cyber Week. On Cyber Monday 2024, online shoppers outnumbered in-store shoppers by 42.2 million.
However, online shopping is increasingly dominant across the whole of Cyber Week. There were more online than in-store shoppers on all but one day of Cyber Week in 2024.
Here is a breakdown by day:
-
Thanksgiving: 26.1 million in-store / 28.6 million online
-
Black Friday: 81.7 million in-store / 87.3 million online
-
Saturday: 61.1 million in-store / 53.9 million online
-
Sunday: 25.6 million in-store / 32.8 million online
-
Cyber Monday: 23.2 million in-store / 64.4 million online
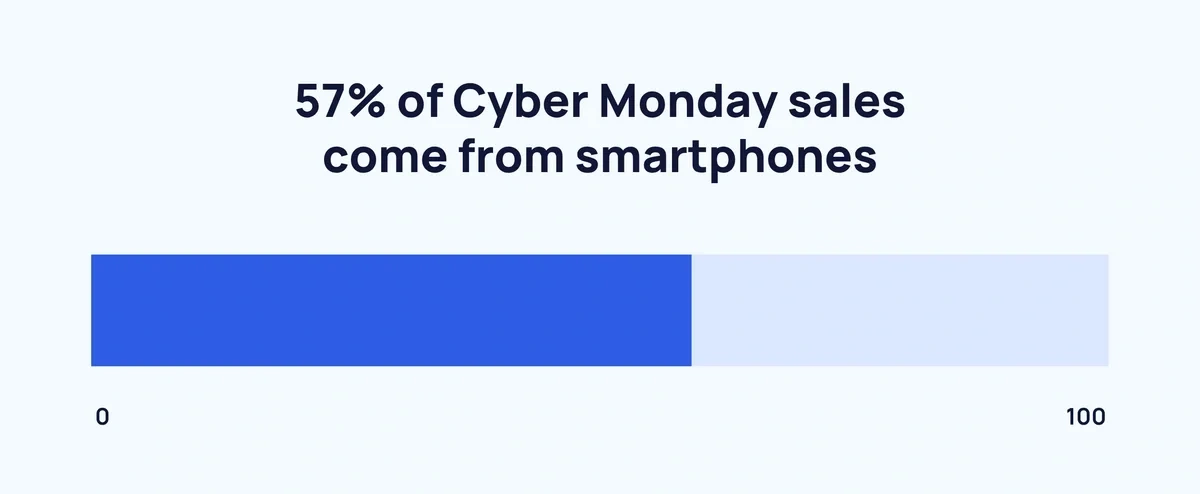
Over half of Cyber Monday sales come from smartphones (Adobe)
Mobile shopping continues to dominate on Cyber Monday, with smartphone sales accounting for 57% of all sales in 2024. That's slightly down on 59% in 2023, but up on 55% in 2022.
Meanwhile, mobile spending on Cyber Monday increased by 13.3% compared with 2023, hitting $7.6 billion in 2024.
Cyber Monday discounts for electronics peaked at 30.1% in 2024 (Adobe)
Certain product categories saw a massive jump in discounts during Cyber Monday, but no category was reduced as much as electronics.
Here are the product categories that recorded the largest price reductions on Cyber Monday 2024:
-
Electronics (30.1%)
-
Toys (26.1%)
-
Apparel (23.2%)
-
Televisions (21.8%)
-
Computers (21.5%)
Cyber Monday Consumer Statistics
How aware are shoppers of Cyber Monday deals? These statistics reveal how consumers approach Cyber Monday: where they shop, how much they’re willing to spend, and what they expect from their shopping experience.
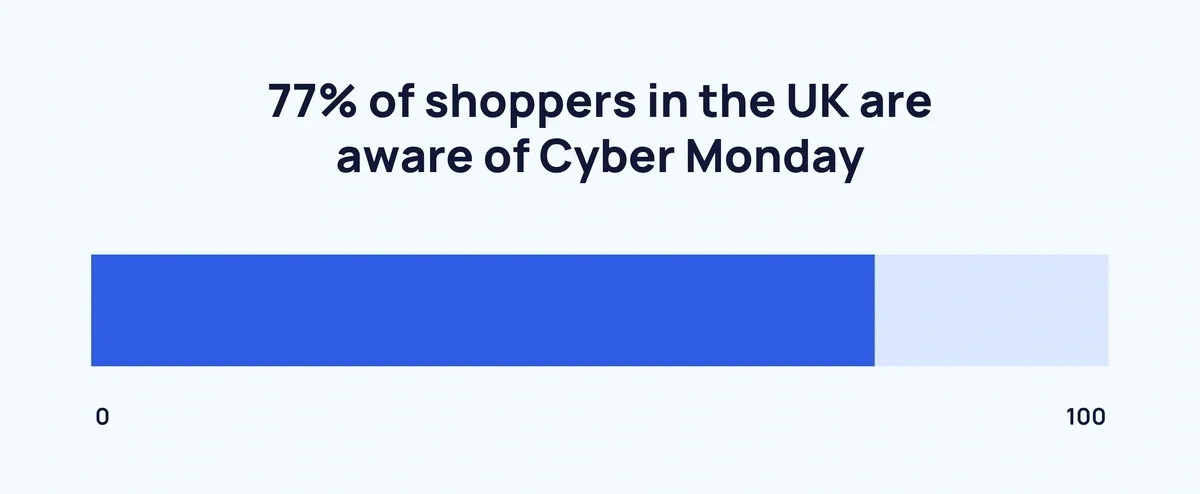
In Europe, UK consumers are among the most aware of Cyber Monday (Boston Consulting Group)
Nearly 100% of Europeans are aware of Black Friday, but Cyber Monday is a different story. The UK has the joint-highest awareness at 77%, tied with Spain and Germany. In other European countries, Cyber Monday is still catching on: just 49% of French and 68% of Swiss shoppers are aware of the event.
Globally, Canadian consumers (86%) are the most aware of Cyber Monday outside of the US (94%). Cyber Monday also has reasonable penetration in Australia (64%).
US buyer activity increases by 512% on Cyber Monday (compared to an average day) (Cyber Monday.Global)
American consumers go into a shopping frenzy on Cyber Monday, increasing their buying activity by over 500%.
But that spike in shopping behavior isn’t limited to the US. In Canada, shopping activity increases by 598% on Cyber Monday. In New Zealand, shopping increases by 577%. All three nations are well ahead of the global average increase of 148%.
On Black Friday 2024, per Adobe, US toy sales increased by 680% vs an average day. Personal care sales increased by 530%.
90% of US shoppers are satisfied with their Black Friday and Cyber Monday shopping experience (Cyber Monday.Global)
Most American shoppers are happy with the Cyber Week shopping experience, but 1 in 10 are left feeling dissatisfied.
What sort of experiences turn shoppers off? Surveyed shoppers gave a variety of answers:
-
59% mentioned unattractive discounts
-
53% said they weren’t interested in products on sale
-
35% said discounted products sold out too quickly
-
18% said in-store lines were too long
-
17% mentioned slowly loading websites
-
10% said discount codes didn’t work
36% of US consumers have lost enthusiasm for Black Friday and Cyber Monday in the last 2-3 years (YouGov)
In a survey ahead of Cyber Week 2025, 35% of Americans expressed lower enthusiasm for the event compared to 2-3 years ago. These are the top reasons why:
-
Discounts are misleading (63%)
-
Poor quality items on offer (42%)
-
The novelty has worn off (37%)
-
Changes in financial situation (34%)
-
Too much advertising (26%)
-
There are too many sales events throughout the year (24%)
Despite this, participation in Cyber Monday sales is expected to hit 38%, up from 34% in 2024.
Cyber Monday spending exceeds Black Friday (Adobe)
Total spending on Cyber Monday 2024 hit $13.3 billion. That's $0.9 billion more than Black Friday 2024's figure of $12.4 billion.
Here are the forecast figures for 2025 spending on key dates:
-
Cyber Monday – $14.2 billion
-
Black Friday – $11.7 billion
-
Thanksgiving – $6.4 billion
On that basis, you could declare Cyber Monday the bigger sales event. But consumer awareness of Black Friday remains higher.
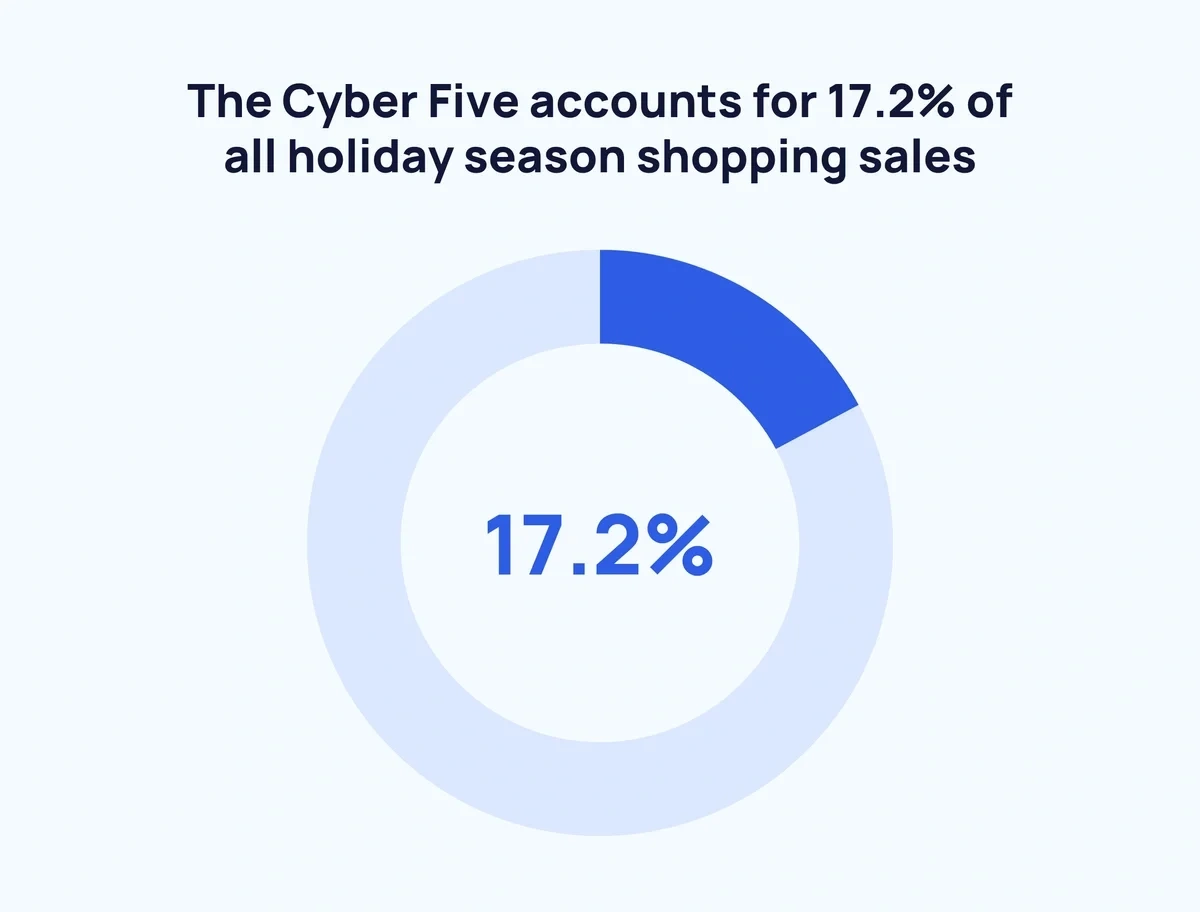
The Cyber Five is projected to make up 17.2% of 2025 holiday season shopping sales (Adobe)
The five-day stretch between Thanksgiving and Cyber Monday are prime days for holiday shopping.
In 2025, the Cyber Five is predicted to amount to 17.2% of holiday season sales (the period stretching from November 1 to December 31).
From 2017-2021, the Cyber Five averaged 18.3% of holiday season shopping sales. That dropped to 15.6% in 2022, and 15.5% in 2023.
The average American plans to spend $1,552 across the 2025 holiday period (PwC)
The planned average consumer spend of $1,552 would be a 5% decline compared to 2024. Gift spending is set to drop by 11%.
The biggest drop is among Gen Z. They expect to reduce holiday budgets by 23%.
More than half of consumers get gift inspiration from TikTok unboxings and reviews (Retail Dive)
TikTok is now a major driver of purchases, both as a source of inspiration and as an actual shopping destination. TikTok Shop is leading the rise in social commerce.
"Unboxings" are especially popular. Especially when influencers are receving blind boxes: a huge holiday trend for 2025.
Gen Z and Millennials are the most likely to participate in Black Friday and Cyber Monday in the US (YouGov)
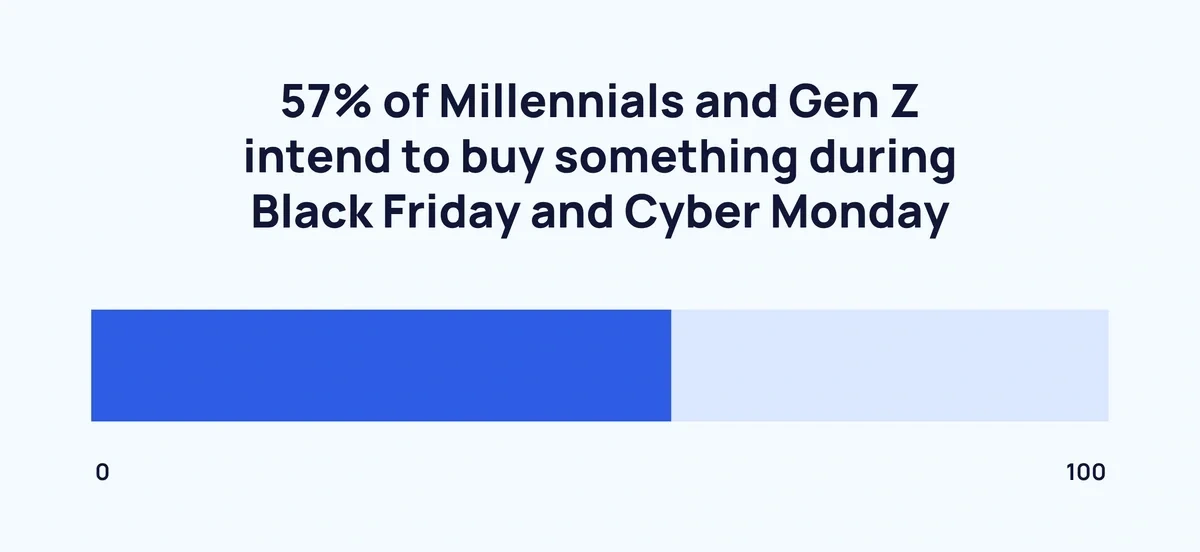
Despite planning to cut back on spending, younger US consumers are still most likely to participate in Black Friday and Cyber Monday sales. 57% of Millennials and Gen Z consider themselves likely to make purchases.
Gen X and Baby Boomers are the least enthused. Only 38% anticipate making a purchase.
Women are more likely than men to shop during Black Friday and Cyber Monday (YouGov)
50% of US women intend to make a Black Friday or Cyber Monday purchase. At 42%, men are slightly less likely to get involved.
Consumers are still mostly reluctant to use AI tools to navigate Black Friday and Cyber Monday (YouGov)
ChatGPT has launched Instant Checkout in time for Black Friday and Cyber Monday 2025. This will allow users to buy certain items from within the AI chatbot.
But agentic commerce is yet to become mainstream. Only 16% of 2025 holiday shoppers say they are likely to use AI tools, rising slightly to 20% among younger consumers.
Cyber Monday Promotion Statistics
Just like Black Friday, Cyber Monday is all about deals and discounts. These statistics explore how retailers attract new shoppers through marketing and promotions.
You can read our list of Black Friday marketing ideas here. In the meantime, let's jump ino the Cyber Monday promotion statistics:
The vast majority of the top 1000 online retailers offer Cyber Monday discounts (Digital Commerce 360)
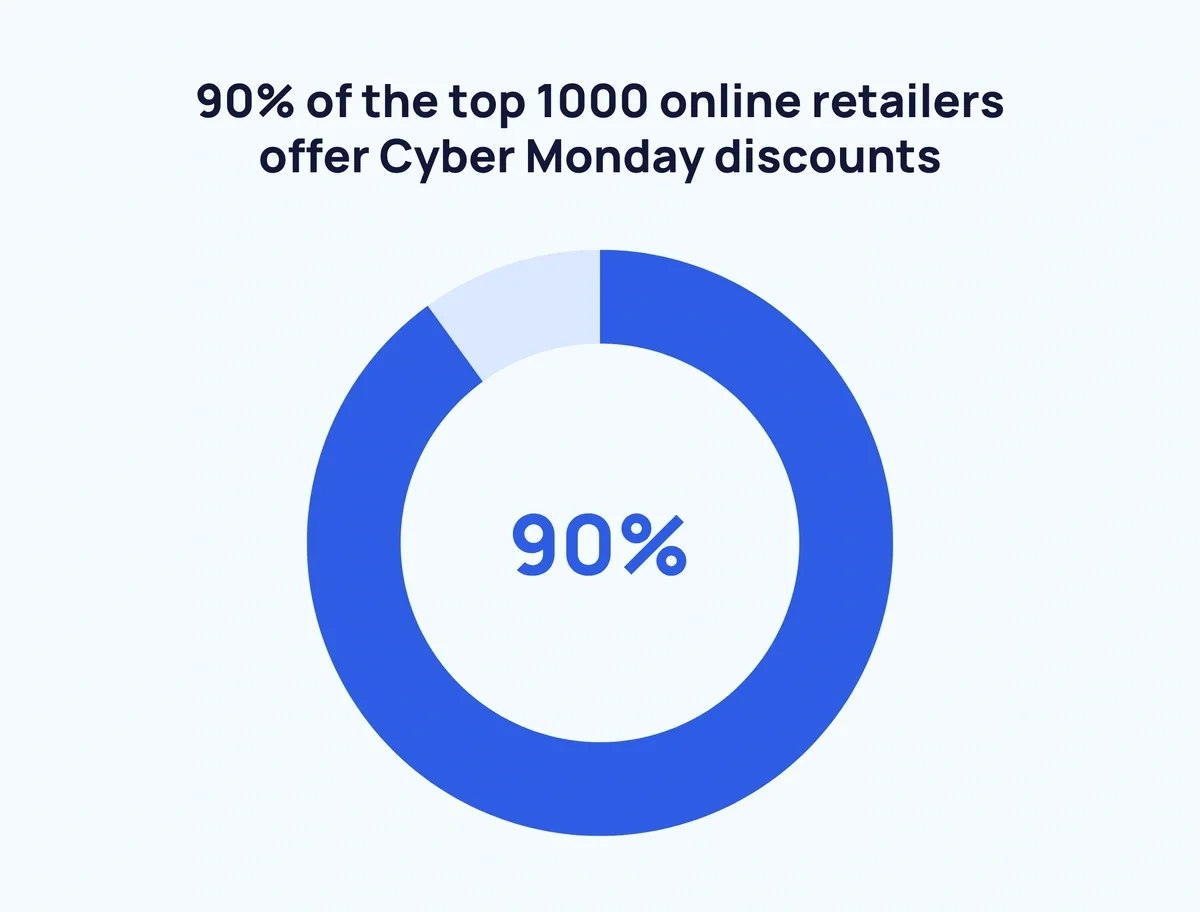
In a survey of 100 online retailers from within the top 1000, 90% said they offered deals on Cyber Monday.
91.7% of those retailers specifically mentioned Cyber Monday in the promotions. 7.1% still referenced Black Friday, and 7.1% looked ahead to Christmas.
Amazon ad sales increase by 96% on Cyber Monday (Forbes)
Despite promotions now stretching across Cyber Week, Cyber Monday itself still sees a 96% jump in Amazon ad spending compared to the day prior.
Amazon ad spending on Cyber Monday 2024 was up 23.3% YoY, while cost-per-click rose 15.8% to $2.12.
Social media is the top channel for Gen Z and Millennials to find Black Friday and Cyber Monday sales (YouGov)
54% of Gen Z and Millennials in the US are most likely to notice Black Friday and Cyber Monday sales through social media.
For the general population, online shopping websites (47%) narrowly remain the main way of noticing sales, followed by social media (45%), online ads (44%), and specific retailer websites and apps (39%).
Key Takeaways
Cyber Monday is one of the most important days of the year for many e-commerce businesses. Millions of shoppers take to their desktops and mobile devices to find deals leading up to the holiday season. Those deals generate billions of dollars in sales. For many online retailers, sales can skyrocket to four or five times the average number.
Will Cyber Monday ever overtake Black Friday as the top shopping day of the year? Has it arguably done so already?
It’s difficult to say. With Black Friday deals moving online and many retailers offering promotions throughout Cyber Week, perhaps it doesn’t really matter.
Stop Guessing, Start Growing 🚀
Use real-time topic data to create content that resonates and brings results.
Exploding Topics is owned by Semrush. Our mission is to provide accurate data and expert insights on emerging trends. Unless otherwise noted, this page’s content was written by either an employee or a paid contractor of Semrush Inc.
Share
Newsletter Signup
By clicking “Subscribe” you agree to Semrush Privacy Policy and consent to Semrush using your contact data for newsletter purposes
Written By


Josh is the Co-Founder and CTO of Exploding Topics. Josh has led Exploding Topics product development from the first line of co... Read more


