


Get Advanced Insights on Any Topic
Discover Trends 12+ Months Before Everyone Else
How We Find Trends Before They Take Off
Exploding Topics’ advanced algorithm monitors millions of unstructured data points to spot trends early on.

Keyword Research
Performance Tracking
Competitor Intelligence
Fix Your Site’s SEO Issues in 30 Seconds
Find technical issues blocking search visibility. Get prioritized, actionable fixes in seconds.
Powered by data from
Latest Blog Posts
Featured Case Studies
See what's trending before everyone else
Each week, we'll send you our best Exploding Topics. Plus, expert insight and analysis.
Demographic transition statistics in the US and worldwide (2025)

Demographic transition refers to the reduction in birth and death rates, resulting in a population that gets steadily older over time and eventually begins to decline.
The model dictates that developed countries transition toward this “graying” population, as various factors including improved healthcare and better access to contraception make an impact at both ends of the life cycle.
The statistics show that demographic transition is already well underway in the US and in many other countries around the world. This article will explore the data and examine the impact of this societal shift, as well as looking at other demographic trends in America and beyond in 2025.
Demographic transition (Top stats)
- There will be more deaths than births in the US by 2036
- Factoring in immigration, the US population will peak in 2080
- The median age in the US is 38.5, up from 34.3 in the year 2000
- Without immigration, the working-age US population would not have grown since 2000
- Three-fifths of advanced economies worldwide already have more deaths than births
- Two-thirds of the global population live in countries where fertility is below the replacement rate
- The global population is projected to peak at 10.3 billion in the mid-2080s
- China is forecast to lose over half of its current population by 2100
What is the demographic transition model?
The demographic transition model breaks societies into five stages.
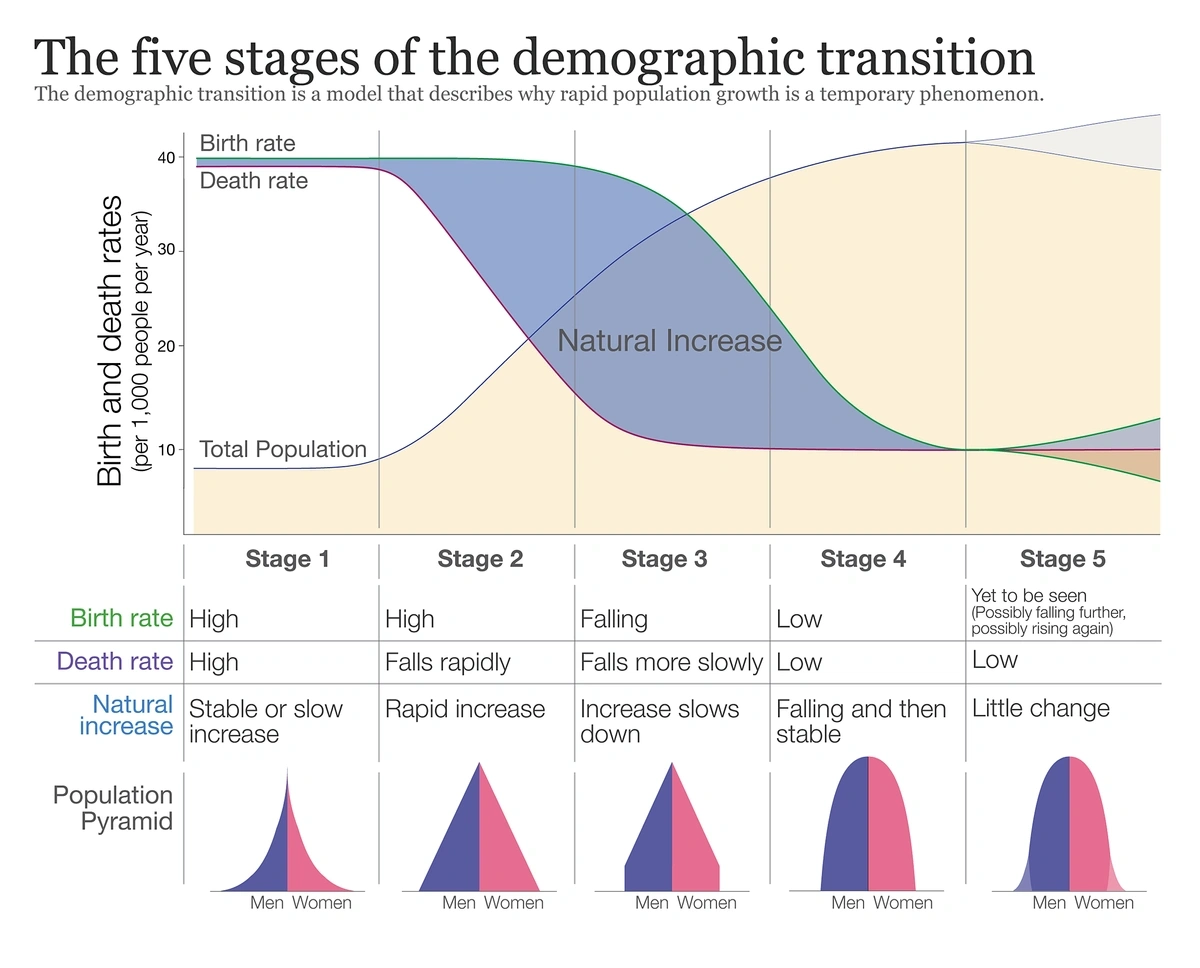
Stage 1 is “high stationary”. Lack of education and contraception keeps birth rates very high, but lack of medicine means death rates are similarly high.
Stage 2 is “early expanding”. Birth rates remain broadly the same as in Stage 1, but basic advancements in health, sanitation and medicine bring the death rate down, causing a sharp spike in population growth.
Stage 3 is “late expanding”. Deaths continue to come down, albeit at a less sharp rate, but the birth rate also falls steeply. This can be attributed to greater employment opportunities for women, as well as wider availability of contraception.
Stage 4 is “low stationary”. As in Stage 1, births and deaths effectively cancel out — in this case because both are similarly low, rather than similarly high.
Stage 5 has been added to the original model. It is the least clear-cut, but is generally considered to be characterized by population decline.
US birth and death rates
There are more births than deaths in the US, meaning the population continues to increase. In 2025, the estimated population is 343.6 million, an increase of over 61 million in the past 25 years.
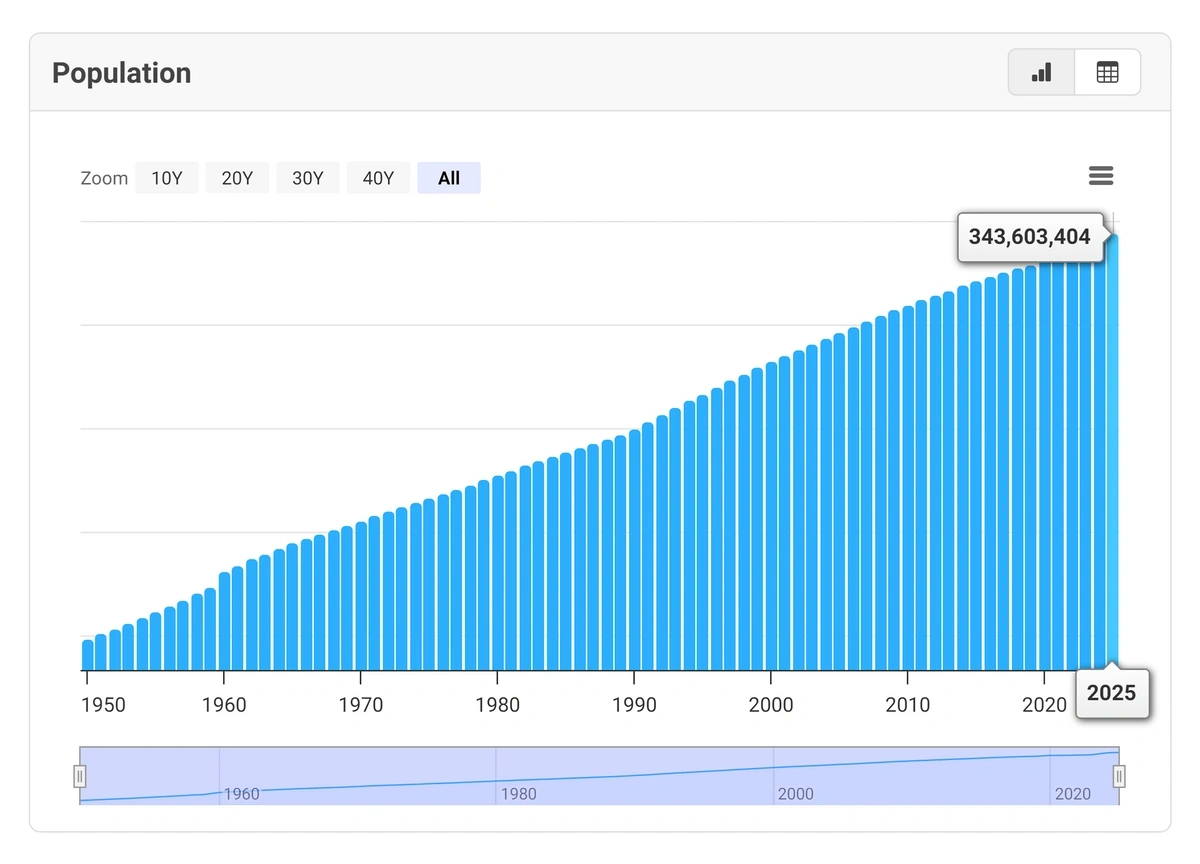
However, the US is close enough to the point where births and deaths cancel out that it can be considered to be in Stage 4 of the Demographic Transition Model.
There were 3.6 million recorded births in the US in 2024. The latest annual death figures are close to 3.1 million.
The Wharton School projects that there will be more deaths than births in the USA by 2036.
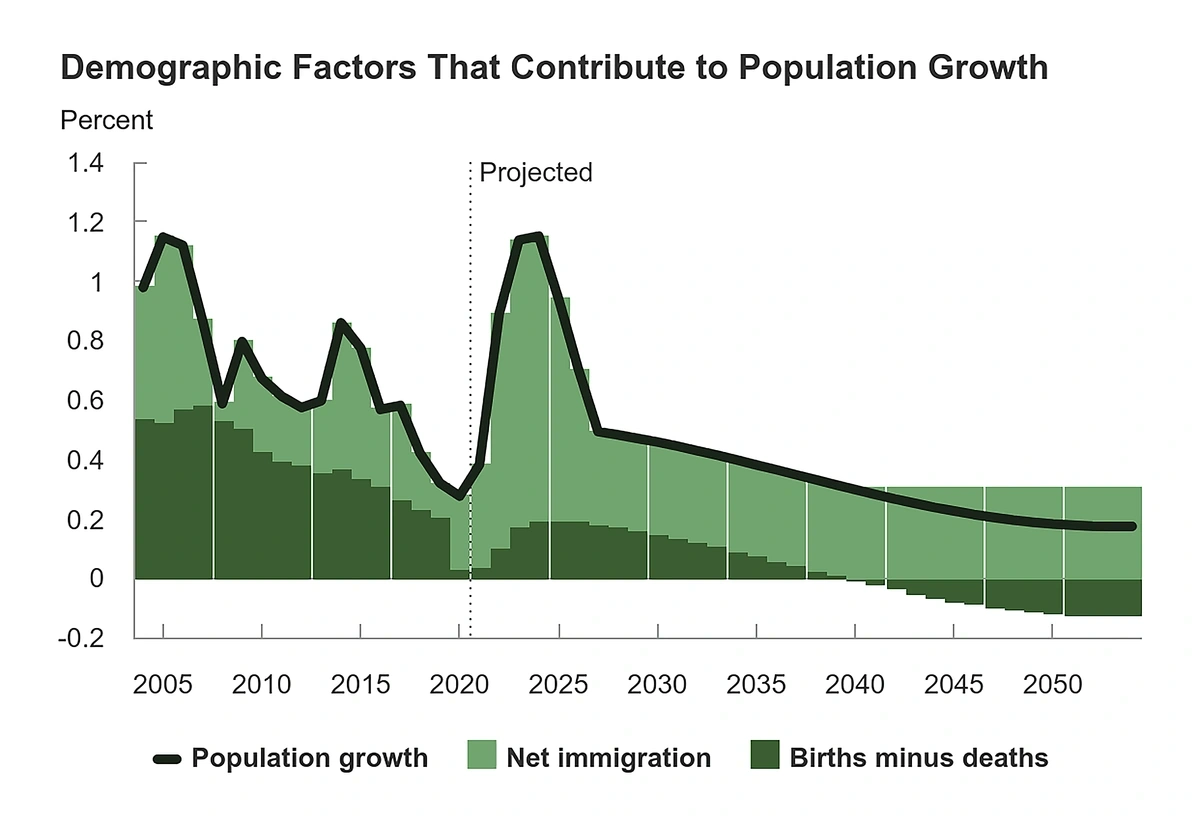
US immigration rates
Births and deaths are not the only factor in population growth. Immigration also plays a part.
Net migration to the US is higher than the net birth rate, making it the largest contributor to continued population growth.
US net migration estimates vary. Congressional Budget Office (CBO) figures show net migration of 2.7 million in 2024, down from 3.3 million in 2023. It estimates net migration of 2 million for 2025.
Other sources have lower figures. MacroTrends reports net migration of just under 1.3 million last year, although it agrees that net migration declined compared to 2023.
Using the CBO figures, net migration to the US is approximately 5.4 times higher than the net birth rate.
When will the US population begin to decline?
Factoring in both immigration and birth and death rates, the Census Bureau projects that the US population will peak at around 370 million in 2080.
By 2100, it is forecast to have fallen to 366 million. That’s only 6.5% higher than it is today.
Average age of the US population
As both birth and death rates fall, the average age of the population inevitably increases.
The median age in the US is 38.5. That’s an increase of 4.2 years from the median age in 2000.
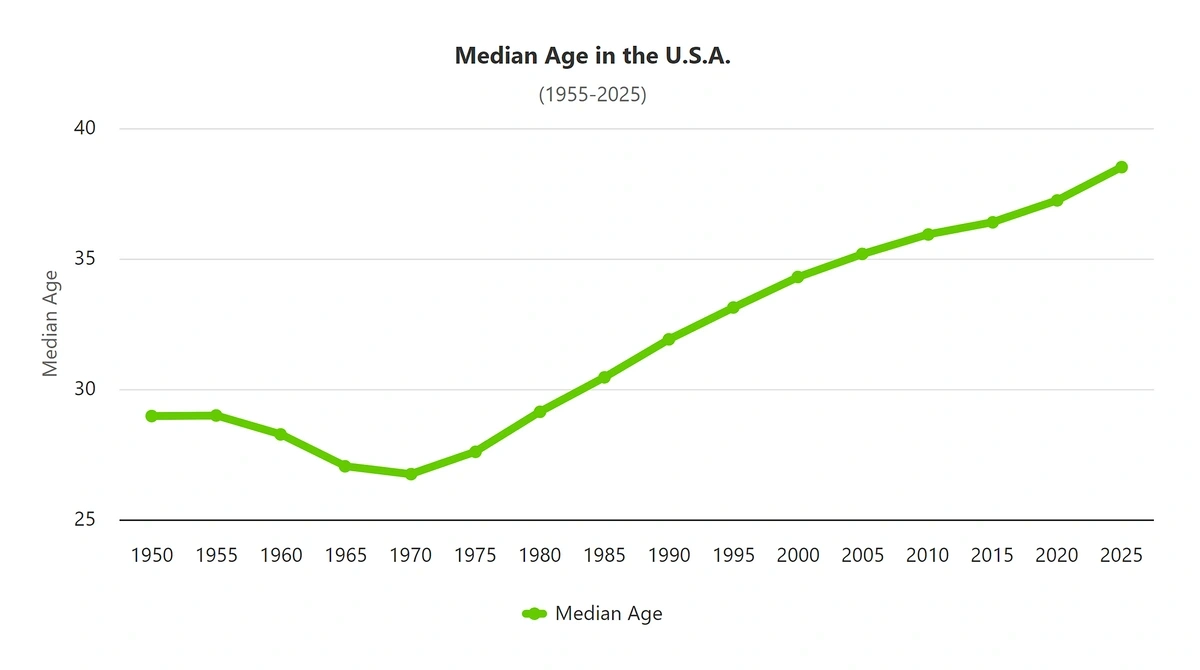
This increase would be even more pronounced without the impact of immigration. The average age of newly arrived immigrants is 31.
Impacts of an aging population in the US
Traditionally, a large working-age population has supported a smaller generation of elderly people. Demographic transition is putting a strain on that model.
4.2 million Americans are expected to reach retirement age in 2025. That’s a record high.
At the last count in 2023, over 50 million retired workers received Social Security benefits, up from 34.59 million in 2010.
That’s compared to a total workforce of around 170 million. The "dependency ratio” is therefore somewhere between 1:3 and 1:4. In 2000, it was 1:5.5.
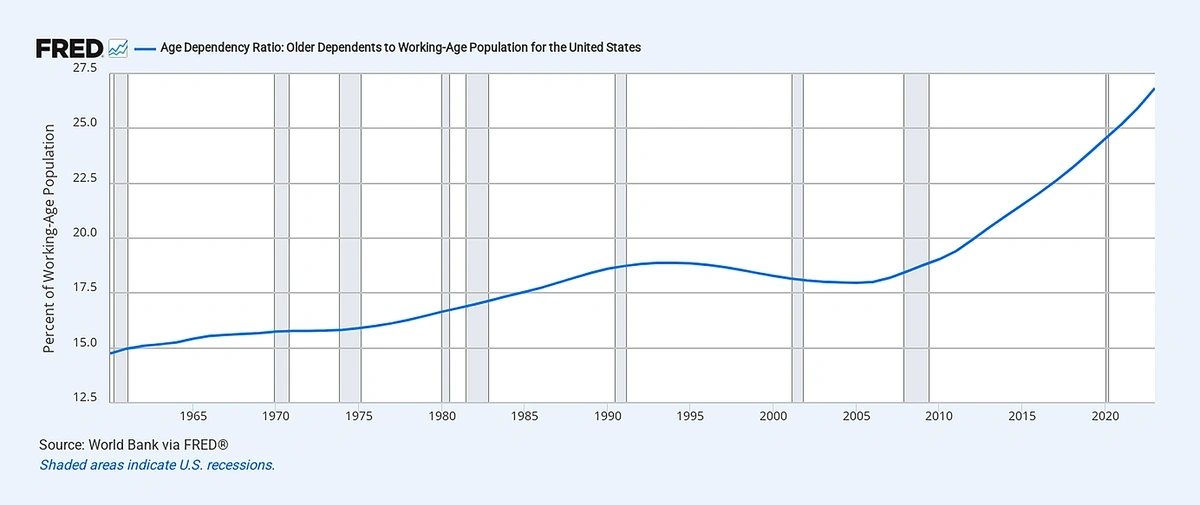
An ever-increasing ratio of dependents is financially unsustainable. The US has sought to combat the problem this year by raising the age at which people can claim full Social Security benefits from 65 to 67.
Meanwhile, at least in the short term, the aging population incentivizes allowing higher immigration in order to rebalance the dependency ratio. Between 2000 and 2023, immigrant-origin adults accounted for all of the net growth in the US working-age population.
Demographic transition worldwide
Demographic transition is not only affecting the US. In fact, some other developed countries are significantly further along in the process.
Overall, two-thirds of the global population lives in countries where fertility is below the replacement rate of 2.1 children per family.
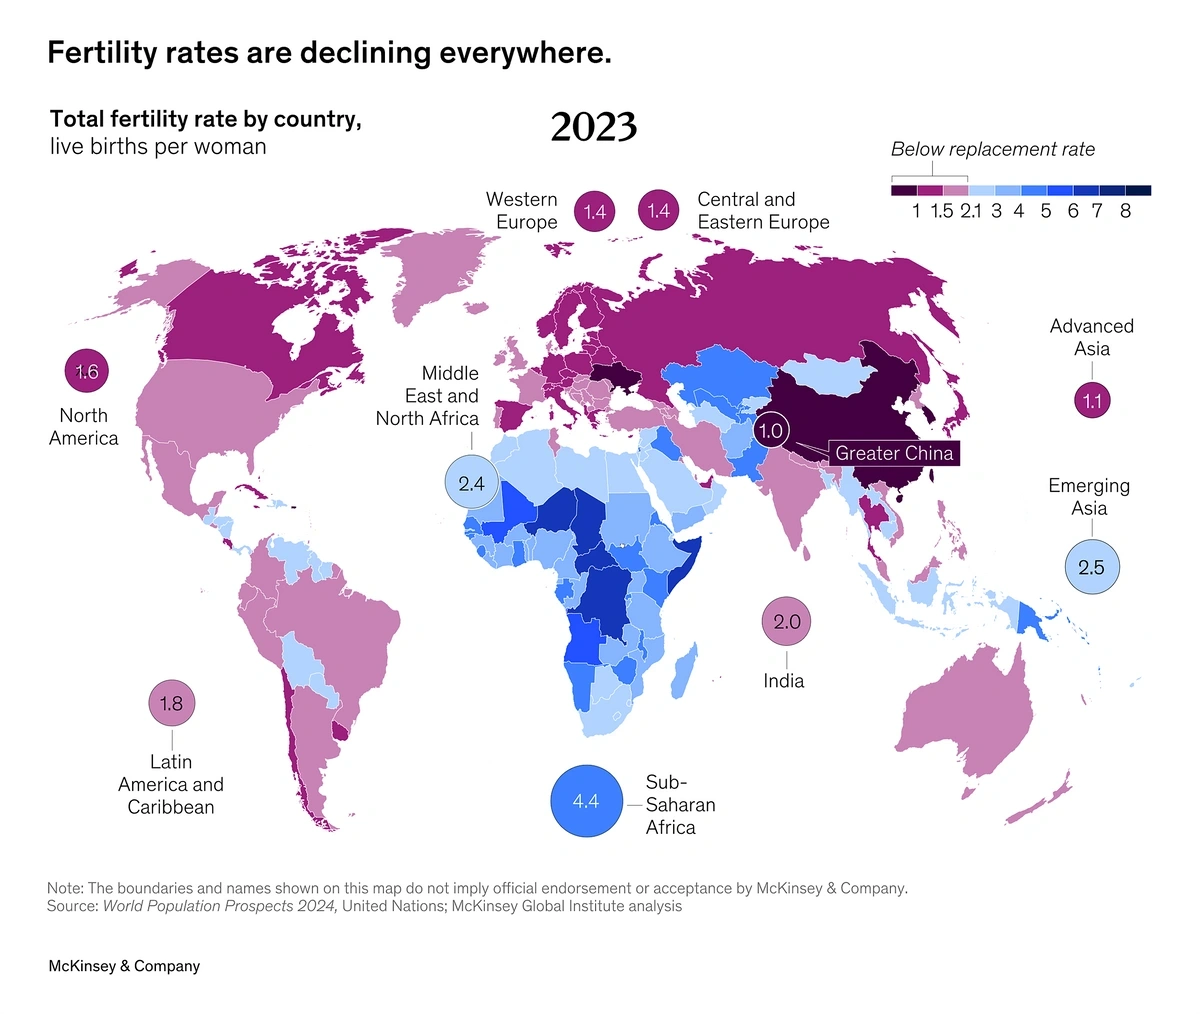
And some major economies could see their population fall by 20 to 50 percent by 2100 (versus a projected growth of 6.5% in the US).
Three-fifths of countries with advanced economies already have more annual deaths than births, including the UK and China. Europe in particular is showcasing this pattern.
Countries in red experienced more deaths than births in 2024.
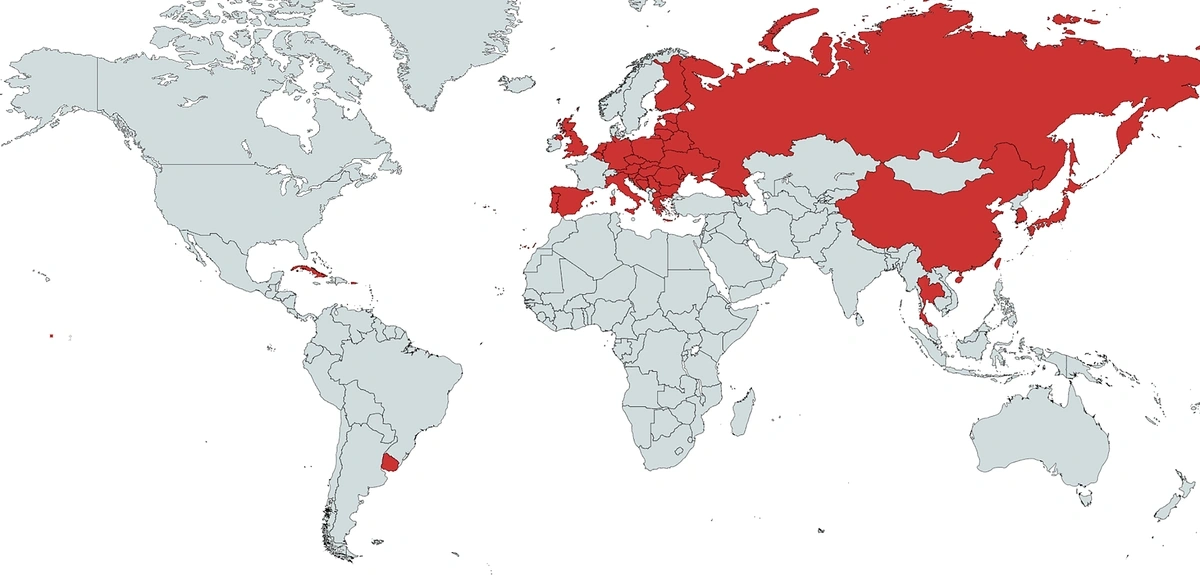
However, immigration means that not all of these countries are currently experiencing population decline.
Inclusive of migration, here are the net annual population changes in a selection of 20 countries worldwide, according to data from the CIA:
| Country | Net annual population change |
| Poland | -1% |
| Russia | -0.49% |
| Japan | -0.43% |
| Germany | -0.12% |
| Italy | -0.08% |
| France | +0.2% |
| China | +0.23% |
| UK | +0.45% |
| Brazil | +0.61% |
| USA | +0.67% |
| Canada | +0.71% |
| Mexico | +0.72% |
| India | +0.72% |
| Australia | +1.13% |
| Saudi Arabia | +1.68% |
| Pakistan | +1.86% |
| Senegal | +2.46% |
| Nigeria | +2.52% |
| Niger | +3.66% |
| South Sudan | +4.65% |
The worldwide demographic transition is also reflected in median ages. The vast majority of national populations have gotten older, on average, in the last 25 years.
Here’s a list of median ages by country in 2000 and 2025:
| Country | Median age in 2000 | Median age in 2025 | 25-year change in median age |
| Japan | 40.7 | 49.9 | +9.2 |
| Italy | 39.2 | 48.4 | +9.2 |
| Germany | 39.0 | 46.8 | +7.8 |
| France | 36.6 | 42.6 | +6 |
| UK | 36.6 | 40.8 | +4.2 |
| Canada | 35.7 | 42.6 | +6.9 |
| Russia | 35.7 | 41.9 | +6.2 |
| Australia | 34.3 | 38.1 | +3.8 |
| USA | 34.2 | 38.9 | +4.7 |
| Poland | 34.2 | 42.9 | +8.7 |
| China | 28.9 | 40.2 | +11.3 |
| Brazil | 24.1 | 35.1 | +11 |
| Mexico | 21.7 | 30.8 | +9.1 |
| India | 21.1 | 29.8 | +8.7 |
| Saudi Arabia | 19.7 | 32.4 | +12.7 |
| Pakistan | 16.9 | 22.9 | +6 |
| Nigeria | 16.8 | 19.3 | +2.5 |
| Senegal | 16.5 | 19.2 | +2.7 |
| South Sudan | 16.1 | 18.7 | +2.6 |
| Niger | 15.2 | 15.2 | +0 |
Stage 1 Demographic Transition Model countries
No countries are classed as Stage 1 in the Demographic Transition Model. All have progressed to at least Stage 2.
Stage 2 Demographic Transition Model countries
A total of 43 countries are in Stage 2 of the Demographic Transition Model. They are characterized by high birth rates and a death rate that is beginning to fall.
Here are all the countries considered to be in Stage 2:
- Afghanistan
- Angola
- Benin
- Burkina Faso
- Burundi
- Cameroon
- Central African Republic
- Chad
- Comoros
- DR Congo
- Eritrea
- Eswatini
- Ethiopia
- Gambia
- Guinea
- Guinea-Bissau
- Haiti
- Iraq
- Ivory Coast
- Lesotho
- Liberia
- Madagascar
- Malawi
- Mali
- Mauritania
- Mozambique
- Niger
- Pakistan
- Papua New Guinea
- Republic of the Congo
- Rwanda
- Sao Tome and Principe
- Senegal
- Sierra Leone
- Somalia
- South Sudan
- Sudan
- Tanzania
- Timor-Leste
- Togo
- Uganda
- Zambia
- Zimbabwe
Stage 3 Demographic Transition Model countries
The majority of countries are considered to be in Stage 3 of the Demographic Transition Model. That means birth rates are beginning to fall steeply, and death rates are coming down more slowly — but births still outnumber deaths.
A total of 75 countries are in Stage 3 of the DTM:
- Algeria
- Azerbaijan
- Bangladesh
- Belize
- Bhutan
- Bolivia
- Botswana
- Brazil
- Bulgaria
- Cambodia
- China
- Colombia
- Costa Rica
- Cuba
- Djibouti
- Dominica
- Dominican Republic
- Ecuador
- Egypt
- El Salvador
- Equatorial Guinea
- Fiji
- Gabon
- Ghana
- Grenada
- Guatemala
- Guyana
- Honduras
- India
- Indonesia
- Israel
- Jamaica
- Jordan
- Kazakhstan
- Kenya
- Kiribati
- Kyrgyzstan
- Laos
- Lebanon
- Libya
- Malaysia
- Maldives
- Mauritius
- Mexico
- Micronesia
- Mongolia
- Morocco
- Myanmar
- Namibia
- Nepal
- Nicaragua
- Nigeria
- Palau
- Paraguay
- Peru
- Philippines
- Saint Kitts and Nevis
- Saint Lucia
- Saint Vincent and the Grenadines
- Samoa
- Saudi Arabia
- Solomon Islands
- South Africa
- Sri Lanka
- Suriname
- Syria
- Tajikistan
- Tonga
- Tunisia
- Turkey
- Turkmenistan
- Uzbekistan
- Vanuatu
- Venezuela
- Vietnam
Stage 4 Demographic Transition Model countries
35 countries are in Stage 4 of the Demographic Transition Model. This is where birth and death rates have roughly equalized at historically low levels:
- Andorra
- Argentina
- Armenia
- Australia
- Austria
- Bahrain
- Barbados
- Brazil*
- Canada
- Chile
- China*
- Denmark
- Estonia
- Finland
- France
- Hungary
- Iceland
- Ireland
- Italy
- Latvia
- Lithuania
- Malta
- Montenegro
- New Zealand
- Norway
- Papua New Guinea*
- Serbia
- Seychelles
- Singapore
- South Korea
- Spain
- Sweden
- Switzerland
- United Kingdom
- United States
*Listed in two different stages per World Population Review data
Stage 5 Demographic Transition Model countries
7 countries have reached Stage 5 of the Demographic Transition Model, whereby the death rate has moved clearly above the birth rate. 6 are in Europe:
- Croatia
- Estonia*
- Germany
- Greece
- Japan
- Portugal
- Ukraine
*Listed in two different stages per World Population Review data
When will the global population start to decline?
The current global population is a little over 8 billion, a milestone that it reached in November 2022. That figure represented a growth of 1 billion people in just 12 years.
Growth to 9 billion is expected to take a little longer. It is projected to occur in 2037, 15 years after the population hit its last billion-person landmark.
The UN predicts that the global population will peak at 10.3 billion in the mid-2080s.
After that, the initial decline will be very gradual, down to roughly 10.2 billion by 2100.
1 in 4 people live in a country where the population has already peaked. The majority of significant population growth is concentrated in sub-Saharan Africa.
In focus: Demographic transition in China
Remarkably, China is expected to lose more than half of its current population by 2100, returning to figures not seen since the late 1950s.
Its population is expected to fall by 204 million in the next 30 years. By comparison, the next-sharpest projected declines are Japan (21 million) and Russia (10 million).
Although the CIA recorded a very slight increase in China’s population last year, other sources say it has actually decreased for the past 3 years.
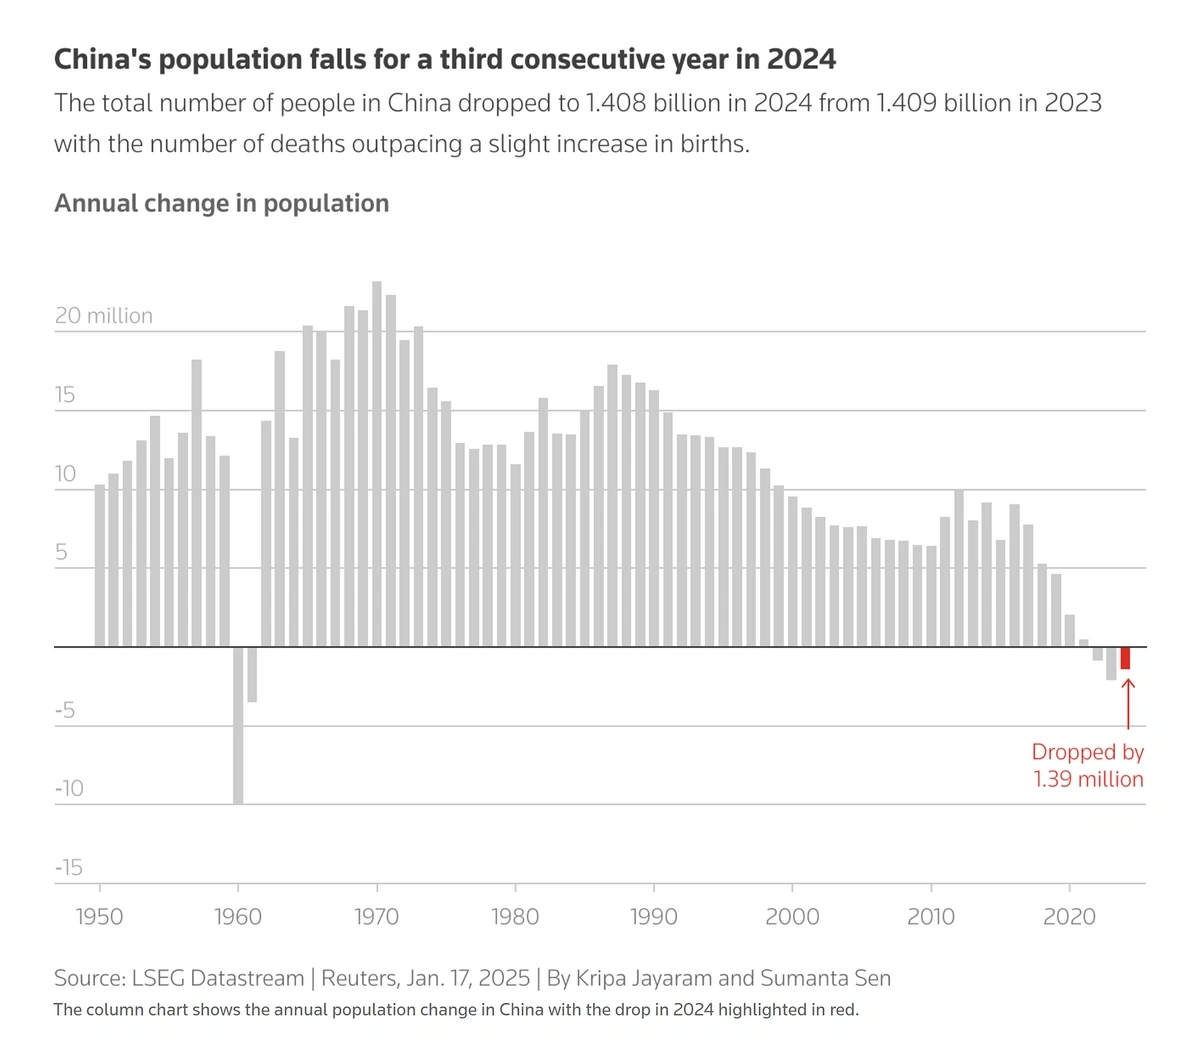
Last year, there were 9.54 million births and 10.93 million deaths. 22% of the population is aged 60 or over, and the average age has increased to over 40.
Some of the factors in China’s declining birth rate are the same across the world. A recent UN study spanning 5 continents found that 2 in 5 people over the age of 50 have had fewer children than they wanted, with 54% citing economic concerns as a factor.
However, China specifically is also feeling the major effect of its previous one-child policy. This was in effect from 1980 to 2015, limiting families to one child.
That has now completely reversed, with China fearing a population crisis. Last year, the government called on its universities to introduce “love education”, promoting positive views on marriage, fertility, and family.
Conclusion
The world is changing in many ways. Major countries will need to contend with a spike in old-age dependents at the same time as a wave of AI and automation that could put millions out of work.
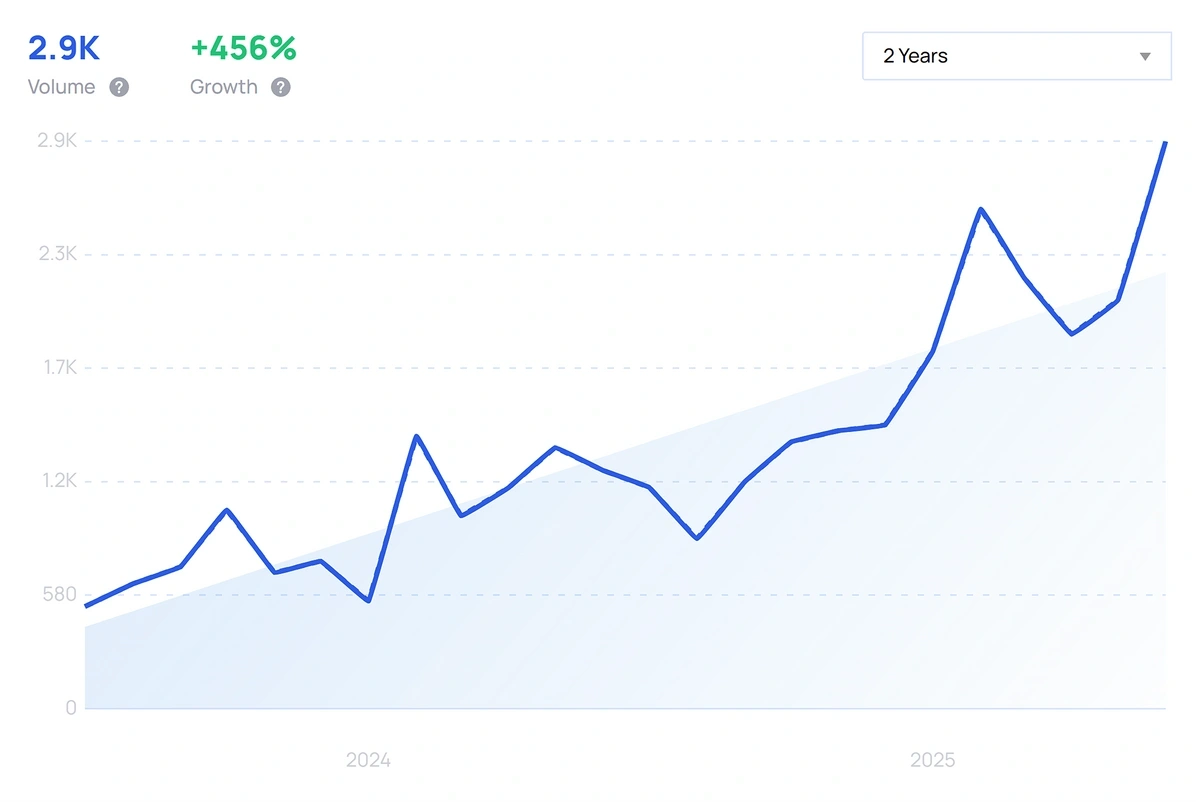
Searches for “AI job losses” are up by 456% in the last 2 years.
Societies are close to a breaking point that will require a rewriting of the entire social contract. The US will have more deaths than births in a little over a decade, a mark already crossed by China, Russia, and a whole host of European nations.
Meanwhile, the global population will peak in a little over 60 years. The onus is on national leaders to work together and find solutions because the demographic transition trends are impossible to ignore.
You might also like our lists of Gen Z statistics, Gen Alpha trends, and internet user stats.
Stop Guessing, Start Growing 🚀
Use real-time topic data to create content that resonates and brings results.

Exploding Topics is owned by Semrush. Our mission is to provide accurate data and expert insights on emerging trends. Unless otherwise noted, this page’s content was written by either an employee or a paid contractor of Semrush Inc.
Share
Newsletter Signup
By clicking “Subscribe” you agree to Semrush Privacy Policy and consent to Semrush using your contact data for newsletter purposes
Written By


James is a Journalist at Exploding Topics. After graduating from the University of Oxford with a degree in Law, he completed a... Read more