Exploding Topics
Trending Startups
Top Websites
Get Advanced Insights on Any Topic
Discover Trends 12+ Months Before Everyone Else
How We Find Trends Before They Take Off
Exploding Topics’ advanced algorithm monitors millions of unstructured data points to spot trends early on.

Features
Keyword Research
Performance Tracking
Competitor Intelligence
Find Your Site’s SEO Issues in 30 Seconds
Find technical issues blocking search visibility. Get prioritized, actionable fixes in seconds.
Powered by data from
Countries with the Highest Number of Internet Users (2025)
The number of internet users around the world continues to grow each year.
In general, nations with larger populations are likely to have more internet users, but there are countries that buck the trend.
Below, we’ll dive deeper into the figures and reveal which countries currently have the most internet users.
Contents
- Top International Internet Stats
- Which Country Has the Most Internet Users?
- Internet Adoption Statistics by Nation
- Internet Adoption Statistics by Region
- Global Internet Users Over Time
- Unconnected Populations
- International Internet Use by Device
Top International Internet Stats
- China has over 1 billion internet users
- More than 95% of Americans use the internet
- Almost 70% of the global population is online
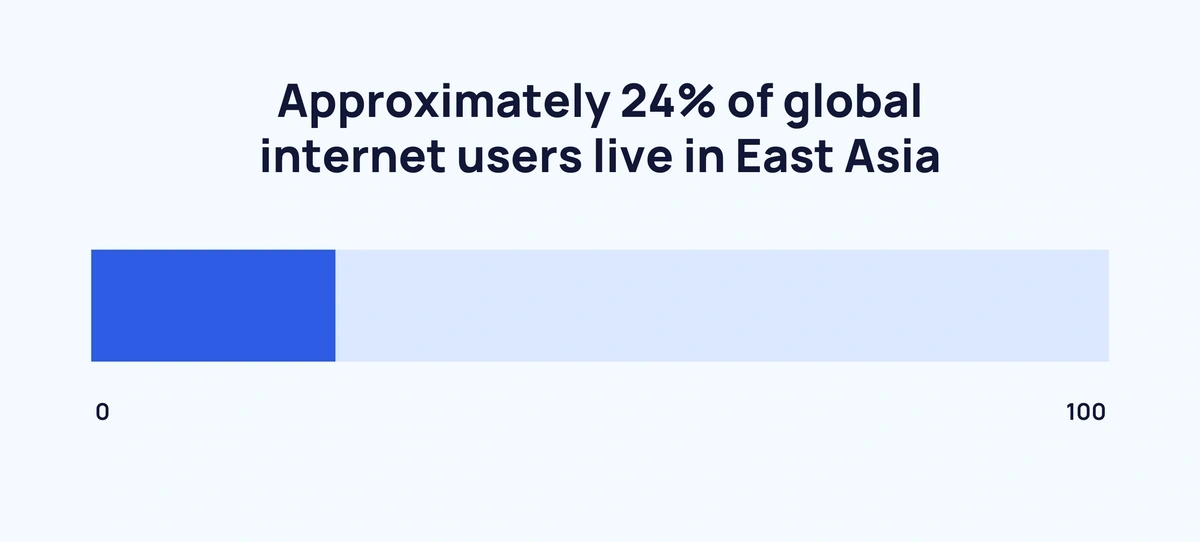
- 23.3% of internet users live in East Asia
- Northern Europe has the highest internet penetration rate (97.7%)
- South Africans average a global high of 9 hours 37 minutes per day on the internet
Which Country Has the Most Internet Users?
Perhaps unsurprisingly, given its enormous population, China leads the way for global internet users with an estimated 1.11 billion. Nearly 3 in 4 people (78.17%) in China use the internet.
India currently ranks second with just under half of its population (55.1%) using the internet, which accounts for 806 million people.
The US rounds off the top three with 322 million of its 340.1 million population using the internet (95.68%).
Here are the top 25 nations ranked by total number of internet users:
|
Rank |
Nation |
Region |
Internet Users |
Population |
Internet Penetration Rate |
|
1 |
China |
Asia |
1.11 billion |
1.416 billion |
78.17% |
|
2 |
India |
Asia |
806 million |
1.464 billion |
55.1% |
|
3 |
US |
North America |
332 million |
347 million |
95.68% |
|
4 |
Indonesia |
Asia |
212 million |
286 million |
74.13% |
|
5 |
Brazil |
South America |
183 million |
213 million |
85.92% |
|
6 |
Russia |
Europe/Asia |
133 million |
144 million |
92.36% |
|
7 |
Pakistan |
Asia |
116 million |
255 million |
45.49% |
|
8 |
Mexico |
North America |
110 million |
132 million |
83.33% |
|
9 |
Japan |
Asia |
109 million |
123 million |
88.62% |
|
10 |
Nigeria |
Africa |
107 million |
238 million |
44.96% |
|
11 |
Philippines |
Asia |
97.5 million |
117 million |
83.33% |
|
12 |
Egypt |
Africa |
96.3 million |
118 million |
81.61% |
|
13 |
Vietnam |
Asia |
79.8 million |
102 million |
78.24% |
|
14 |
Germany |
Europe |
78.9 million |
84 million |
93.9% |
|
15 |
Bangladesh |
Asia |
77.7 million |
176 million |
44.15% |
|
16 |
Turkey |
Europe/Asia |
77.3 million |
87.7 million |
88.14% |
|
17 |
Iran |
Asia |
73.2 million |
92.4 million |
79.22% |
|
18 |
UK |
Europe |
67.8 million |
65.6 million |
97.41% |
|
19 |
Thailand |
Asia |
65.4 million |
71.6 million |
91.34% |
|
20 |
France |
Europe |
63.4 million |
66.7 million |
95.05% |
|
21 |
Italy |
Europe |
53.3 million |
59 million |
90.33% |
|
22 |
South Africa |
Africa |
50.8 million |
64.8 million |
78.4% |
|
23 |
South Korea |
Asia |
50.4 million |
51.7 million |
97.49% |
|
24 |
Spain |
Europe |
46.2 million |
47.9 million |
96.45% |
|
25 |
Argentina |
South America |
41.2 million |
45.9 million |
89.76% |
Sources: Data Reportal, Worldometer
Internet Adoption Statistics By Nation
In total, six countries have an internet adoption rate of 99%:
- Denmark
- Netherlands
- Norway
- Saudi Arabia
- Switzerland
- UAE
Here are the top 20 nations by internet adoption rate:
|
Rank |
Nation |
Region |
Internet Adoption |
|
=1 |
Denmark |
Europe |
99% |
|
=1 |
Netherlands |
Europe |
99% |
|
=1 |
Norway |
Europe |
99% |
|
=1 |
Saudi Arabia |
Asia |
99% |
|
=1 |
Switzerland |
Europe |
99% |
|
=1 |
UAE |
Asia |
99% |
|
7 |
Ireland |
Europe |
98.9% |
|
8 |
Sweden |
Europe |
98.3% |
|
9 |
Finland |
Europe |
98.2% |
|
10 |
UK |
Europe |
97.8% |
|
11 |
Malaysia |
Asia |
97.7% |
|
12 |
South Korea |
Asia |
97.4% |
|
13 |
Australia |
Oceania |
97.1% |
|
=14 |
Belgium |
Europe |
96.4% |
|
=14 |
Spain |
Europe |
96.4% |
|
16 |
New Zealand |
Oceania |
96.2% |
|
17 |
Hong Kong |
Asia |
96% |
|
18 |
Singapore |
Asia |
95.8% |
|
19 |
Austria |
Europe |
95.3% |
|
=20 |
Taiwan |
Asia |
95.2% |
|
=20 |
Canada |
North America |
95.2% |
|
- |
World |
- |
67.9% |
Source: Data Reportal
Internet Adoption Statistics By Region
Around 1 in 4 (23.3%) internet users live in East Asia. This heavily populated region has an internet penetration rate of 78.5% – almost 10% higher than the global penetration rate (67.9%).
Northern Europe has the world’s highest internet penetration rate (97.7%).
While East Africa has the lowest internet penetration rate (23.5%).
Here are the global internet users and adoption rates by region in full:
|
Region |
Share of Global Internet Users |
Internet Penetration Rate |
|
East Asia |
23.3% |
78.5% |
|
South Asia |
20.1% |
53.8% |
|
South-East Asia |
9.8% |
78.2% |
|
South America |
6.5% |
83.2% |
|
North America |
6.5% |
93.3% |
|
Eastern Europe |
4.6% |
90.6% |
|
West Asia |
4.3% |
75.9% |
|
North Africa |
3.6% |
73% |
|
West Africa |
3.5% |
42.5% |
|
Western Europe |
3.4% |
95.1% |
|
Central America |
2.6% |
79.2% |
|
East Africa |
2.6% |
28.5% |
|
Southern Europe |
2.5% |
91.6% |
|
Northern Europe |
1.9% |
97.7% |
|
Central Africa |
1.3% |
33.6% |
|
Central Asia |
1.2% |
80.8% |
|
South Africa |
1% |
77% |
|
Oceania |
0.6% |
77.5% |
|
Caribbean |
0.6% |
69.8% |
|
World |
100% |
67.9% |
Sources: Data Reportal, Statista
Global Internet Users Over Time
The exact number of global internet users is hard to pinpoint. However, various reliable sources place the figure somewhere between 5.05 billion and 5.56 billion. That means 63% to 69% of the global population is online.
Here’s the number of internet users according to a few different reputable sources:
|
Source |
Internet Users |
Percentage of Population |
|
Data Reportal |
5.56 billion |
69% |
|
ITU |
5.5 billion |
68% |
|
World Bank |
5.5 billion |
68% |
|
CIA World Factbook |
5.05 billion |
63% |
|
Average |
5.4 billion |
67% |
According to Data Reportal figures, the number of internet users has increased by over 2x since 2013.
Here’s how the global internet user base has grown over time:
|
Year |
Internet Users |
Increase Over Previous Year |
|
2013 |
2.534 billion |
- |
|
2014 |
2.8 billion |
+10.5% |
|
2015 |
3.004 billion |
+7.3% |
|
2016 |
3.423 billion |
+13.9% |
|
2017 |
3.679 billion |
+7.5% |
|
2018 |
3.977 billion |
+8.1% |
|
2019 |
4.335 billion |
+9% |
|
2020 |
4.627 billion |
+6.7% |
|
2021 |
4.962 billion |
+7.2% |
|
2022 |
5.060 billion |
+2% |
|
2023 |
5.158 billion |
+1.9% |
|
2024 |
5.35 billion |
+3.7% |
|
2025 |
5.56 billion |
+3.9% |
Source: Data Reportal
Unconnected Populations
The latest data reveals that there are approximately 2.57 billion people who do not use the internet.
While South Asia may have hundreds of millions of internet users, there are also many millions who do not use the internet. It is estimated that South Asia has an unconnected population of 958.8 million – more than double the next largest unconnected regional population (East Asia’s 356.3 million).
|
Rank |
Region |
People Who Do Not Use the Internet |
|
1 |
South Asia |
958.8 million |
|
2 |
East Asia |
356.3 million |
|
3 |
East Africa |
362.6 million |
|
4 |
West Africa |
265.1 million |
|
5 |
South-East Asia |
151.8 million |
|
6 |
Central Africa |
143.5 million |
|
7 |
North Africa |
74.1 million |
|
8 |
South America |
73.5 million |
|
9 |
West Asia |
75.1 million |
|
10 |
Central America |
38.4 million |
|
11 |
Eastern Europe |
26.9 million |
|
12 |
North America |
25.8 million |
|
13 |
South Africa |
16.9 million |
|
14 |
Central Asia |
15.9 million |
|
15 |
Caribbean |
13.4 million |
|
16 |
Southern Europe |
12.6 million |
|
17 |
Oceania |
10.4 million |
|
18 |
Western Europe |
9.8 million |
|
19 |
Northern Europe |
2.5 million |
|
- |
Global |
2.57 billion |
In terms of nations, the largest unconnected population resides in India. In total, over 650 million Indians do not use the internet – that accounts for 44.7% of the population.
|
Rank |
Nation |
Region |
Unconnected Population |
% of Offline Population |
|
1 |
India |
Asia |
651,619,000 |
44.7% |
|
2 |
China |
Asia |
311,901,000 |
22% |
|
3 |
Pakistan |
Asia |
137,453,000 |
54.3% |
|
4 |
Nigeria |
Africa |
128,323,000 |
54.6% |
|
5 |
Ethiopia |
Africa |
105,209,000 |
78.7% |
|
6 |
Bangladesh |
Asia |
96,908,000 |
55.5% |
|
7 |
DR Congo |
Africa |
77,059,000 |
69.4% |
|
8 |
Indonesia |
Asia |
72,172,000 |
25.4% |
|
9 |
Tanzania |
Africa |
49,305,000 |
70.9% |
|
10 |
Uganda |
Africa |
36,514,000 |
72% |
Unsurprisingly, highly populated nations dominate the top 10 unconnected countries.
However, the list looks very different when focusing on the percentage of unconnected people.
Over 90% of North Korea, South Sudan, and Somalia are offline.
|
Rank |
Nation |
Region |
% of Offline Population |
Unconnected Population |
|
1 |
North Korea |
Asia |
>99.9% |
No data |
|
2 |
Burundi |
Africa |
87.5% |
12,441,000 |
|
3 |
Chad |
Africa |
86.8% |
17,992,000 |
|
4 |
CAR |
Africa |
84.5% |
4,582,000 |
|
5 |
South Sudan |
Africa |
84.3% |
10,167,000 |
|
6 |
Yemen |
Asia |
82.3% |
33,893,000 |
|
7 |
Malawi |
Africa |
82% |
17,982,000 |
|
8 |
Mozambique |
Africa |
80.2% |
28,177,000 |
|
9 |
Eritrea |
Africa |
80% |
2,856,000 |
|
10 |
Madagascar |
Africa |
79.6% |
25,752,000 |
Source: Data Reportal
International Internet Use by Device
With an average time of 9 hours and 37 minutes of daily internet use, South Africans spend the most time online per day.
Not far behind, Brazil also averages over 9 hours of internet use per day.
Below are the top nations by average daily time spent using the internet:
|
Country |
Average Daily Time Spent Using the Internet |
|
South Africa |
9 hours 37 minutes |
|
Brazil |
9 hours 9 minutes |
|
Philippines |
8 hours 52 minutes |
|
Chile |
8 hours 45 minutes |
|
Colombia |
8 hours 44 minutes |
|
Argentina |
8 hours 44 minutes |
|
Russia |
8 hours 38 minutes |
|
Malaysia |
8 hours 13 minutes |
|
UAE |
7 hours 59 minutes |
|
Thailand |
7 hours 54 minutes |
|
Worldwide |
6 hours 38 minutes |
Mobile
According to the latest data, over 63% of internet access comes from mobile devices.
On average, Ghanaians spend 5 hours and 43 minutes using mobiles to access the internet each day – that’s almost 2 hours more than the global average.
|
Country |
Average Daily Time Spent Using the Internet on Mobile |
|
Ghana |
5 hours, 43 minutes |
|
Philippines |
5 hours, 21 minutes |
|
Brazil |
5 hours, 12 minutes |
|
South Africa |
5 hours, 11 minutes |
|
Thailand |
5 hours |
|
Chile |
4 hours, 58 minutes |
|
Kenya |
4 hours, 57 minutes |
|
Colombia |
4 hours, 47 minutes |
|
Malaysia |
4 hours, 42 minutes |
|
Argentina |
4 hours, 40 minutes |
|
Worldwide |
3 hours, 46 minutes |
According to recent data, all (98.7%) adults aged 18 to 64 access the internet via a smartphone in Indonesia.
The global average for accessing the internet via a smartphone sits at 96.3%.
|
Country |
% of Population Who Access the Internet via a Smartphone |
|
Indonesia |
98.7% |
|
Philippines |
98.5% |
|
South Africa |
98.5% |
|
Brazil |
98.4% |
|
Malaysia |
98.4% |
|
Thailand |
98% |
|
Vietnam |
97.7% |
|
Saudi Arabia |
97.6% |
|
Chile |
97.3% |
|
Argentina |
97.2% |
|
Worldwide |
96.3% |
Computer
No country averages more time spent accessing the internet via a computer than Russia (4 hours and 31 minutes). That figure equates to 1 hour and 39 minutes more than the global average of 2 hours and 52 minutes.
|
Country |
Average Daily Time Spent Using the Internet on a Computer |
|
Russia |
4 hours, 31 minutes |
|
South Africa |
4 hours, 26 minutes |
|
Argentina |
4 hours, 4 minutes |
|
Brazil |
3 hours, 57 minutes |
|
Colombia |
3 hours, 57 minutes |
|
Portugal |
3 hours, 55 minutes |
|
Bulgaria |
3 hours, 54 minutes |
|
Chile |
3 hours, 47 minutes |
|
UAE |
3 hours, 32 minutes |
|
Malaysia |
3 hours, 31 minutes |
|
Israel |
3 hours, 31 minutes |
|
Worldwide |
2 hours, 52 minutes |
The vast majority (84%) of people living in Czechia access the internet via a computer.
In total, 7 of the top 10 nations for populations who access the internet via computer are situated in Europe.
|
Country |
% of Population Who Access the Internet via a Computer |
|
Czechia |
84% |
|
Portugal |
81.5% |
|
Russia |
81% |
|
Canada |
80.8% |
|
Austria |
80.4% |
|
Poland |
80.4% |
|
Serbia |
80.3% |
|
Switzerland |
80.1% |
|
Croatia |
79.8% |
|
South Africa |
79.1% |
|
Worldwide |
61.5% |
Source: Data Reportal
Key Takeaways
Given that the gap between China’s number of internet users and second-placed India’s internet users is larger than any other country’s total population, a change in the top spot is unlikely to occur any time soon.
With that, Asia as a continent will continue to lead the way in terms of internet users as the global figure continues to grow.
For more internet-related statistics, take a look at these other blog posts: Alarming Average Screen Time Statistics and Amount of Data Created Daily.
Stop Guessing, Start Growing 🚀
Use real-time topic data to create content that resonates and brings results.
Exploding Topics is owned by Semrush. Our mission is to provide accurate data and expert insights on emerging trends. Unless otherwise noted, this page’s content was written by either an employee or a paid contractor of Semrush Inc.
Share
Newsletter Signup
By clicking “Subscribe” you agree to Semrush Privacy Policy and consent to Semrush using your contact data for newsletter purposes
Written By


Fabio is a research associate at Exploding Topics. Since 2021, Fabio has researched, written, and edited articles for the Explo... Read more


