Get Advanced Insights on Any Topic
Discover Trends 12+ Months Before Everyone Else
How We Find Trends Before They Take Off
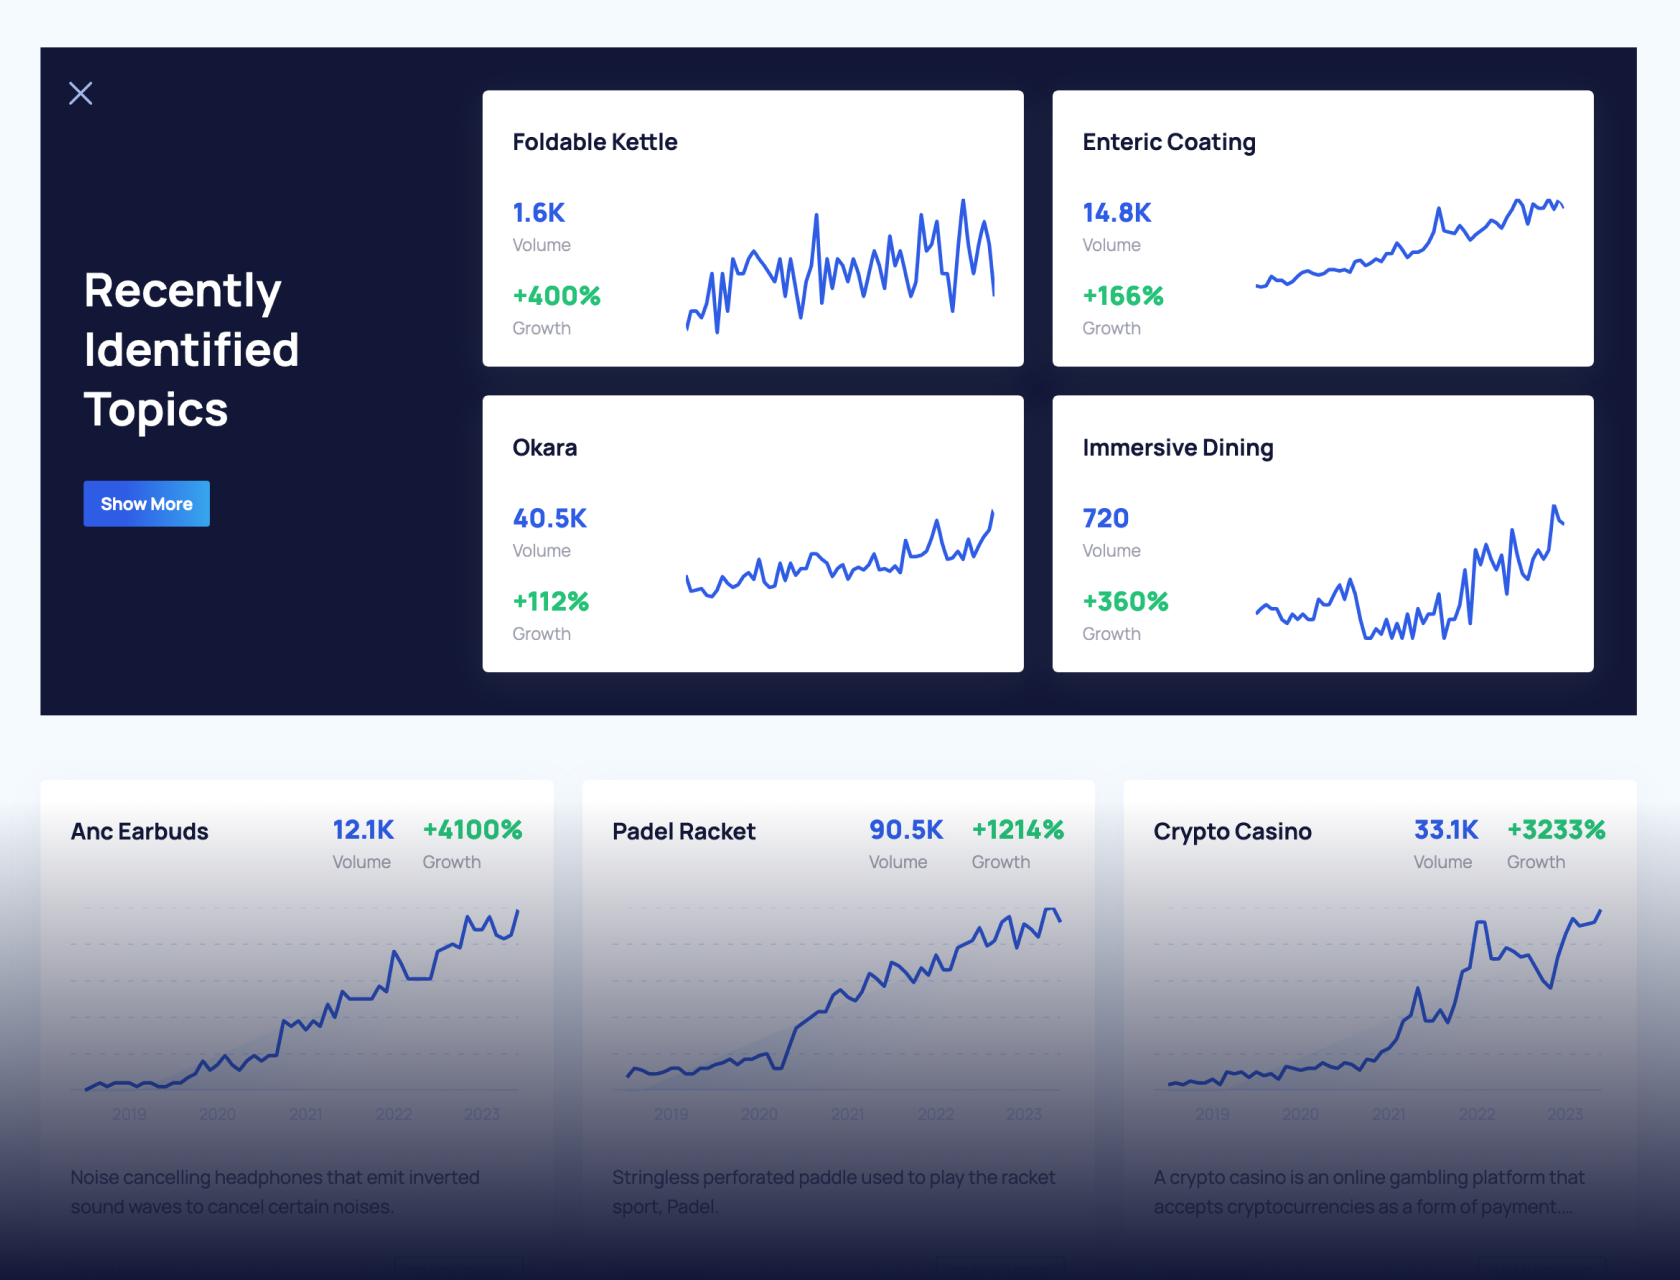
Exploding Topics’ advanced algorithm monitors millions of unstructured data points to spot trends early on.
Features
Keyword Research
Performance Tracking
Competitor Intelligence
Fix Your Site’s SEO Issues in 30 Seconds
Find technical issues blocking search visibility. Get prioritized, actionable fixes in seconds.
Powered by data from
130 SEO Statistics Every Marketer Must Know in 2025
SEO statistics can provide foresight, but they can also reveal prediction errors.
Case in point: the biggest SEO statistics story of 2025 was that generative AI would devour much of Google Search traffic by now. That has not happened.
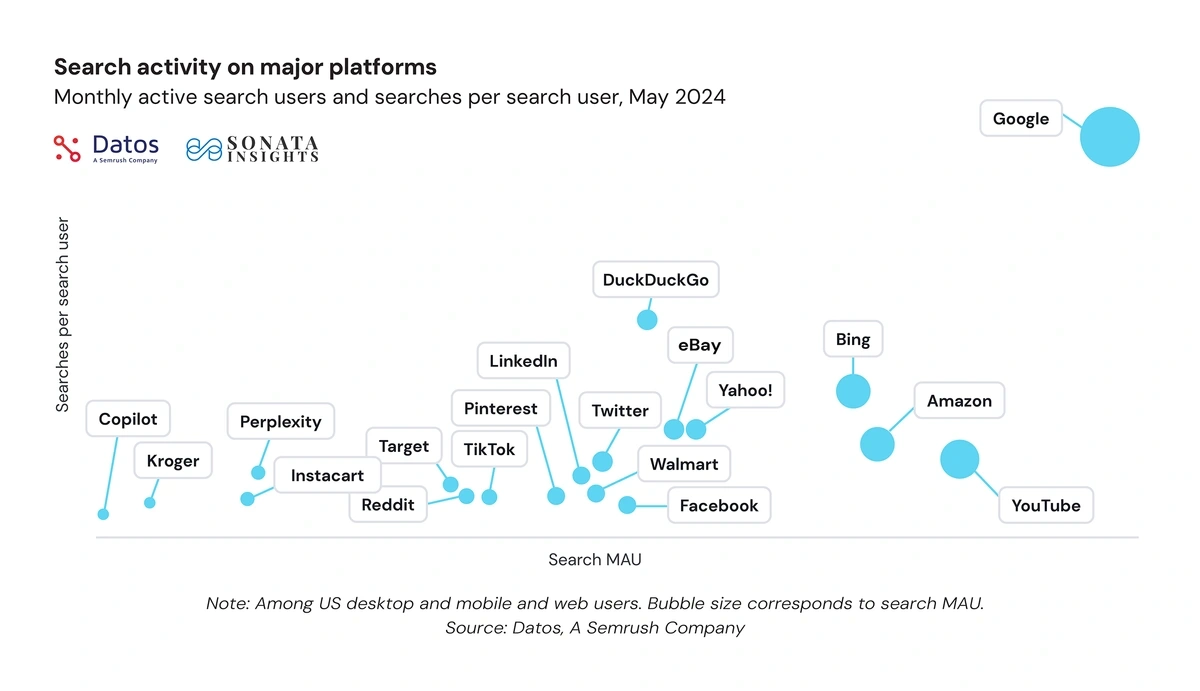
Instead, Google continues to dominate. Monthly queries per user on GenAI platforms are a tiny fraction of those performed on Google Search.
And 99% of GenAI users still use search engines.
Below, you’ll find surprising statistics and some that reveal not much has changed.
Build a winning strategy
Get a complete view of your competitors to anticipate trends and lead your market
SEO Industry and Software Statistics
- The global market for SEO, estimated at $82.3 billion in 2023, will reach $143.9 Billion by 2030, growing at a CAGR of 8.3% for those 7 years. (Research and Markets)
- Mobile, a subset of the SEO market, is expected to grow at a 10.0% CAGR by 2030.
- Search advertising spending is expected to reach $483.5 billion by 2029. This represents a CAGR (2024-2029) of 8.86%. (Statista)
- Google will garner over 70% of US traditional search ad spending in 2026, which is 10 times the size of Microsoft’s share. (Emarketer)
- Semrush Holdings (NYSE:SEMR), provider of the SEO SaaS platform Semrush, has a market cap of 1.74 billion. For the quarter ending on Sept. 30, 2024, revenue was up 23.5%, and revenue for the preceding 12 months was over $357 million.
- Competitor Ahrefs crossed the $100 million ARR threshold in 2023.
- Backlinks databases: Semrush currently has 43 trillion links in its backlink database, vs. Ahrefs’ 35 trillion.
- Keywords databases: Semrush has 25+ billion keywords in its database, compared to Ahrefs’ 28+ billion.
Takeaway: Leverage projected SEO growth trends to future-proof your marketing strategy. Try Semrush today and get ahead of your competitors with the most trusted SEO tools in the market.
Generative AI vs. Google Search
- 99% of those using generative AI platforms continued to use search engines (Datos)
- In 2024, Google received 373x as many searches as ChatGPT. (SparkToro)
- Around 16.4% of search users also use GenAI. The data, however, doesn’t indicate they use AI “instead of traditional search.” (Datos)
- In January 2025, AI Overviews appeared in 30% of search results and 74% of problem-solving queries. (Search Engine Journal)
- In a recent study, Google Search had 290 times more users than Perplexity. (SparkToro / Datos)
- The percentage of search engine users that also use generative AI platforms is in the low double digits. (Datos)
- ChatGPT continues to see the most growth of all GenAI platforms, followed by Gemini, Copilot, Claude, and Perplexity. (Datos)
- From May 2023 through May 2024, ChatGPT saw a combined desktop and mobile web MAU growth of 25%. (Datos)
- In 2023, generative AI attracted equity investments of $36 billion, up from $5 billion in 2022. (McKinsey Global Institute)
- Google vs. AI: Google Search users sparked an average of 200 events per month, followed by Perplexity users who averaged 15 events per month. ChatGPT users averaged 12.2 events. (Datos)
Takeaway: Many media outlets made false predictions of GenAI’s cannibalization of Google by 2025. Focus on the data and what impacts your prospects today.
Google Search Statistics
- 92% of global traffic comes from Google. (Semrush)
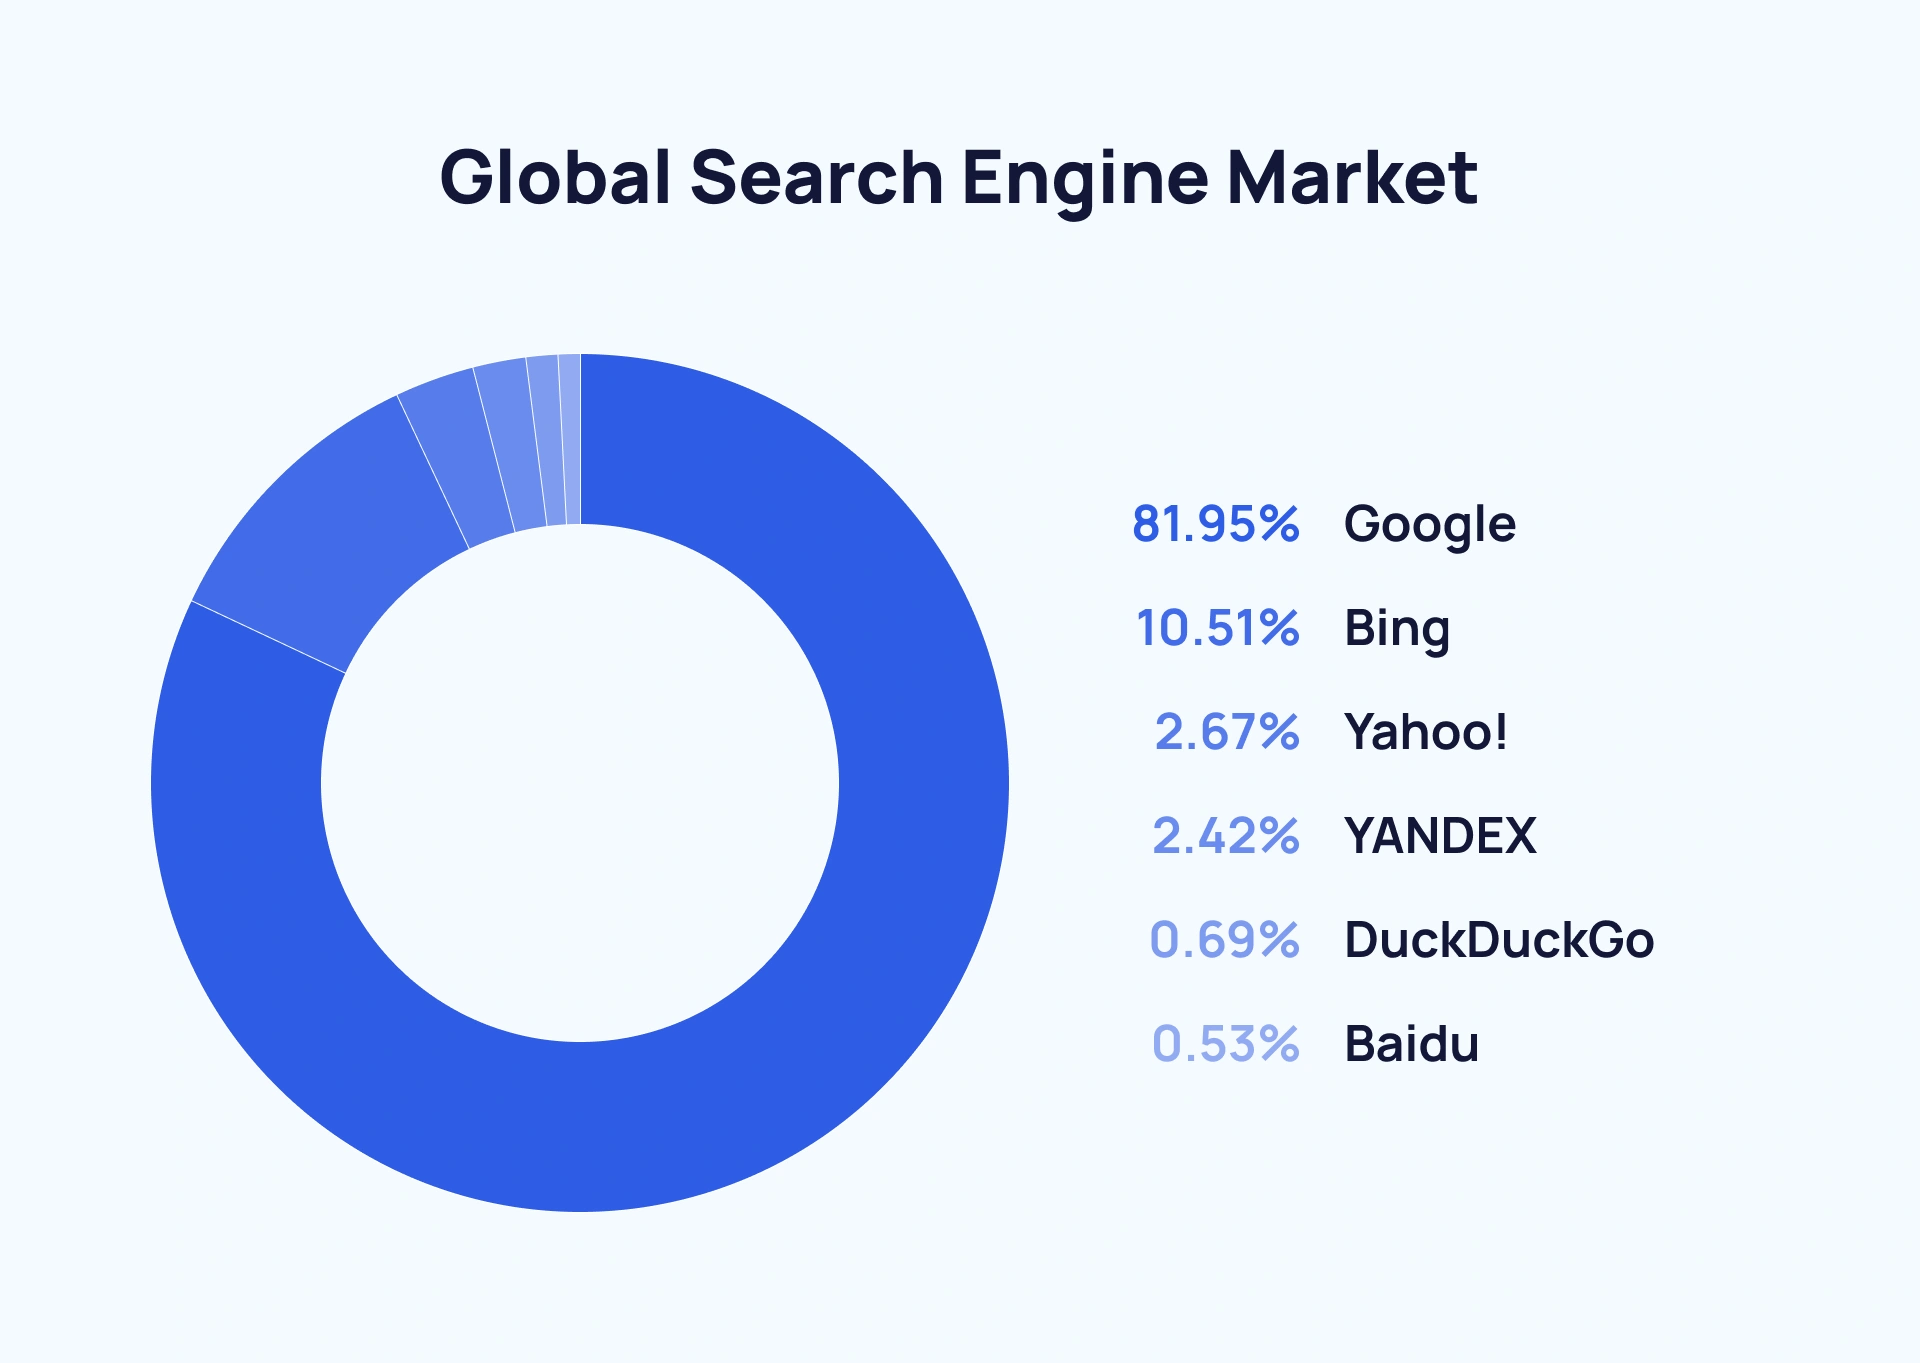
- With a market share of 81.95%, Google continues to dominate the global search engine market. By contrast, Bing has 10.51%, Yahoo has 2.67%, Yandex accounts for 2.42%, DuckDuckGo has 0.60%, and Baidu represents 0.53%. (Statista)
- Yet even Baidu receives 781 million monthly visits as of May 2025, making it the #45 ranked website globally. (Exploding Topics)
- Google processes over 8.3 billion searches a day, 96k+ per second, and 5.7+ million per minute. (Exploding Topics)
- 20 billion search queries a month are performed using Google Lens. (Think With Google)
- AI Overviews reach over 1 billion users each month. (Think With Google)
Get More Search Traffic
Use trending keywords to create content your audience craves.
- 400 billion: The size of Google’s index of web documents, as reported by Zyppy SEO, citing the USA vs. Google antitrust trial.
- Every day, 15% of Google searches use keywords never used before. (Think With Google)
- 54% of all clicks go to the first 3 Google search results. (Up Inc.)
- Just 0.44% of Google users visit the second page in search results. (Backlinko)
- 32.3%: the click-through rate boost that can be achieved by ranking one spot higher on page 1 of Google SERP. (Backlinko)
- Almost two-thirds (63.41%) of all U.S. internet traffic is referral traffic from Google.com. (SparkToro / Datos)
- Organic search accounts for 53% of website traffic. (Embryo Agency)
- 75% of Google users ignore the 2nd page of results. (Hubspot)
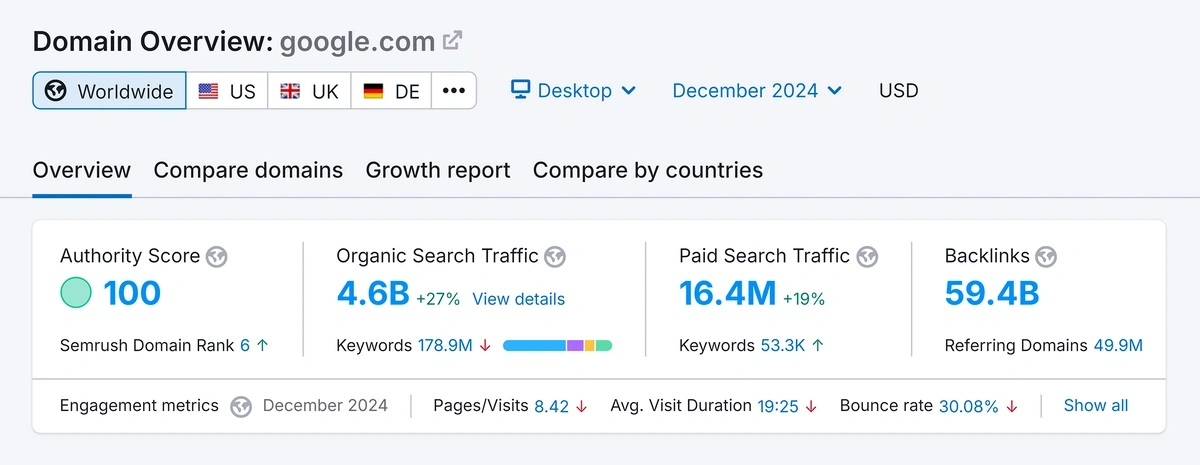
- On the last day of 2024, Google garnered organic search traffic of 4.6 billion and paid search traffic of 16.4 million.
Takeaway: Reports of Google Search’s imminent decline are popular but unsupported by data. Prepare to optimize for Google’s AI Overviews this year.
SEO ROI Statistics
- For every dollar spent on SEO, businesses earn an average of over $22, per stats from SmartInsights.
- Average SEO ROI per industry varies and depends on other factors like lifetime customer value.
According to original research by FirstPageSage (FPS), the top-ranking industries per ROI on SEO are as follows:
| Sector | SEO ROI | Months to breakeven |
| Real estate | 1,389% | 13 months |
| Medical devices | 1,183% | 10 months |
| Financial services | 1,031% | 9 months |
| Higher education | 994% | 13 months |
| Oil & gas | 906% | 10 months |
Other leading sectors include:
- B2B SaaS with an SEO ROI of 702% and breakeven average of 7 months.
- E-commerce with an SEO ROI of 317% and a breakeven of 16 months.
- HVAC services with an ROI of 678% and a breakeven of 6 months.
SEO ROI timeframe: According to B2B SEO statistics, it takes anywhere from 6 months to a year to achieve positive ROI for an SEO campaign. Peak results are seen in the 2nd or 3rd year of the campaign, per FPS.
Keyword Research Statistics
- In 2024, almost 60% of EU Google searches and over 58% of American ones resulted in zero clicks. (SparkToro / Datos)
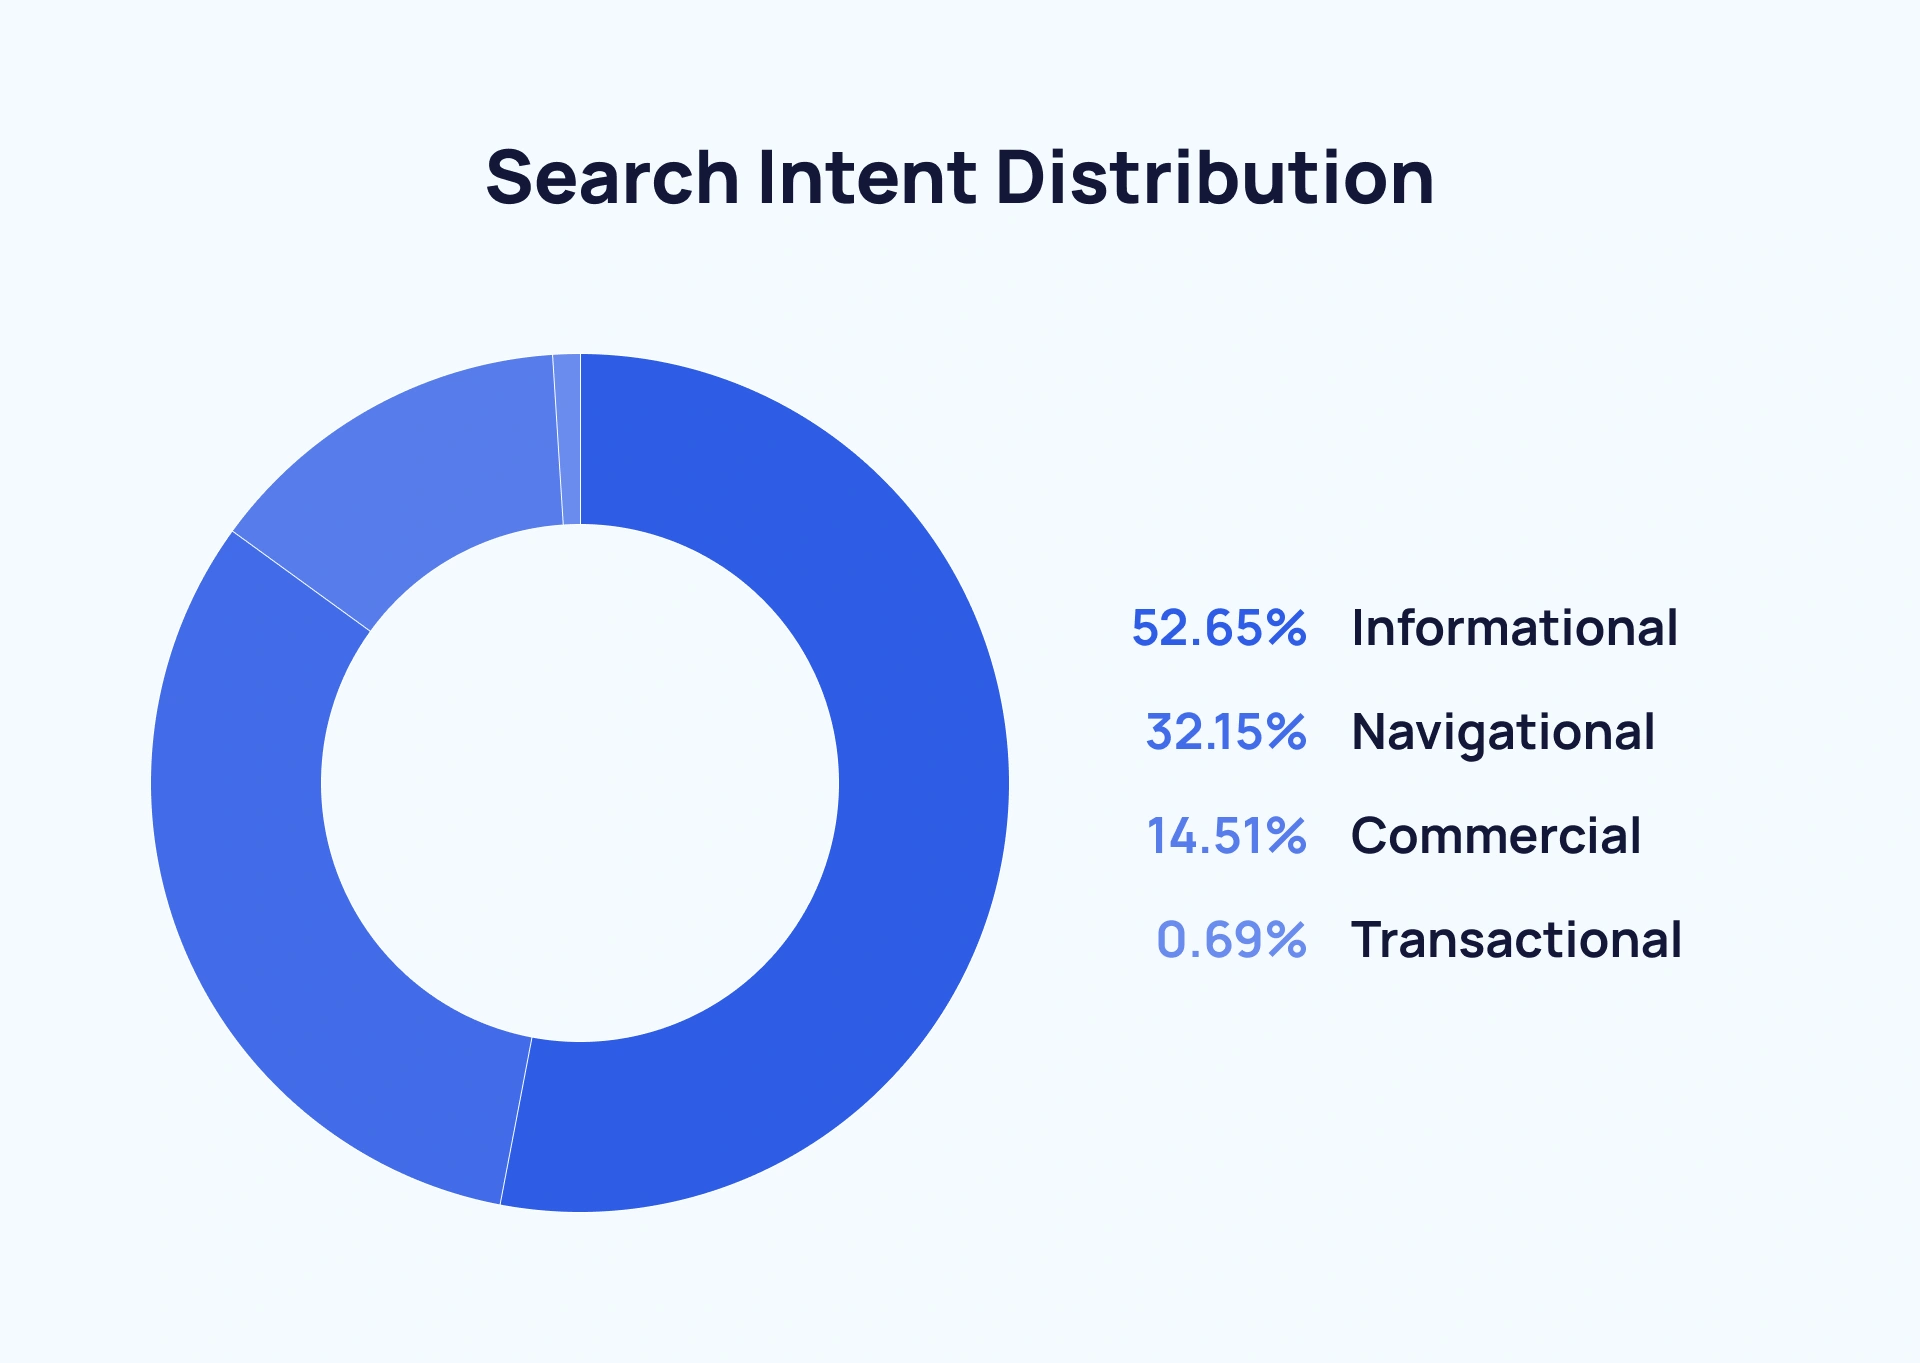
- Search intent: 52.65% of Google searches are informational, 32.15% are navigational, 14.51% are commercial, and 0.69% are transactional. (SparkToro / Datos)
- Long-tail keywords make up 70% of all search traffic. (Embryo Agency)
- On average, 69% of clicks go to the first 5 organic search results for any keyword. (Up Inc.)
- Branded terms make up over 44% of Google searches. (SparkToro/Datos)
- In the U.S., more than 80% of queries are between 1-3 words. (Statista)
Takeaway: Targeting high-value, low-competition keywords is still key. (I call this “blue ocean SEO.”)
Content Marketing Statistics
- Organic search is still the #1 traffic source for websites. (HubSpot)
- Last year, content marketing grew in priority for organizations, according to 71% of marketers surveyed. (Content Marketing Institute)
- According to 72% of marketers, the most effective SEO tactic is publishing high-quality content. (WebFX)
- By 2027, the global content marketing industry is projected to grow by over $584 billion. (ReportLinker)
- Businesses that spend $4,000 or more per article are likelier to report content marketing success vs. those who spend $500 or less. (Siege Media)
- 62% of businesses outsource their content marketing. (DemandMetric)
- Pages that occupy the top 10 of Google search results have a 50% lower keyword density than those ranking 2 years ago. (BrightEdge)
Takeaway: Google rewards excellence and originality. SEO marketing statistics suggest a continued focus on information gain over keyword stuffing.
Backlink and Link Building Statistics
- Backlinks remain an important ranking factor, but they’re no longer among the top 3, per Google Search analyst Greg Illyes. (Search Engine Journal)
- Websites with “active blogs” get 97% more inbound links. (BKA Content)
- Pages that rank #1 in Google have, on average, 3.8 times the number of backlinks than pages in slots 2 through 10. Additionally, the #1 ranking result has 3.2 more referring domains. (Backlinko)
- Almost 80% of SEO professionals view link building as a crucial part of their strategy. (Authority Hacker)
- 78% of SEO professionals get “satisfying ROI” from link-building campaigns. (Authority Hacker)
- 43 trillion: the number of backlinks that Semrush has in its database. (Semrush data)
Perspective: Link building is awash with mediocre guest posting initiatives that annoy prospects. Winning requires building a carefully differentiated strategy formed around high-quality blog posts.
Local SEO Statistics
- 46% of all Google searches are local search queries. (Embryo Agency)
- Within 24 hours of doing a local business search, 88% of consumers call or visit a listed store. (Embryo Agency)
Note: This is why keeping an up-to-date listing is so important. Check out Semrush Local and the Semrush Listing Management tool. - Daily, in the U.S., 21% of consumers use the internet to find local businesses. Thirty-two percent said they did local searches a few times a week. Only 2% said they didn’t search for local businesses online. (Statista)
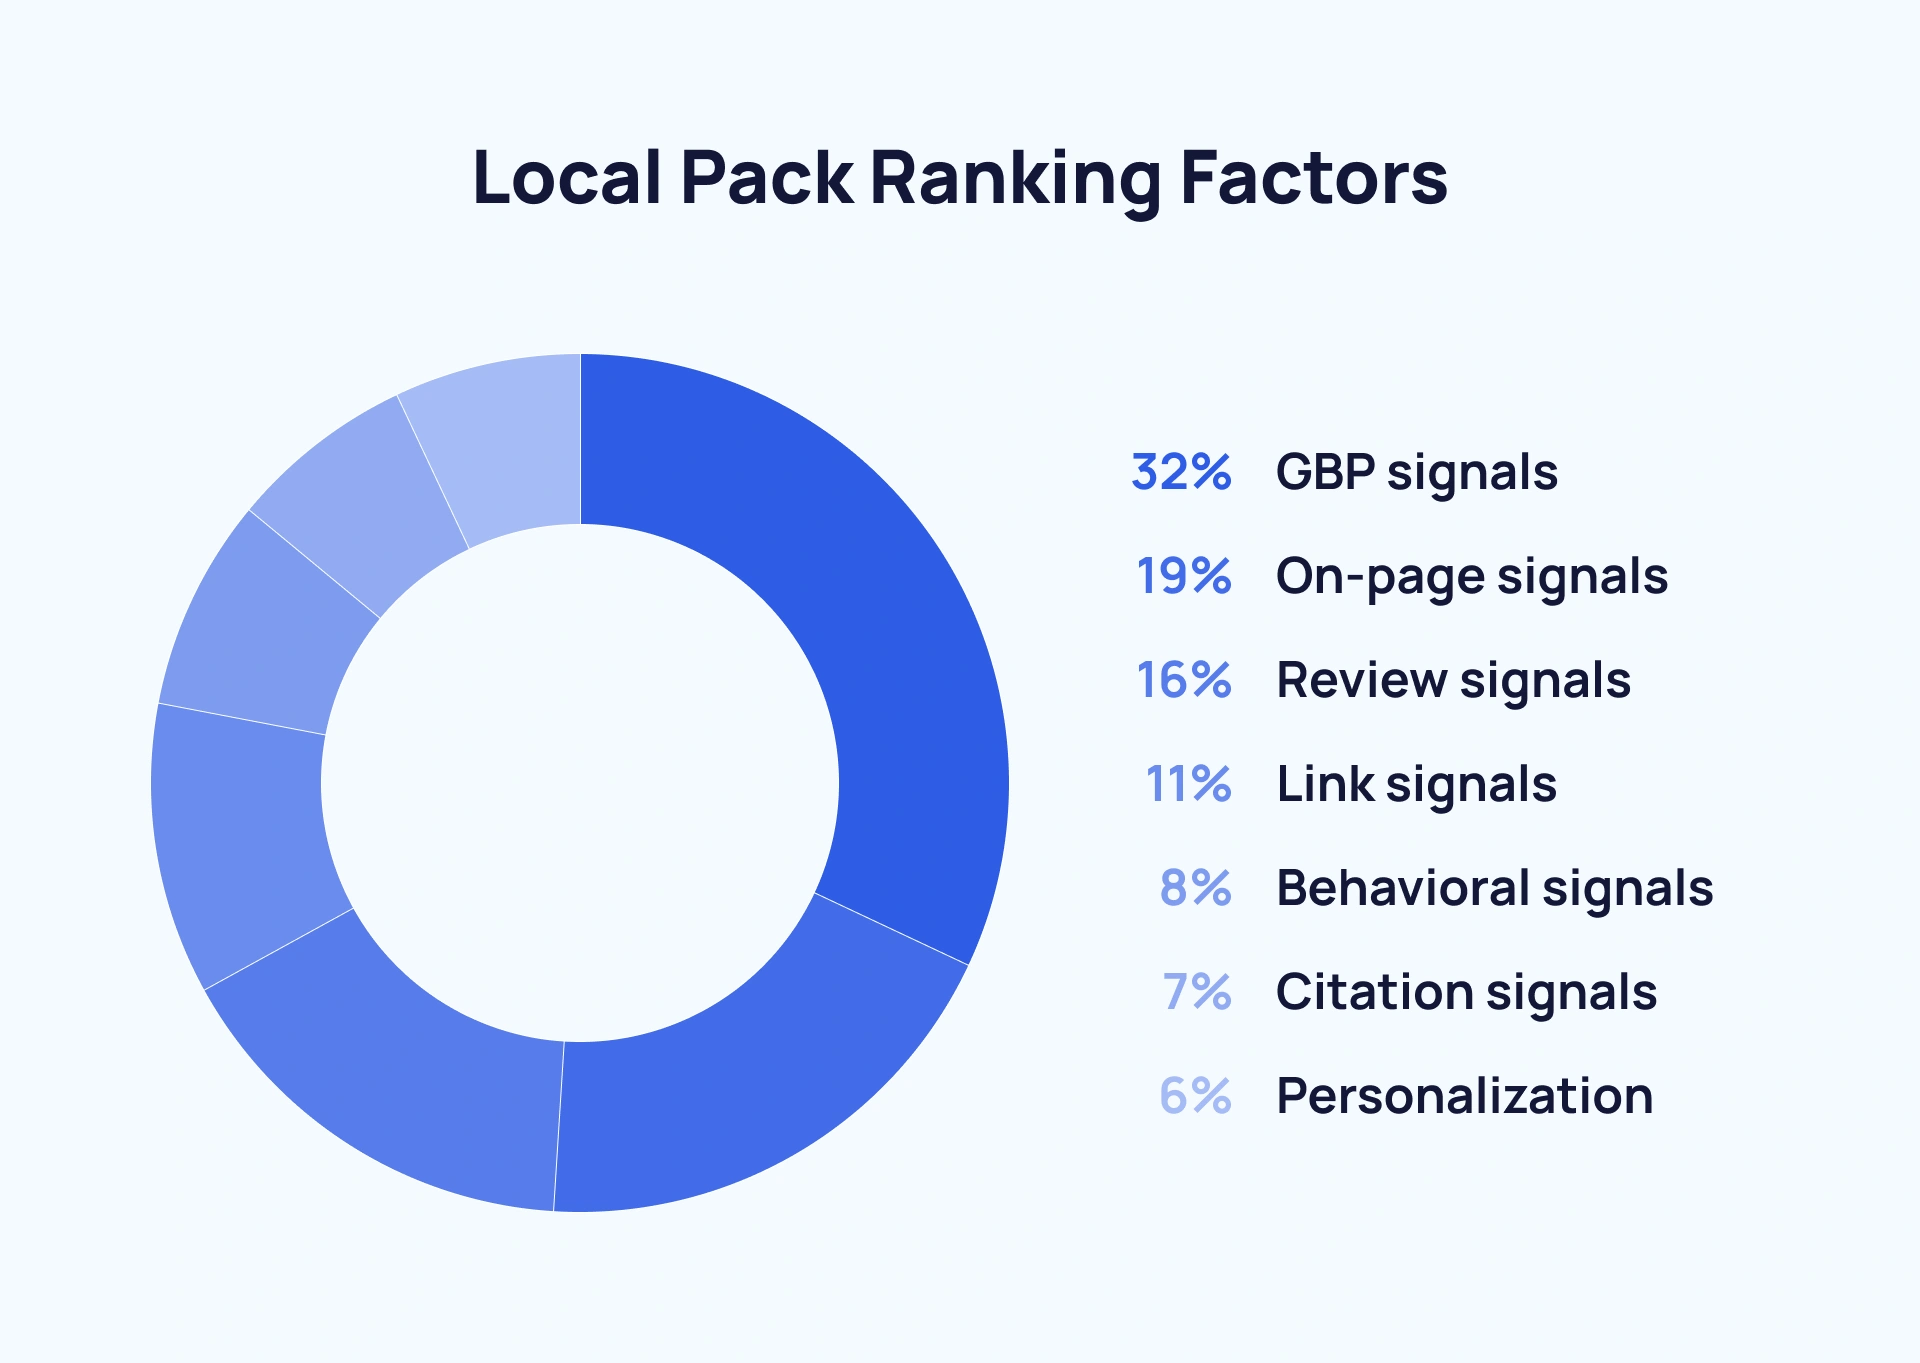
A Whitespark survey of marketers asked how much weight Google attributes to various factors that impact Local Pack rankings.
| Signal | Weighting |
| GBP signals | 32% |
| On-page signals | 19% |
| Review signals | 16% |
| Link signals | 11% |
| Behavioral signals | 8% |
| Citation signals | 7% |
| Personalization | 6% |
- Whitespark also found that 3 out of 4 top conversion factors are review-related. And a steady increase in reviews was more important than bursts of activity.
Perspective: In my experience, small business owners often underestimate the impact of an optimized Google Business Profile and regular reviews. Read our complete guide to SEO for small businesses.
Mobile SEO Statistics
- Google accounts for 95% of the mobile search engine market (GS Statcounter)
- 96% of internet users, or 4.97 billion people, access the web via mobile devices. (Status Labs)
- Globally, on a monthly basis, mobile users account for 59% of all internet traffic. In North America, they account for 45%. (Statista)
- Mobile internet traffic as a percentage of total traffic is highest in Africa (74%), Asia (69%), and South America (56%). (Statista)
- 80% of top-ranking sites are mobile-optimized. (Status Labs)
- YouTube has a mobile audience reach of 74%, followed by Gmail (65%) and Facebook (64%). (Statista)
- Desktop vs. mobile referrals: The YouTube site (not app) on mobile sends 4.23% of all US referral traffic per visitor, more than it does on desktop (2.42%). (SparkToro / Datos)
- Likewise, unique referrals from Reddit on mobile devices (7.36%) beat referrals from Reddit on desktop (5.54%). (SparkToro / Datos)
- The opposite is true for Google and Facebook. Google referrals via mobile come to 31.4% vs 95.47% for desktop. Facebook on mobile is pegged at 7.60% vs. 11.61% for desktop. (SparkToro / Datos)
Takeaway: Factor in screen sizes when planning your SEO strategy.
Technical SEO Statistics
- Over 66% of backlinks are broken. (Ahrefs Link Rot study)
- 7.4% of pages ranking in the top 10 of Google don’t have a title tag. (Ahrefs title tags study)
- In 2025, Google rewrites 76% of titles displayed in SERPs (John McAlpin study), up from 61% in 2022 (Zyppy study)
- 87.7% of websites use HTTPS. (W3Techs)
- Over 23% of websites use no structured data. (W3Techs)
- Of sites that do use structured data, 67.7% use Open Graph, 52.4% use Twitter Cards, 49.7% use JSON-LD, 39.3% use generic RDFa, 25% use microdata, 0.9% use Dublin Core, and 0.4% use Microformats. (W3Techs)
Perspective: In my experience, broken link building is still a great way to get more backlinks. It can significantly increase your site’s valuation. However, it requires meticulous attention to detail.
Voice Search Statistics
- More than 1 billion voice searches are made each month. (DemandSage)
- About 90% of people think voice search is easier and faster than keyboard-based search. (OuterBox)
- Over 20% of people worldwide use voice search, and 27% use voice search on their mobile devices. (DemandSage)
- Only 13% of marketers are using voice search optimization in their strategies. (Hubspot)
- 41% of American adults use voice search daily. (Techreport)
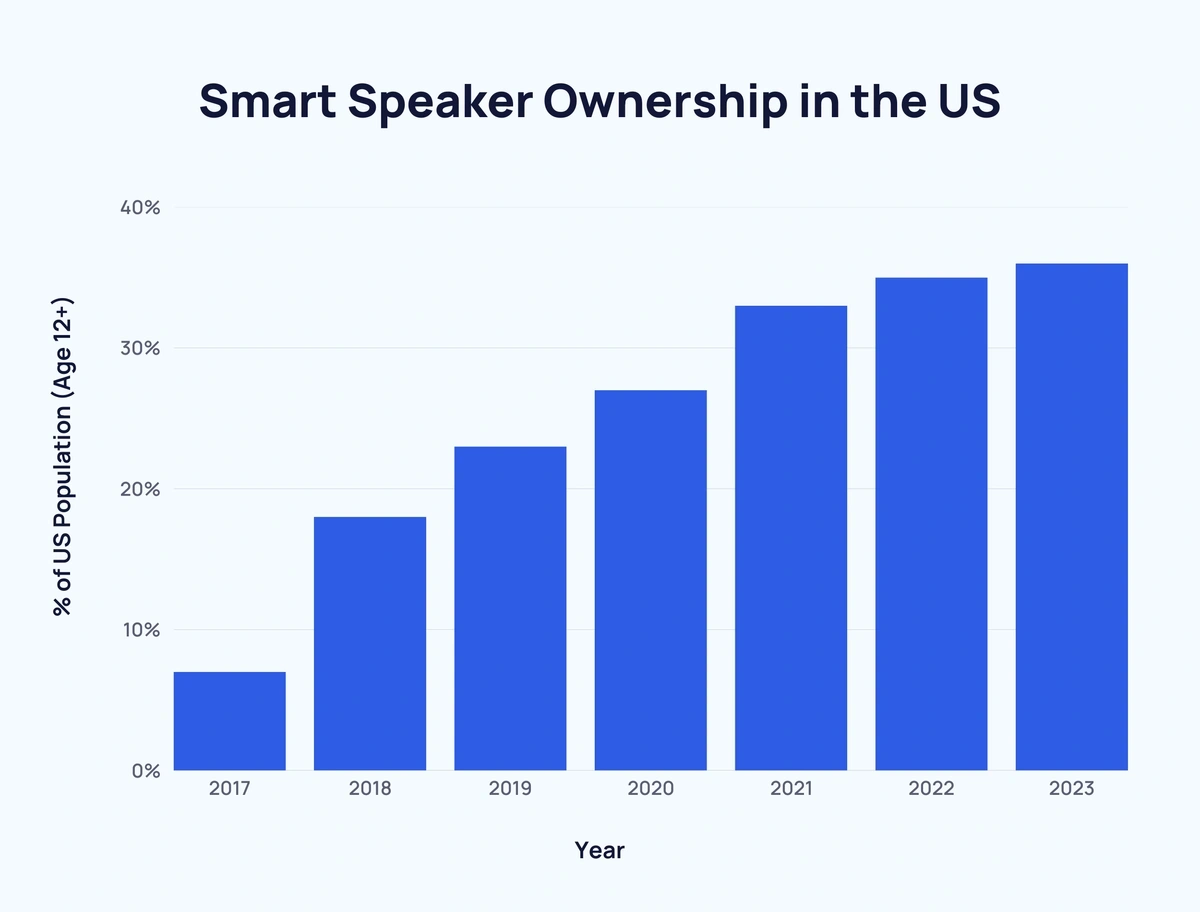
- 36% of Americans (age 12+) own a smart speaker. (Edison Research)
Takeaway: The rising popularity of voice search highlights the importance of long-tail keywords in SEO strategy, and careful keyword research is still essential.
Video SEO Statistics
- In 2024, 32% of the global population, or 2.5 billion people, tuned in to YouTube. (Statista)
- YouTube is the 2nd largest search engine, making video SEO a must (McDougall Interactive)
- Video now accounts for 82% of all internet traffic. (Associated Press)
- Short-form video content is the most popular media format used by content marketers. (Hubspot)
- Video is “53 times more likely to generate organic search rankings compared to plain text.” (Associated Press)
- In 2023, “87% of enterprise marketers reported that they used videos in the last 12 months.” (ON24)
- Video increases the likelihood of attracting backlinks, which are a ranking factor. (Associated Press)
- In the U.S., users spend an average of 52 minutes a day watching videos. That number is expected to increase to 57 minutes a day by 2028. (Statista)
Perspective: After production, don’t forget to optimize your YouTube videos by taking full advantage of the description field.
E-commerce SEO Statistics
- By 2027, e-commerce is slated to capture 41% of global retail sales. This is an increase of almost 130% from 2017. (Boston Consulting Group)
- Retail e-commerce and food e-commerce could grow to $14 trillion - $20 trillion by 2040. (McKinsey Global Institute)
- 40% of online buyers prefer using their smartphone “for the entire shopping process.” (Status Labs)
- Globally, smartphones account for 77% of retail website visits and 68% of online orders. (Statista)
- Before interacting with a salesperson, 44% of buyers consume 3-5 pieces of related content. (Demand Gen Report)
- Optimizing product pages for SEO leads to higher rankings and conversions. (ConvertCart)
- 81% of consumers use Google Reviews to assess local businesses. (BrightLocal)
- 88% of consumers say they would patronize a business that replies to all its reviews. Only 47% would use a business that never responds to reviews. (BrightLocal)
Takeaway: Simplify mobile site navigation and checkout. Automate requests for Google Reviews. And use an E-commerce keyword tool to explore opportunities.
Social Media Statistics
Because social media develops search trends of its own and because social referral traffic is often part of SEO strategy, we’ve shared related stats below.
Facebook is #1 in social media referral traffic. It drives 3.62% of all referral traffic in the U.S.
Here’s how the top social platforms stack up. (SparkToro / Datos)
| Social media platform | % of all US referral traffic |
| 3.62% | |
| YouTube | 3.48% |
| 3.15% | |
| X (formerly Twitter) | 1.22% |
| 0.76% | |
| 0.61% | |
| Discord | 0.38% |
| 0.35% | |
| TwitchTV | 0.30 |
| Fandom | 0.24% |
| 0.16% |
- 50% of consumers “discover new products” on social media. And the number of users who actually purchase on social platforms has increased 4-fold (to 59%) over the past 2 years. (Salesforce)
- 36% of shoppers purchased on social messaging apps (like Facebook Messenger and WeChat). This is up 227% from 2021. (Salesforce)
- Regarding growth in social search users, X (Twitter) led, growing from 8.5% to 14.1%. TikTok and Pinterest search usage also increased. (Datos)
- Facebook, YouTube, LinkedIn, and Reddit saw year-over-year declines in social search. However, YouTube is #1 for average number of searches per user: 19.9. (Datos)
Takeaway: With the steep rise in social commerce, digital marketers may need to adjust their social strategy to span more than brand awareness. Bluesky is likely to gain traction.
SEO Statistics: My Takeaways for 2025
The future of SEO is likely to involve more AI-driven search. But it’s important to focus on data, not hypotheticals.
- Be skeptical of related recommendations to reallocate SEO budget.
- Follow data-literate industry leaders like Rand Fishkin.
- Learn SEO for AI: “[T]he data and tools designed to optimize your search strategy for AI recommendations will gain prominence,” per Datos CEO Eli Goodman.
- Experiment to determine whether the increase in social commerce applies to your niche and can become a significant share of overall revenue.
Most importantly, demand for SEO tools, like Semrush, is likely to surge in tandem with global SEO growth.
Stop Guessing, Start Growing 🚀
Use real-time topic data to create content that resonates and brings results.
Exploding Topics is owned by Semrush. Our mission is to provide accurate data and expert insights on emerging trends. Unless otherwise noted, this page’s content was written by either an employee or a paid contractor of Semrush Inc.
Share
Newsletter Signup
By clicking “Subscribe” you agree to Semrush Privacy Policy and consent to Semrush using your contact data for newsletter purposes
Written By


Sherrie Gossett has a knack for uncovering hidden trends and opportunities that others overlook, drawing on her extensive experien... Read more


