Get Advanced Insights on Any Topic
Discover Trends 12+ Months Before Everyone Else
How We Find Trends Before They Take Off
Exploding Topics’ advanced algorithm monitors millions of unstructured data points to spot trends early on.
Features
Keyword Research
Performance Tracking
Competitor Intelligence
Find Your Site’s SEO Issues in 30 Seconds
Find technical issues blocking search visibility. Get prioritized, actionable fixes in seconds.
Powered by data from
How to Measure Growth With a Website Traffic Checker
Website traffic measures the number of visits to a site over a specific period.
It’s important to check your site’s traffic so you know:
- Which pages users are visiting
- Where they’re coming from
- How they are interacting with your site
- Whether your content, SEO, and marketing efforts are attracting the right audience.
In this article, we’ll show you how to check website traffic with the Semrush Traffic Analytics tool.
You’ll also learn how to compare that traffic to competitors and increase traffic to help your website thrive.
Why Website Traffic Matters
A steady flow of high-quality traffic increases the likelihood of conversions, sales, and audience growth.
Here are a few other reasons why understanding and improving traffic is crucial:
- Increased Visibility: Sites with strong traffic attract Google’s attention, boosting rankings and brand awareness.
- Audience Insights: Traffic data reveals audience preferences, enabling targeted content and marketing strategies.
- Competitive Advantage: Analyzing competitors’ traffic can help refine your own strategy, especially in terms of content focus and SEO tactics.
- Optimization Opportunities: Traffic analysis helps identify high-performing content and improvement areas for a stronger online presence.
In order to grow your traffic, you’ll first need to understand the metrics that you need to look at.
Key Metrics in Website Traffic Analysis
Using a traffic checker like Semrush offers a variety of insights.
Total Visits
Total Visits gives you a high-level view of traffic.
High volume indicates reach, while sustained traffic reflects user interest.
Remember that increasing visits isn’t always the end goal. Traffic on its own may not necessarily grow your business.
Keep reading to learn about the other metrics that’ll help you gauge whether you’re getting qualified traffic that will help you reach your goals.
Traffic Sources
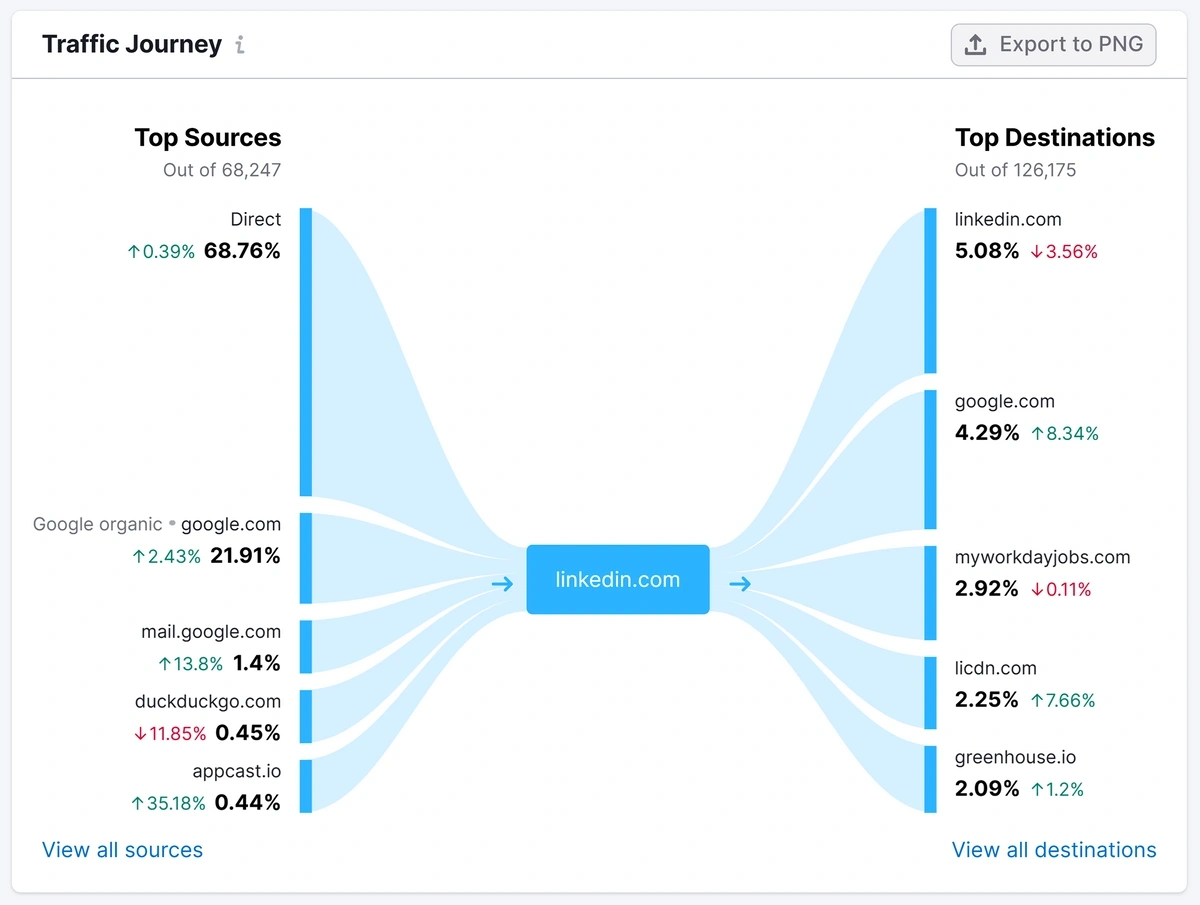
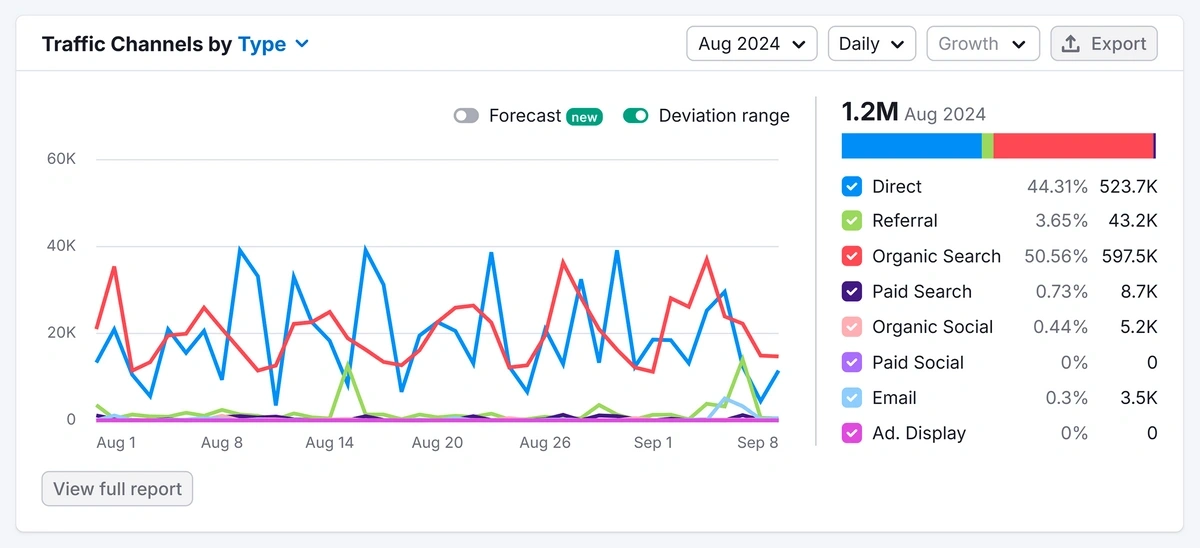
Traffic Sources helps you understand where your visitors come from.
Sources might include:
- Search engines (like Google)
- AI search engines (like Perplexity)
- Social media
- Direct traffic
- Referrals
- Search engine marketing campaigns (ads in the SERP)
Depending on your marketing strategy, this data will help you to shift efforts to focus on top-performing channels or put more resources into boosting low-traffic sources.
Bounce Rate
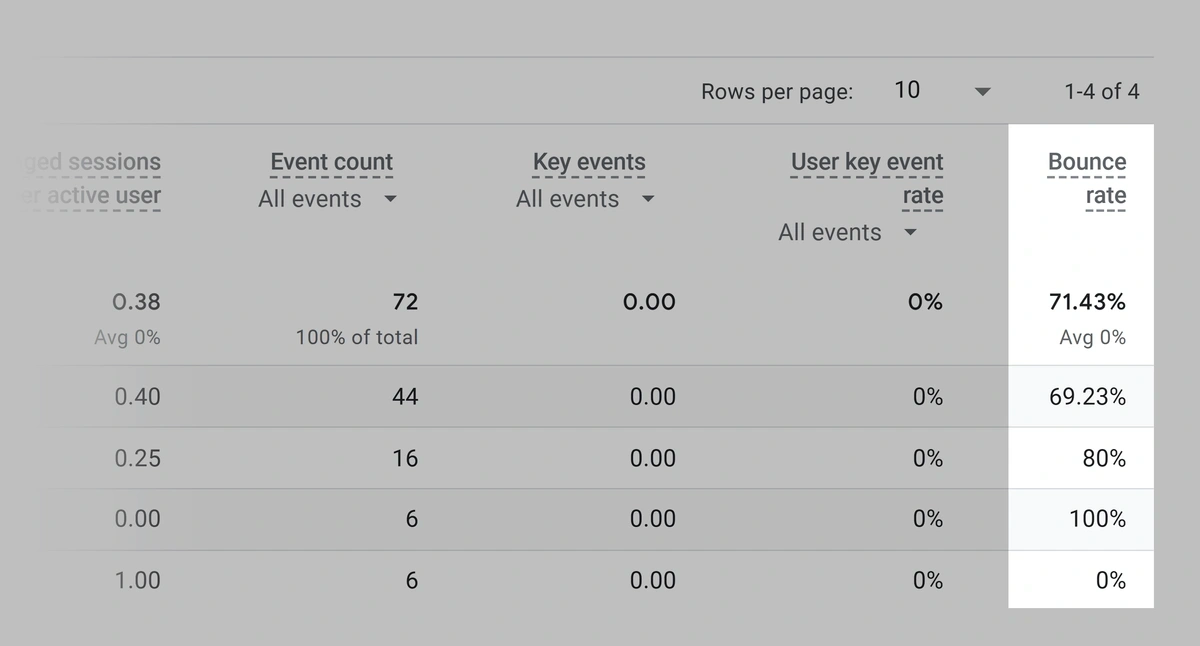
The bounce rate tells you the percentage of visitors who leave the site after viewing only one page.
A lower bounce rate indicates higher website engagement, and vice versa.
If a lot of people are bouncing, you may need to revisit your content, outreach, or advertising strategies.
Average Visit Duration and Pages Per Visit
Average Visit Duration and Pages Per Visit are engagement metrics.
They tell you how long users stay on your site and how many pages they view.
These metrics can help you to understand whether your content is effective in delivering value. For example, pages that have the longest session duration are likely the ones that audiences favor.
You can capitalize on this by producing more content in the same style.
Mobile vs. Desktop
Mobile vs Desktop is a measure of the types of devices your visitors are using.
More than 60% of traffic comes from mobile devices, but the percentage split can vary wildly depending on your business.
Knowing what tech is at the end of users’ fingertips can help you shape content and website design to better fit their experience.
If you design your content to cater to the right devices, it’ll lead to a better user experience (UX). That can boost session duration, pages per visit, and conversions.
Want to Spy on Your Competition?
Explore competitors’ website traffic stats, discover growth points, and expand your market share.
4 Strategies to Increase Website Traffic
To increase traffic, focus on quality content, search engine optimization, and promotion across channels.
Semrush offers a suite of tools to gain data-driven insights that enhance your strategy.
I’ll break down the steps based on the metrics we already discussed.
1. Create a Baseline
In Semrush Traffic Analytics, enter your domain to access a detailed report on:
- Total visits
- Pages per session
- Traffic sources
- User behavior.
It’s best to measure over the past three to six months. However, if you’re aware of seasonal fluctuations (such as a Black Friday surge in traffic), you might want to exclude those to get a clearer picture.
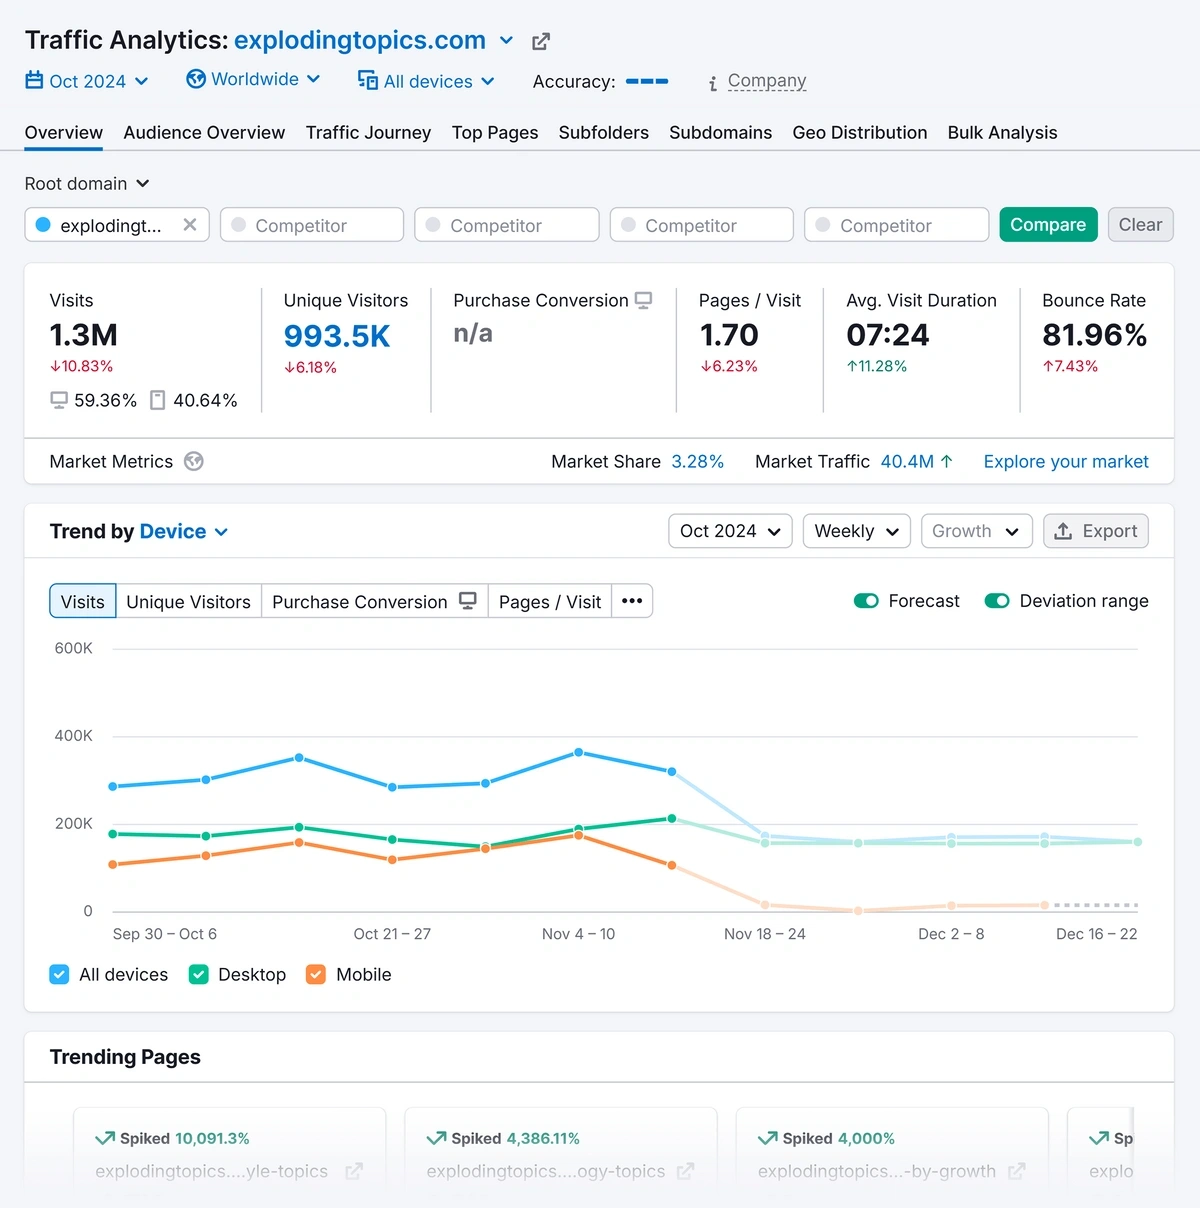
The Traffic Analytics Overview report provides:
- Visits – Approximately how many people visited in the last month in total
- Unique Visitors – How many of those total visits were unique
- Purchase Conversion – A rough estimation of how many website sessions converted
- Pages/Visit – the number of pages the average visitor navigated to
- Average Visit Duration – how long visitors stayed on site per visit on average
- Bounce Rate – the percentage of people who left the site after viewing one page.
You can dive further into the report to get traffic patterns, seasonal trends, audience engagement, and more.
From this data, identify any high-traffic pages or notable peaks and dips in traffic.
This baseline will serve as your reference point, allowing you to measure future growth and performance improvements as you implement new strategies.
2. Create Relevant Content
Content that aligns with your audience’s interests encourages higher traffic and more engagement.
To create the best content, you’ll want to do some research:
- Use Semrush’s Topic Research tool to discover popular topics in your industry and generate keyword ideas.
- The Semrush Organic Research tool shows your highest-ranking pages and the keywords that drive traffic.
- Monitor industry trends to stay ahead of the game and create content that captures emerging interest before your competitors.
Once you’ve developed your content strategy, use Semrush’s SEO Content Template to develop a brief for your writers.
3. Post on Social Media
Social channels can drive traffic when used effectively.
Find out where your audience is active and join the conversation to increase qualified clicks to your site.
These Semrush tools can help you with all your social media efforts:
- Social Media Poster lets you schedule and publish content across platforms like Facebook, Twitter, Instagram, LinkedIn, and Pinterest—all from one dashboard.
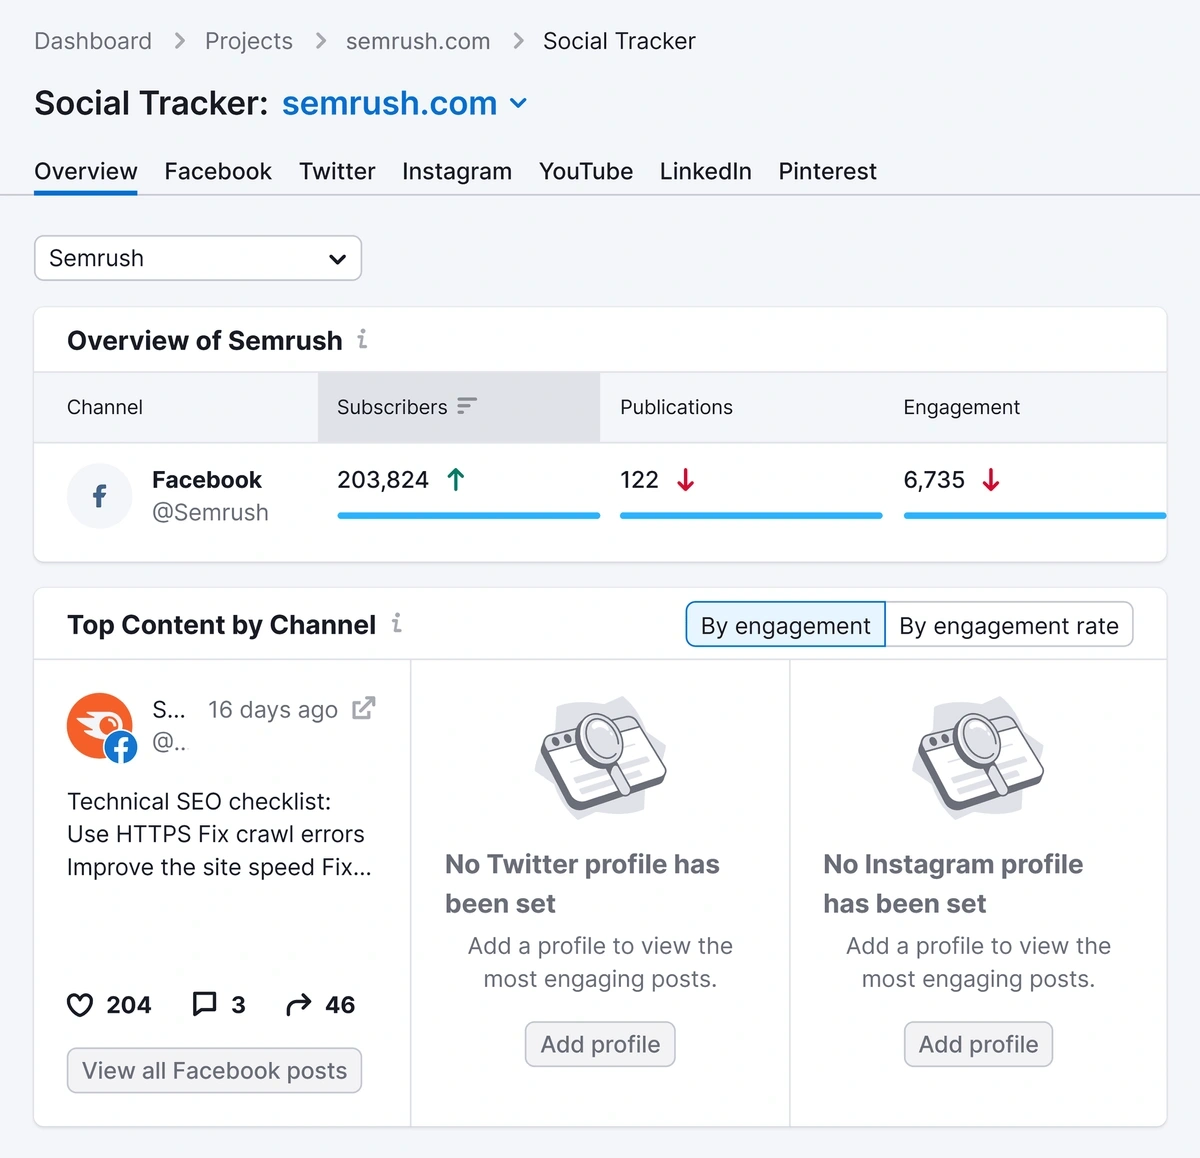
- Social Media Tracker helps you monitor your performance and track key metrics, including engagement, audience growth, and content reach.
- Social Media Analytics offers a view into competitors' social strategies, with information on top-performing posts, hashtags, and engagement tactics.
4. Use Paid Advertising
To improve visibility quickly, consider paid search and display ads.
The Semrush Advertising Research tool provides insights into successful ad strategies, helping you allocate your budget effectively.
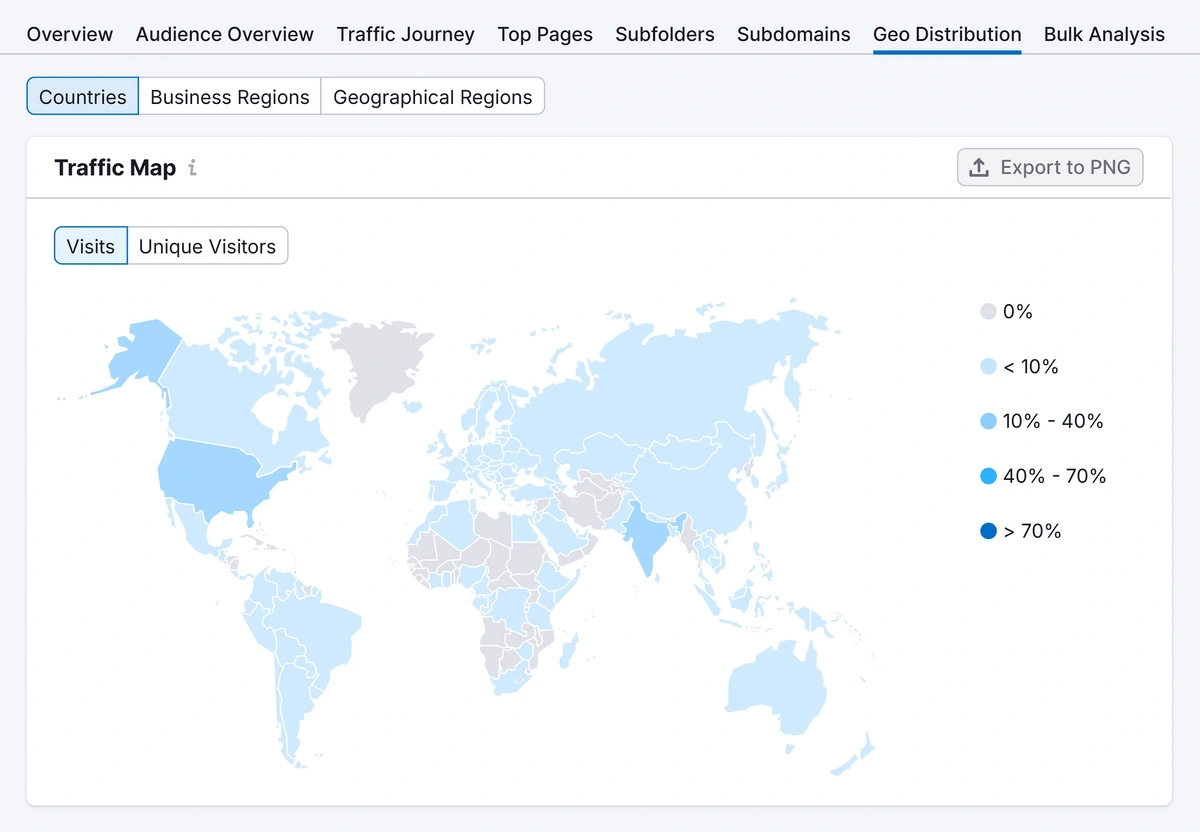
Understanding your audience’s location can refine targeting efforts. With Traffic Analytics, check the Geographic Distribution (“Geo Distribution”) tab for insights into where most visitors come from, allowing for tailored content and ad campaigns.
You can see data by country, business region, and geographical region.
Start Measuring Website Traffic with Semrush
Analyzing website traffic is essential for understanding and growing your online presence. Semrush provides the tools to measure traffic, optimize strategies, and stay ahead of competitors.
Sign up for Semrush today to unlock powerful tools that help you analyze, compare, and grow your website traffic.
Stop Guessing, Start Growing 🚀
Use real-time topic data to create content that resonates and brings results.
Exploding Topics is owned by Semrush. Our mission is to provide accurate data and expert insights on emerging trends. Unless otherwise noted, this page’s content was written by either an employee or a paid contractor of Semrush Inc.
Share
Newsletter Signup
By clicking “Subscribe” you agree to Semrush Privacy Policy and consent to Semrush using your contact data for newsletter purposes
Written By


Claire Broadley is the Lead Editor and AI Content Strategist at Exploding Topics, where she oversees editorial workflows, AI SEO s... Read more


