Get Advanced Insights on Any Topic
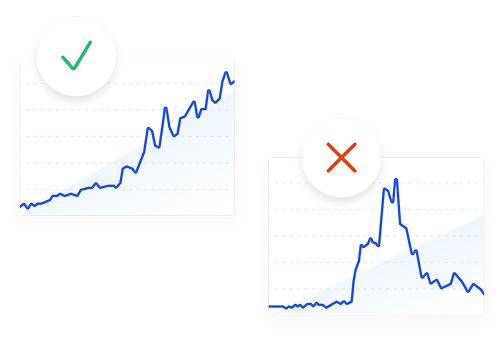
Discover Trends 12+ Months Before Everyone Else
How We Find Trends Before They Take Off
Exploding Topics’ advanced algorithm monitors millions of unstructured data points to spot trends early on.

Features
Keyword Research
Performance Tracking
Competitor Intelligence
Find Your Site’s SEO Issues in 30 Seconds
Find technical issues blocking search visibility. Get prioritized, actionable fixes in seconds.
Powered by data from
Cloud visualization software
Software designed to graphically represent cloud infrastructure, showcasing the intricate network of relationships among various cloud resources. It utilizes diagrams, charts, and other visual tools to provide a detailed picture of a cloud environment's structure and interactions, aiding in understanding, managing, and optimizing cloud resources effectively. This type of software is particularly beneficial for IT professionals, cloud architects, and system administrators who need to monitor and optimize cloud environments.
Cloud visualization software was discovered on November 8th 2021 and it currently has a search volume of 0-100 with a growth of +2300%.
Growth
- Exploding
- Regular
- Peaked
Speed
- Exponential
- Constant
- Stationary
Seasonality
- High
- Medium
- Low
Volatility
- High
- Average
- Low
Save this topic and build your own trend dashboard.
Available with Exploding Topics Pro, try it now.

1.1M+ trends in our growing database.


