


Get Advanced Insights on Any Topic
Discover Trends 12+ Months Before Everyone Else
How We Find Trends Before They Take Off
Exploding Topics’ advanced algorithm monitors millions of unstructured data points to spot trends early on.

Keyword Research
Performance Tracking
Competitor Intelligence
Fix Your Site’s SEO Issues in 30 Seconds
Find technical issues blocking search visibility. Get prioritized, actionable fixes in seconds.
Powered by data from
Latest Blog Posts
Featured Case Studies
See what's trending before everyone else
Each week, we'll send you our best Exploding Topics. Plus, expert insight and analysis.
iPhone vs Android User Stats (2025 Data)

Apple and Google dominate the global smartphone market, the former with their proprietary iPhone and the latter with their Android mobile operating system.
The first iPhone was released on June 29th, 2007. Android appeared on the scene a little over a year later. Since then, the majority of smartphone users have picked their side in the battle between iPhone and Android.
iPhone vs Android User Stats (2025 Top Picks)
Here’s a quick look at the difference between iPhone and Android users:
- In the US, iPhone has a 57.68% market share
- As of 2024, Android has a 70.93% global market share
- iPhone users have a 43.7% higher average salary than Android users
- Gen Z and Millennials are more likely to be iPhone users
- 47% of former Android users say the iPhone provides a better user experience
- 29% of former iPhone users say Android is more affordable
iPhone vs Android Market Share in the US
In the US, iPhone has a 57.68% market share, while Android has a 42.06% market share.
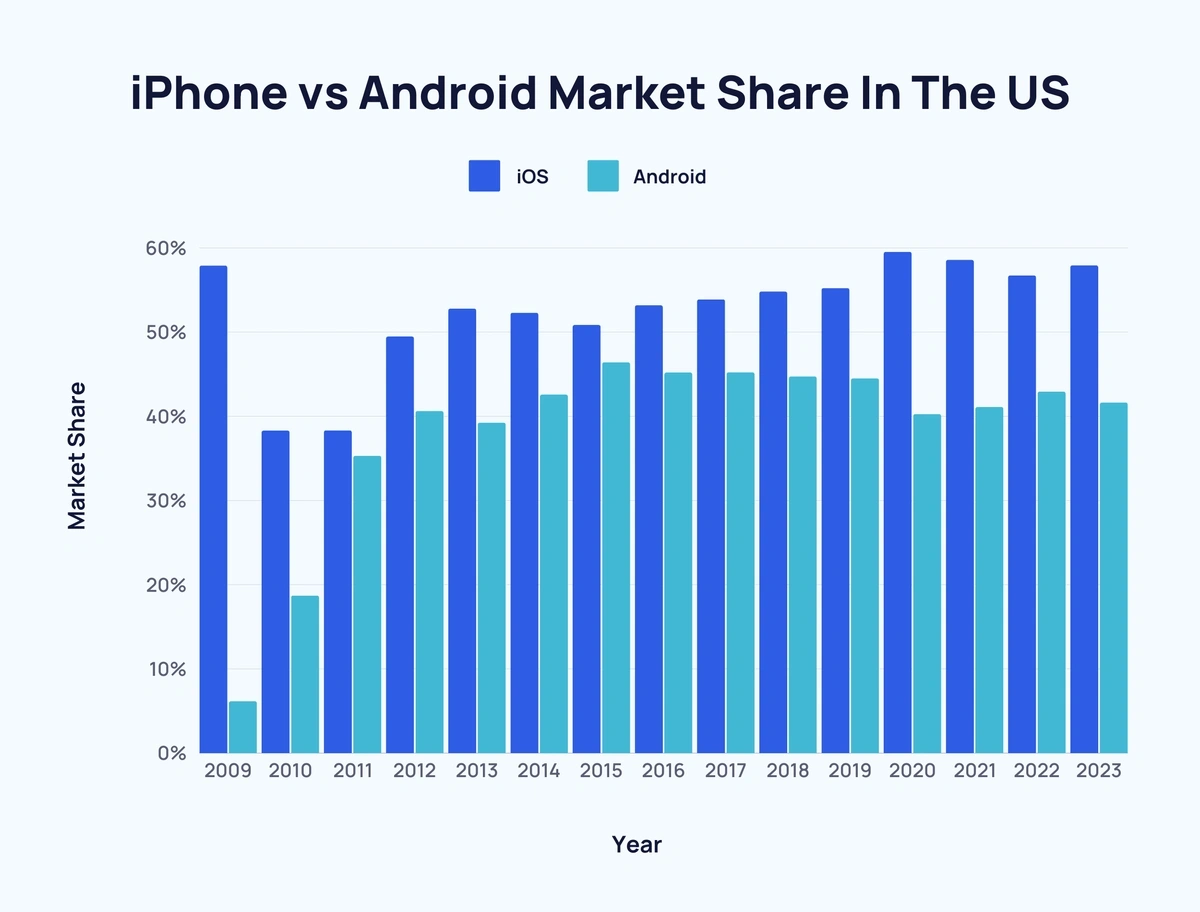
iPhone has led the US smartphone market since at least 2009. The closest Android came to beating iPhone was in 2011 when it captured a sizable amount of former Blackberry users.
Here’s the latest data on mobile iOS vs. Android market share in the US:
| Year | iOS | Android |
| 2009 | 57.9% | 6.16% |
| 2010 | 38.31% | 18.71% |
| 2011 | 38.33% | 35.32% |
| 2012 | 49.48% | 40.63% |
| 2013 | 52.79% | 39.25% |
| 2014 | 52.3% | 42.58% |
| 2015 | 50.85% | 46.42% |
| 2016 | 53.19% | 45.2% |
| 2017 | 53.89% | 45.23% |
| 2018 | 54.82% | 44.73% |
| 2019 | 55.23% | 44.51% |
| 2020 | 59.54% | 40.27% |
| 2021 | 58.58% | 41.11% |
| 2022 | 56.74% | 42.94% |
| 2023 | 58.1% | 41.46% |
| 2024 | 58.81% | 40.81% |
| 2025 | 57.68% | 42.06% |
Source: StatCounter
iPhone vs Android Global Market Share
If you live in the United States, you might be surprised to learn that Android is by far the most popular mobile operating system in the world.
While Apple’s iPhone has a slight edge over Android in the United States, on a global level, Android controls over two-thirds of the mobile OS market.

Apple enjoyed more global popularity than Android from 2009 to 2011, though both were overshadowed by the now-defunct SymbianOS (Symbian controlled 35.49% of the global mobile OS market in 2009).
With SymbianOS and Blackberry falling out of favor in the early 2010s, iPhone and Android became the two giants in the mobile space.
Aside from the US, iPhone also leads in Japan (68.86%), Canada (60.31%), Australia (59.63%), and the United Kingdom (52.29%).
Android has a more impressive market share in other countries. In India, Android’s market share is a staggering 95.16%. Google’s OS also has a sharp edge in Brazil (81.45%), Mexico (77.46%), and China (74.76%).
Here’s the latest data on the global mobile iOS vs. Android market share:
| Year | iOS | Android |
| 2009 | 34.01% | 2.41% |
| 2010 | 25.48% | 8.82% |
| 2011 | 22.29% | 19% |
| 2012 | 24.04% | 27.41% |
| 2013 | 24.03% | 39.21% |
| 2014 | 23.95% | 53.65% |
| 2015 | 20.2% | 64.2% |
| 2016 | 19.29% | 69.11% |
| 2017 | 19.65% | 72.63% |
| 2018 | 20.47% | 75.45% |
| 2019 | 22.71% | 75.47% |
| 2020 | 26.28% | 73.06% |
| 2021 | 27.34% | 71.89% |
| 2022 | 27.85% | 71.47% |
| 2023 | 29.02% | 70.26% |
| 2024 | 28.32% | 70.93% |
Source: StatCounter
iPhone vs Android User Demographics
Humans tend to be tribal about many things, including which smartphones they use.
In a 2021 mobile consumer survey by The Hustle, 16.7% of Android users said they had less respect for iPhone users. 27.2% of iPhone users said the same about Android users.
Want to Spy on Your Competition?
Explore competitors’ website traffic stats, discover growth points, and expand your market share.
But are iPhone and Android users really that different from one another? Let’s dig into the numbers and find out.
- iPhone users tend to be higher earners than Android users. Research by Slickdeals found that iPhone users had an average annual salary of $53,251 compared to $37,040 for Android users. The latest iPhone model starts at $799, while the average price for smartphones that run the Android operating system is $286.
- The same study revealed that iPhone users tended to be more active with their smartphones. Apple users averaged 4 hours and 54 minutes of screen time, sent 58 text messages, and took 12 selfies every day. For Android users, the numbers are much lower: 3 hours and 42 minutes of screen time, 26 text messages, and 7 selfies per day.
- iPhone users are also slightly more confident in their smartphone’s security features. In a 2022 survey, 20% of iPhone users said they felt “extremely confident” that Apple iCloud Keychain keeps their data secure. 13% of Android users felt the same way about Google Password Manager.
- Smartphone users have different habits when it comes to security. Android users are more likely to use a native password manager (72% vs. 62%). iPhone users are more likely to monitor location tracking in their apps (77% vs. 68%).
Younger generations in the United States are more likely to be iPhone users, while Android has a slight edge with older generations:
iPhone vs Android users by age, United States:
| Age | iPhone | Android |
| 18-34 | 58% | 41% |
| 35-54 | 47% | 53% |
| 55 and older | 49% | 51% |
While Android is the most popular choice overall globally, Gen Z and Millennials are still more likely to be iPhone users:
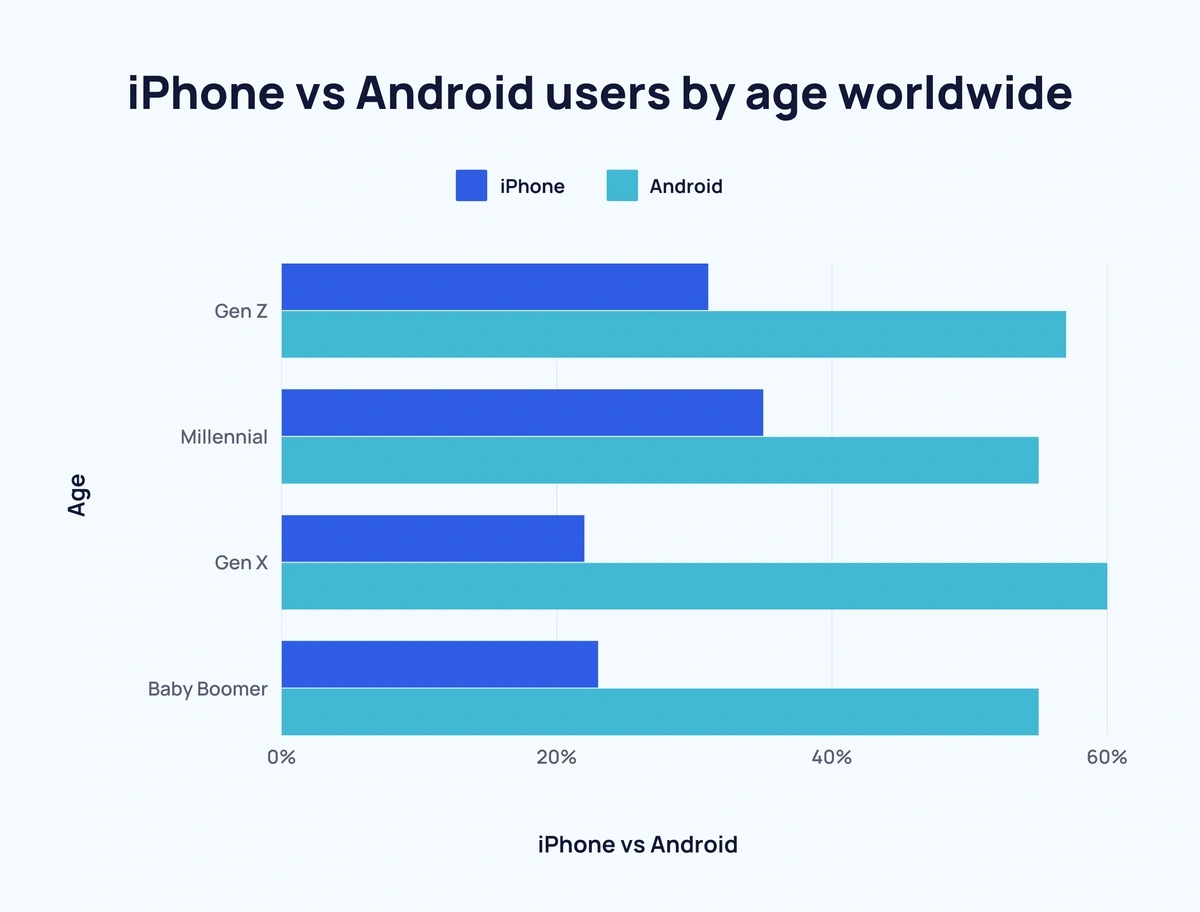
iPhone vs Android users by age worldwide:
| Age | iPhone | Android |
| Gen Z | 31% | 57% |
| Millennial | 35% | 55% |
| Gen X | 22% | 60% |
| Baby Boomer | 23% | 55% |
There’s also a slight difference in usage along gender lines. Female users are more likely to be iPhone adopters worldwide.
iPhone vs Android users by gender worldwide:
| Gender | iPhone | Android |
| Male | 28% | 60% |
| Female | 31% | 54% |
Sources: The Hustle, Slickdeals, Beyond Identity, Vorhaus Advisors, Statista, Statista (2)
iPhone vs Android User Loyalty
Customer loyalty is also key to understanding iPhone and Android users.
Simply put, smartphone owners are fiercely loyal.
- Both mobile operating systems have impressively high retention rates. Android has an 89-91% customer retention rate. iPhone’s retention rate ranges from 85-88%. This suggests most consumers pick one brand and stick with it for the long haul.
- Those are impressive loyalty numbers. However, a fraction of users have switched to a different mobile OS. 18% of iPhone users are former Android users, while only 11% of Android users made the switch from Apple.
- Two significant reasons for making the switch are user experience and affordability. 47% of former Android users say the iPhone provides a better user experience. Just 30% of former iPhone users say the same about Google’s OS. 29% of former iPhone users made the switch to Android because it was more affordable. Only 11% of former Android users believe their new iPhone was more affordable.
iPhone vs Android Apps
Smartphones wouldn’t be smartphones without offering users millions of apps. Let’s explore the differences between the App Store and Google Play.
- First, consider the number of apps available to users. iPhone’s App Store has over 1.9 million apps available as of March 2025. Google Play has over 2 million apps.
- Both Android and iPhone average 1.2K new apps released every day.
- Android not only leads in the number of apps but also the number of app categories too – 49 distinct categories vs. iPhone’s 26.
Android apps also tend to enjoy higher user ratings:
Here’s a breakdown of how apps are rated in the App Store and Google Play:
| App Ratings | App Store Apps | Google Play Apps |
| 1.0-1.5 | 44,946 | 3,575 |
| 1.5-2.0 | 15,325 | 10,722 |
| 2.0-2.5 | 33,253 | 23,951 |
| 2.5-3.0 | 27,167 | 43,314 |
| 3.0-3.5 | 64,598 | 93,145 |
| 3.5-4.0 | 58,993 | 177,809 |
| 4.0-4.5 | 125,077 | 317,396 |
| 4.5-5.0 | 173,539 | 266, 891 |
| 5.0 | 270,499 | 79,841 |
iPhone vs Android App Revenue
Mobile apps generated an estimated $542 billion in global revenue in 2023. By 2027, that number could reach $732 billion.
- Consumers spent $85.1 billion in the App Store in 2021, while Google Play’s apps generated $47.9 billion. The App Store is clearly the winner in revenue, which seems counterintuitive when you consider that both devices have a similar spread of free vs. paid apps.
- iPhone’s apps are 95.2% free and 4.8% paid. Android’s apps are 97.7% free and 2.3% paid. That suggests that iPhone users may be more willing to spend money on apps than Android users.
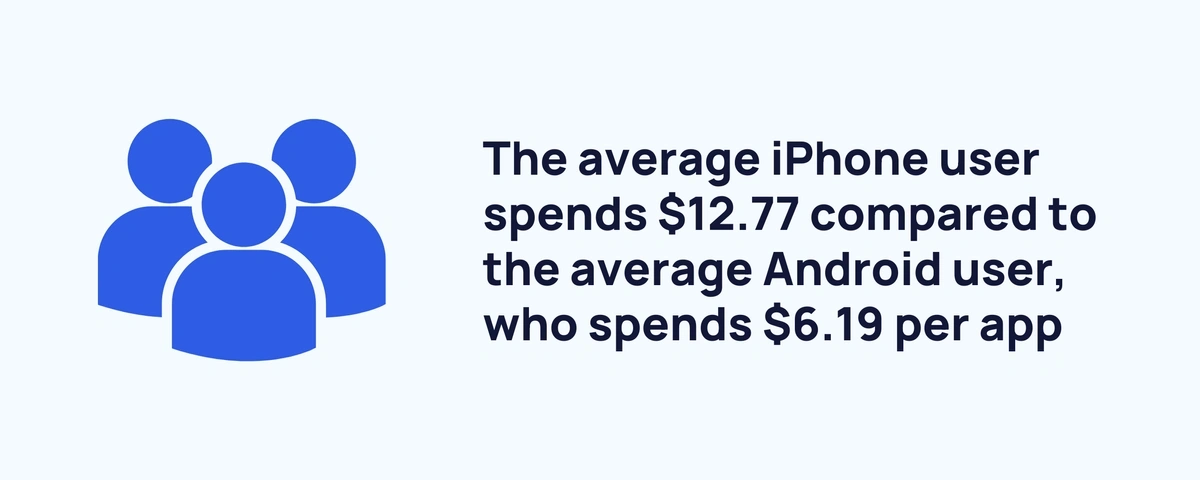
- On average, an iPhone user spends $12.77 per app. By comparison, the average Android user spends $6.19 on each app. For in-app purchases, the average transaction on iPhones is $1.07, while the average transaction on Android is $0.43.
Top iPhone apps by revenue as of June 2023:
| App | Revenue |
| DouYin | $372.8M |
| TikTok | $324.4M |
| Picoma | $228.32M |
| Honor of Kings | $165.75M |
| Tencent Video | $165.71M |
| Roblox | $129.95M |
| Honkai: Star Rail | $104.8M |
| Max | $103.93 M |
| Iqiyi | $96.54M |
| LINE | $93.24M |
| Disney+ | $92.06M |
| Candy Crush Saga | $90.26M |
| YouTube | $89.94M |
| PUBG | $88.63M |
| Genshin Impact | $72.97M |
| Tinder | $72.38M |
| Royal Match | $71.81M |
| Audible | $70.94M |
| Fantasy Westward Journey | $70.85M |
Top Android apps by revenue as of June 2023:
| App | Revenue |
| Disney+ | $70.59M |
| Max | $50.73M |
| TikTok | $38.09M |
| Google One | $27.34M |
| Peacock TV | $25.2M |
| Twitch | $25.08M |
| Crunchyroll | $22.19M |
| Bumble | $19.08M |
| Tinder | $17.79M |
| Paramount+ | $15.22M |
| Globoplay | $13.41M |
| Pandora | $9.5M |
| Hulu | $8.03M |
| Vudu | $7.27M |
| ESPN | $6.16M |
| Microsoft OneDrive | $6.12M |
| Duolingo | $5.9M |
| Fitbit | $5.89M |
Both operating systems have similar app conversion rates.
The App Store has a 30% conversion rate, while Google Play has a 30.5% conversion rate.
Apple’s top category is navigation (104.5% CVR). Android’s top category is events (84.1%).
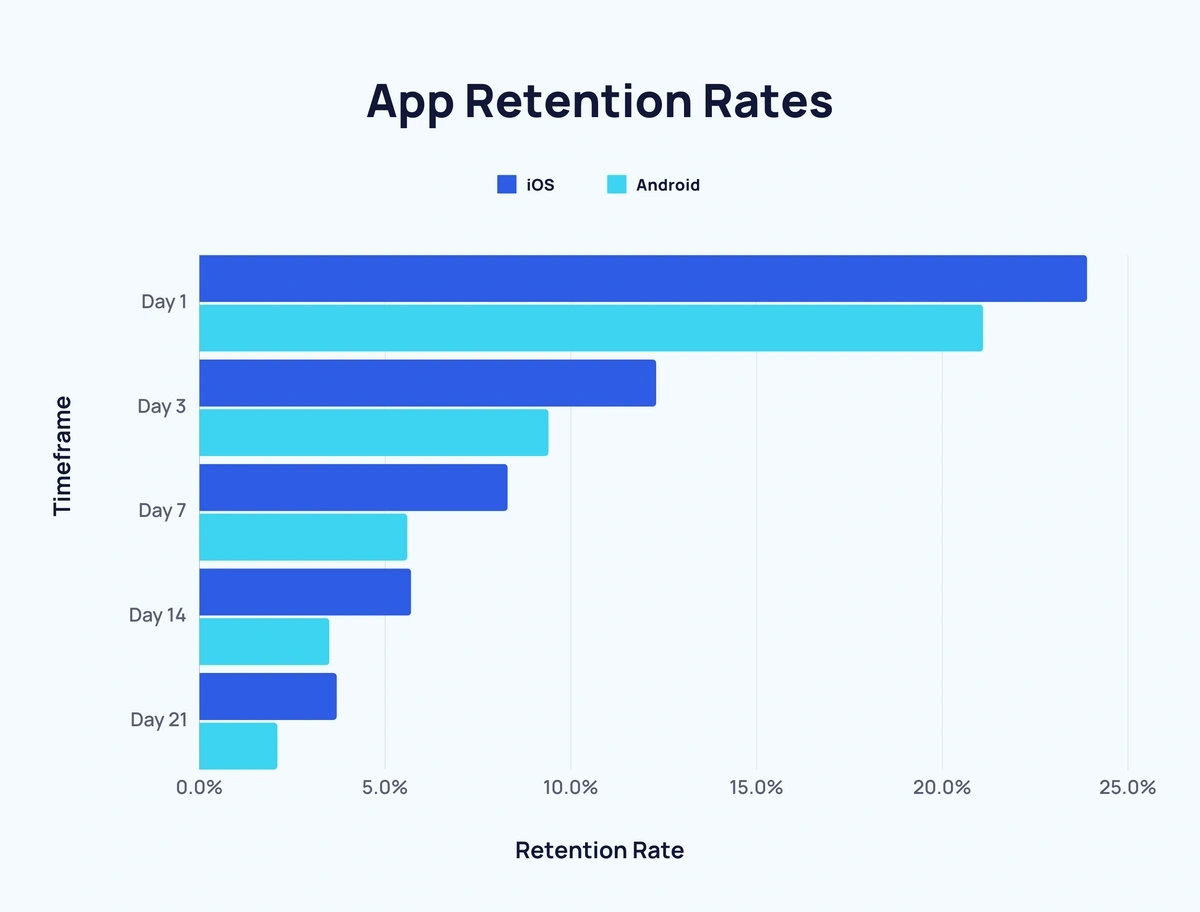
In-app purchases are key to driving revenue, and longer app retention rates could increase the odds of users making those purchases.
Here’s how iPhone and Android stack up in app retention:
| Timeframe | iPhone App Retention Rate | Android App Retention Rate |
| Day 1 | 23.9% | 21.1% |
| Day 3 | 12.3% | 9.4% |
| Day 7 | 8.3% | 5.6% |
| Day 14 | 5.7% | 3.5% |
| Day 21 | 3.7% | 2.1% |
Sources: Statista, Statista (2), Statista (3), 42 Matters, Sensor Tower, Apptweak, AppsFlyer, Business of Apps
Key Takeaways
Android may be the smartphone of choice around the world, but the iPhone commands a higher market share in several key markets.
Budget appears to be the deciding factor between the two. When consumers have enough disposable income — assuming they aren’t completely loyal to their mobile OS — they tend to gravitate toward the iPhone for a better user experience.
If you’re looking for even more smartphone statistics, check out How Many People Own Smartphones? and Time Spent Using Smartphones.
Stop Guessing, Start Growing 🚀
Use real-time topic data to create content that resonates and brings results.

Exploding Topics is owned by Semrush. Our mission is to provide accurate data and expert insights on emerging trends. Unless otherwise noted, this page’s content was written by either an employee or a paid contractor of Semrush Inc.
Share
Newsletter Signup
By clicking “Subscribe” you agree to Semrush Privacy Policy and consent to Semrush using your contact data for newsletter purposes
Written By


Josh is the Co-Founder and CTO of Exploding Topics. Josh has led Exploding Topics product development from the first line of co... Read more