Exploding Topics
Trending Startups
Top Websites
Get Advanced Insights on Any Topic
Discover Trends 12+ Months Before Everyone Else
How We Find Trends Before They Take Off
Exploding Topics’ advanced algorithm monitors millions of unstructured data points to spot trends early on.

Features
Keyword Research
Performance Tracking
Competitor Intelligence
Find Your Site’s SEO Issues in 30 Seconds
Find technical issues blocking search visibility. Get prioritized, actionable fixes in seconds.
Powered by data from
Data storytelling
The practice of building a narrative around a set of data and its accompanying visualizations to help convey insights in a compelling and easily understandable way. It combines data, visuals, and narrative to tell a story that can influence decision-making and drive action, making complex data more accessible and engaging. Data storytelling is widely used in fields such as business, journalism, and academia to enhance the communication of data-driven insights.
Data storytelling was discovered on January 31st 2023 and it currently has a search volume of 22.2K with a growth of +175%.
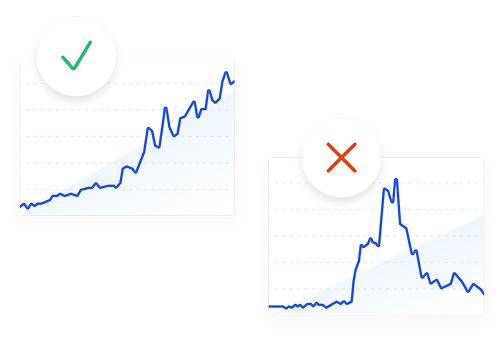
Growth
- Exploding
- Regular
- Peaked
Speed
- Exponential
- Constant
- Stationary
Seasonality
- High
- Medium
- Low
Volatility
- High
- Average
- Low
Save this topic and build your own trend dashboard.
Available with Exploding Topics Pro, try it now.

1.1M+ trends in our growing database.