


Get Advanced Insights on Any Topic
Discover Trends 12+ Months Before Everyone Else
How We Find Trends Before They Take Off
Exploding Topics’ advanced algorithm monitors millions of unstructured data points to spot trends early on.

Keyword Research
Performance Tracking
Competitor Intelligence
Fix Your Site’s SEO Issues in 30 Seconds
Find technical issues blocking search visibility. Get prioritized, actionable fixes in seconds.
Powered by data from
Latest Blog Posts
Featured Case Studies
See what's trending before everyone else
Each week, we'll send you our best Exploding Topics. Plus, expert insight and analysis.
10 Top Alternative Data Providers & Companies (2026)

There's no shortage of alternative data providers out there.
Choosing the right one to invest in ultimately depends on the kind of research you want to do (and your budget).
With that, here's our list of the top alternative data companies in 2026:
1. Exploding Topics
Exploding Topics is a unique source of alternative data.
Specifically, our tool identifies topics that are rapidly trending online from sources like Google search, TikTok, online communities and more.
Our tool lets you:
- Identify super early trends across dozens of categories — for example, marketing, pets, fitness, health, food, lifestyle, design, crypto, technology, SaaS, startups, etc.
- Access detailed trend analyses to see data like search volume and growth rates to understand more about the background of each trend and forecast future interest.
- Save trends to a trend tracking dashboard to easily monitor important trends.
Notably, all of the trends on our site are vetted and verified by trend analysts. This ensures that you're seeing trends with long-term business value (as opposed to short-term social media fads).
On our website, you can access features like our trend database and Meta Trends library, and we deliver new trend reports to your email each week. But before we talk about how to use our platform's features, let’s explain our research method and how we find new trends.
Our Methodology
Our trend research method is a two-part process that involves both artificial intelligence and trend analysts to:
- Scrape dozens of online sources for indicators of early new trends.
- Review trend data to sort the long-term trends from the short-term fads.
Exploding Topics AI is constantly monitoring news outlets, social media platforms, streaming sites, podcasts, customer review sites, Ecommerce platforms like Amazon, forums like Reddit, and more.
We then look at topics, popular products, and consumer behaviors to detect blips of early new trends and gather key data about each potential new opportunity.
Then our team takes over.
This second half of our trend research is what makes our trend data so valuable — our site isn’t full of “trendy” topics, like what movies or TV show finales that people are talking about.
Instead, our team analyzes each trend, researching search volumes and target markets where the trend is relevant, looking just for valuable trends that show signs of continued interest and growth.
This way, you’re not investing time and money into chasing “hot topics” or fads — you can feel confident that every emerging brand name, technology, product idea, etc., that you find on our site holds value for your business and investment strategies long into the future.
Now, let’s talk about how you can use our features to explore the trends on our site and find new opportunities that interest you.
Key Features
You can find new trends on our website via the trend database, search, and Meta Trends library, but you can also read about promising new startups and unique product ideas in the trend reports we send each week. Regardless of how you find trends, you can access detailed trend info and add topics to your dashboard to easily track trend growth.
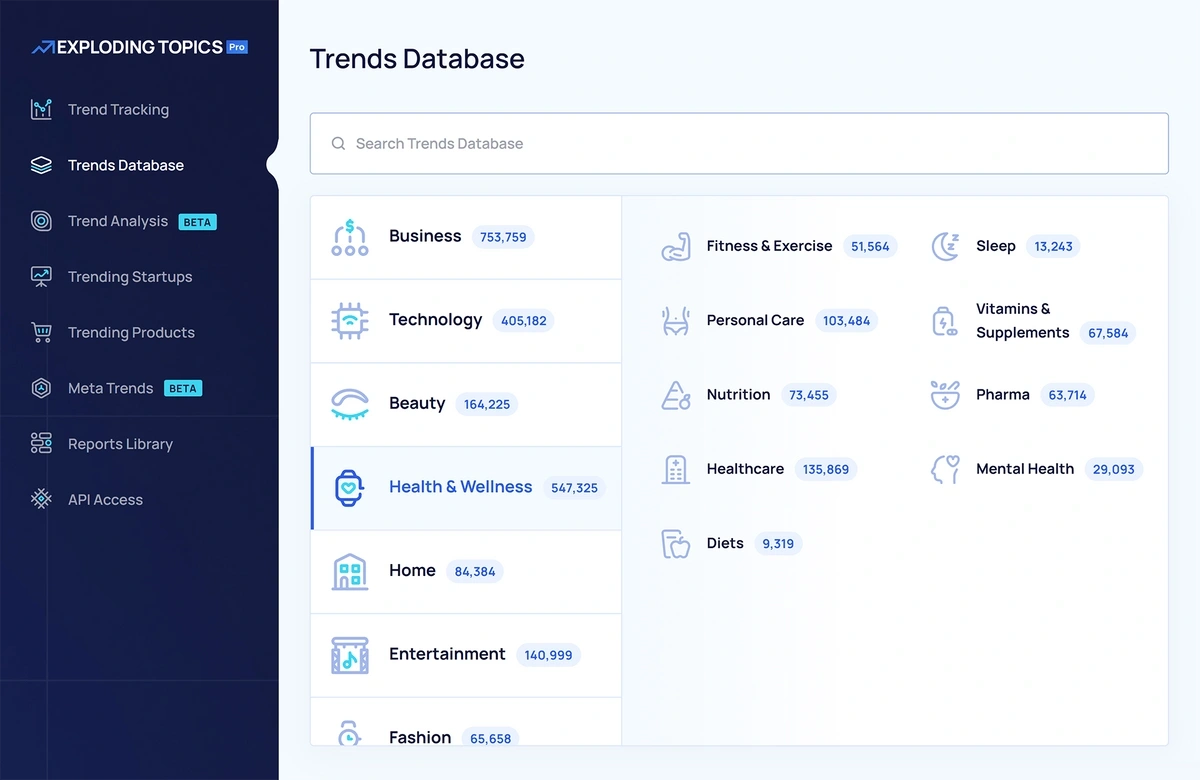
Trends Database
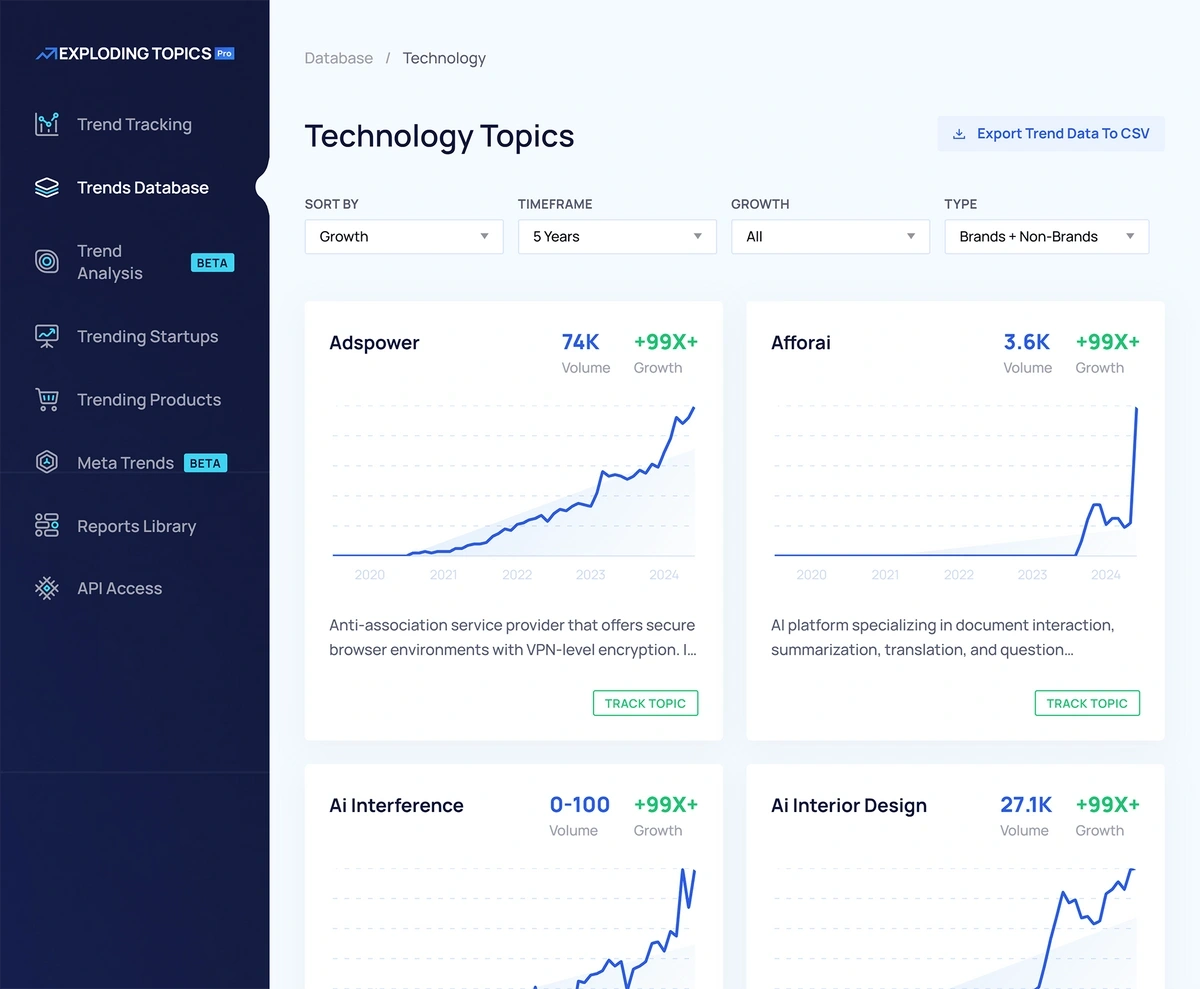
First, we have the Exploding Topics database where we store all of the trend info on our platform. Our platform tracks nearly a million trends across a variety of industries — when you reach this database, you can easily zero-in on any category or subcategory you're interested in.
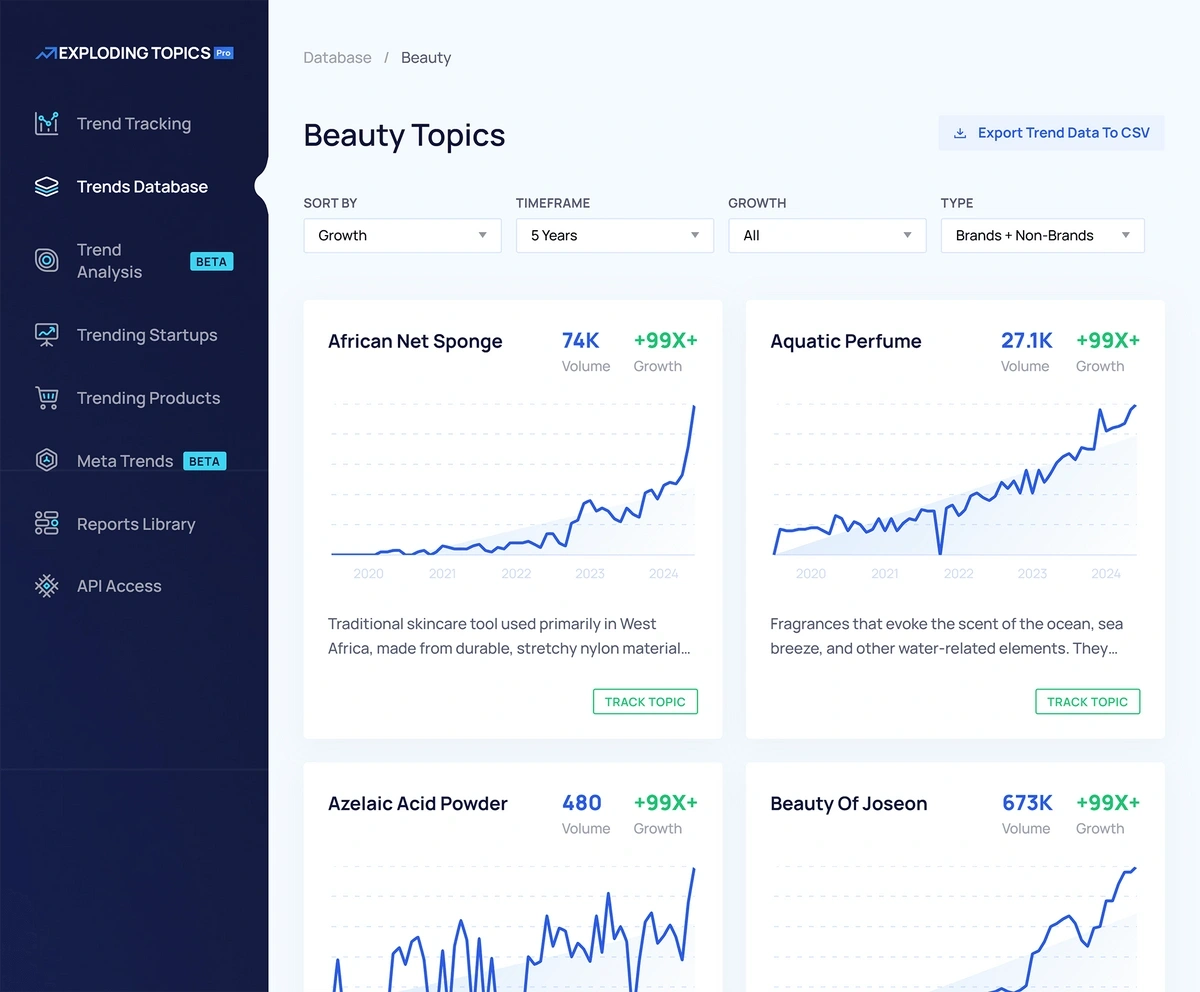
We also have extra filtering options so you can drill down to the results based on the research you want to do.
For example, you can change the date range to look at trends that have popped up over the last couple of months (vs. trends that have shown steady growth over past years). Or, you can adjust the trend status to see early trends with high-growth. Or trends that are gradually growing in popularity. Or trends that are about to take off over the next 12 months.
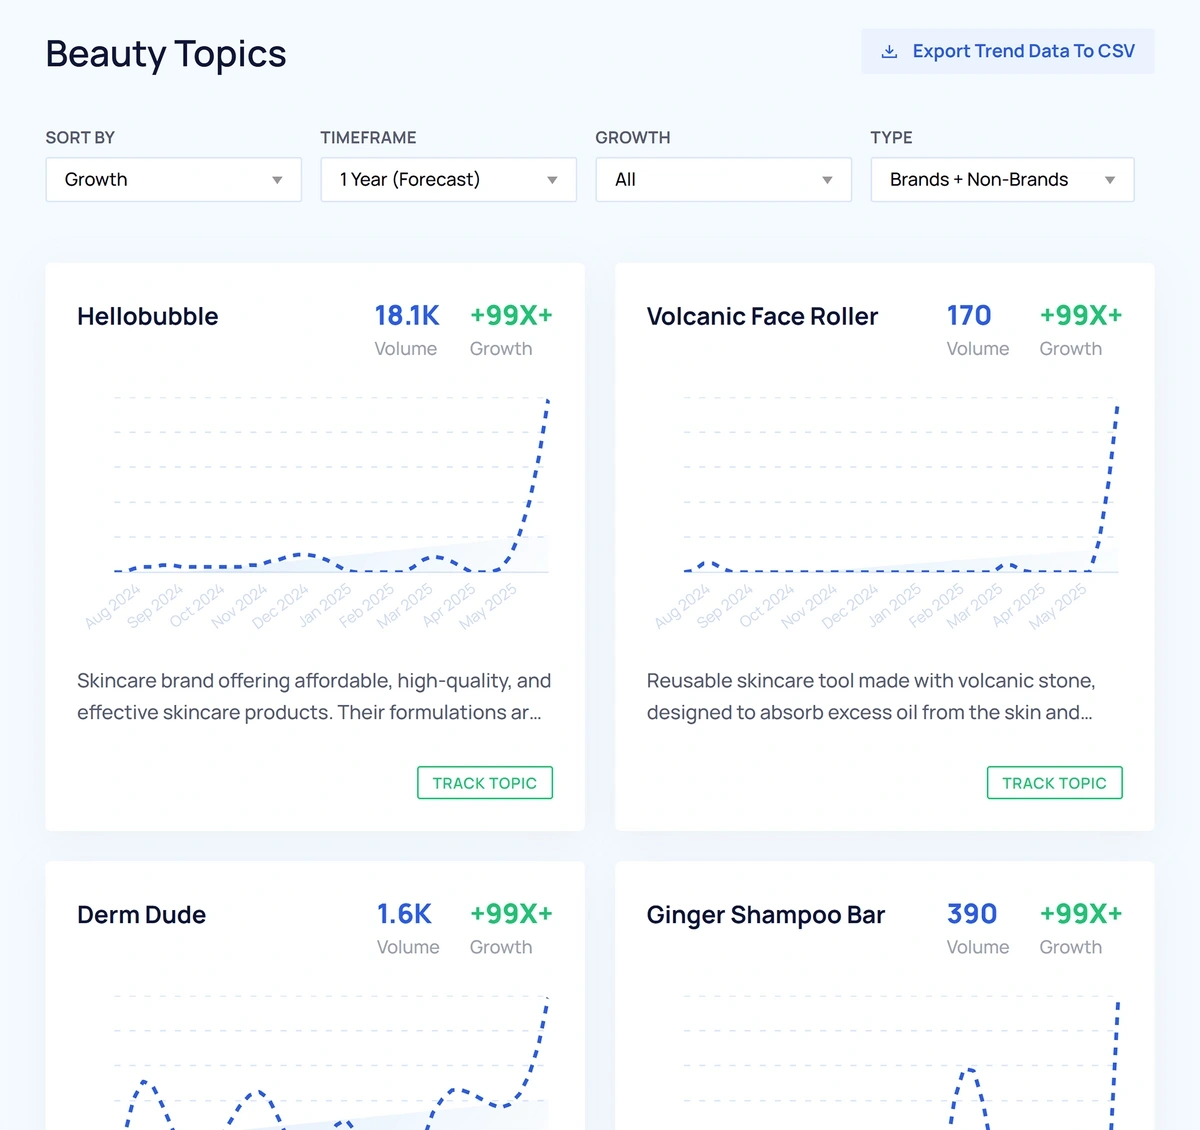
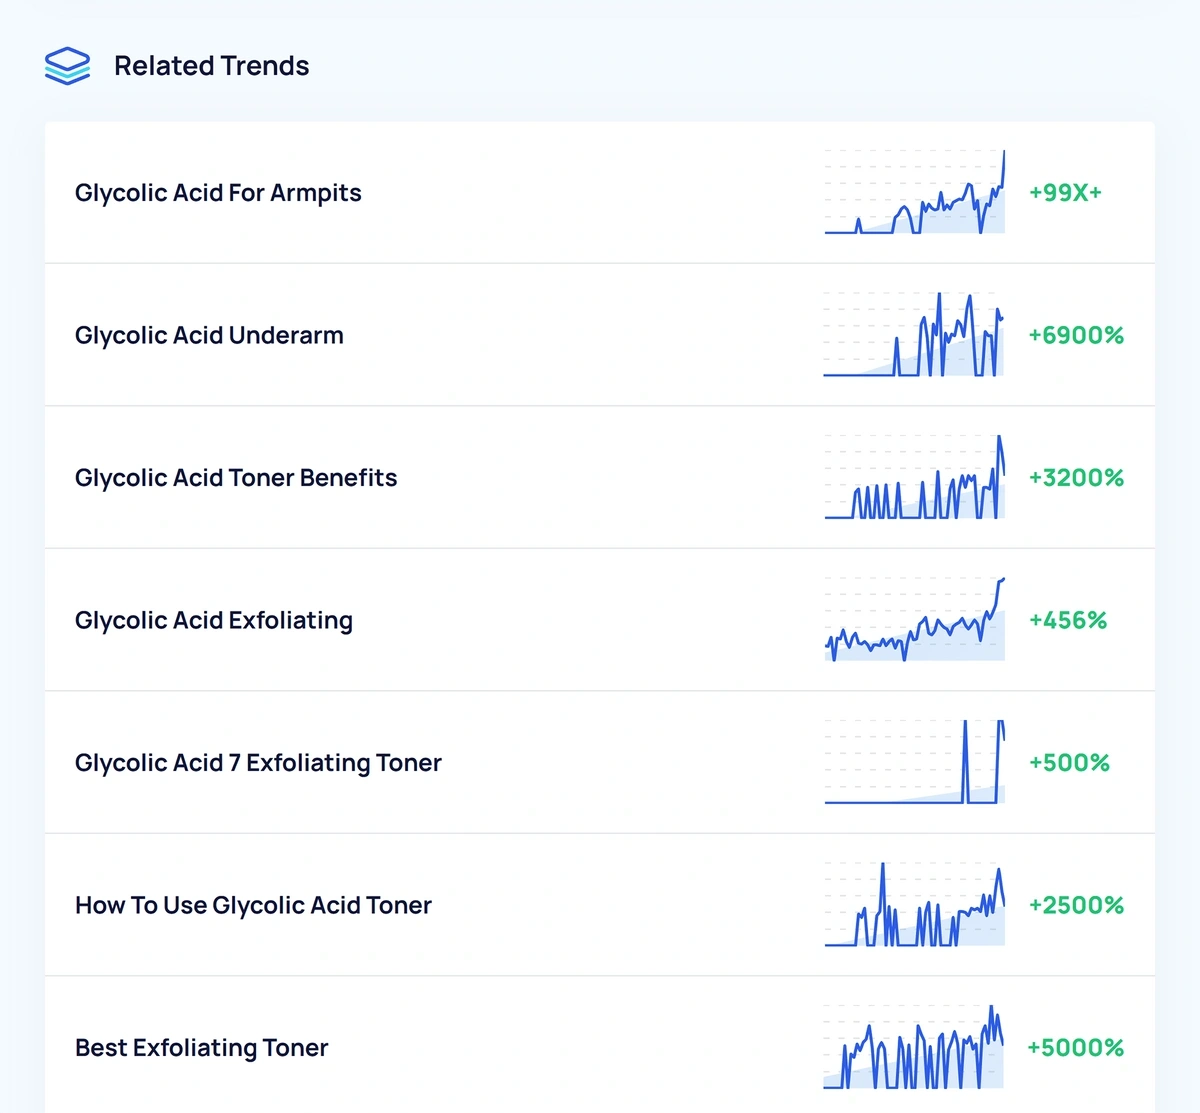
When you find a trend you’re interested in, you can open the overview window to view all of the associated data, including search volume, growth rate, status, and category — and we display this information in an interactive graph so you can hover your mouse over and view data points along different timelines.
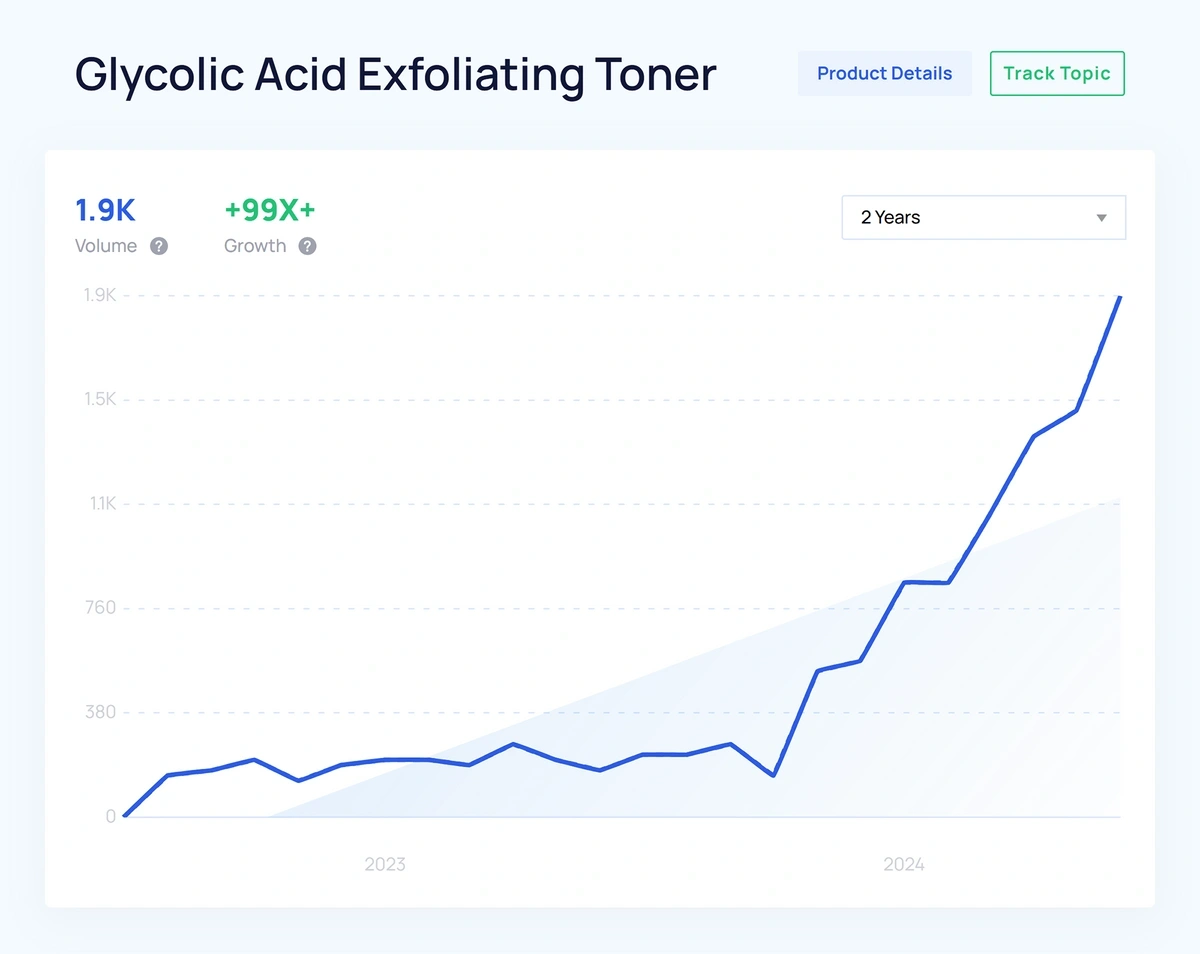
We also list related trends in the overview window so you can continue researching your area of interest.
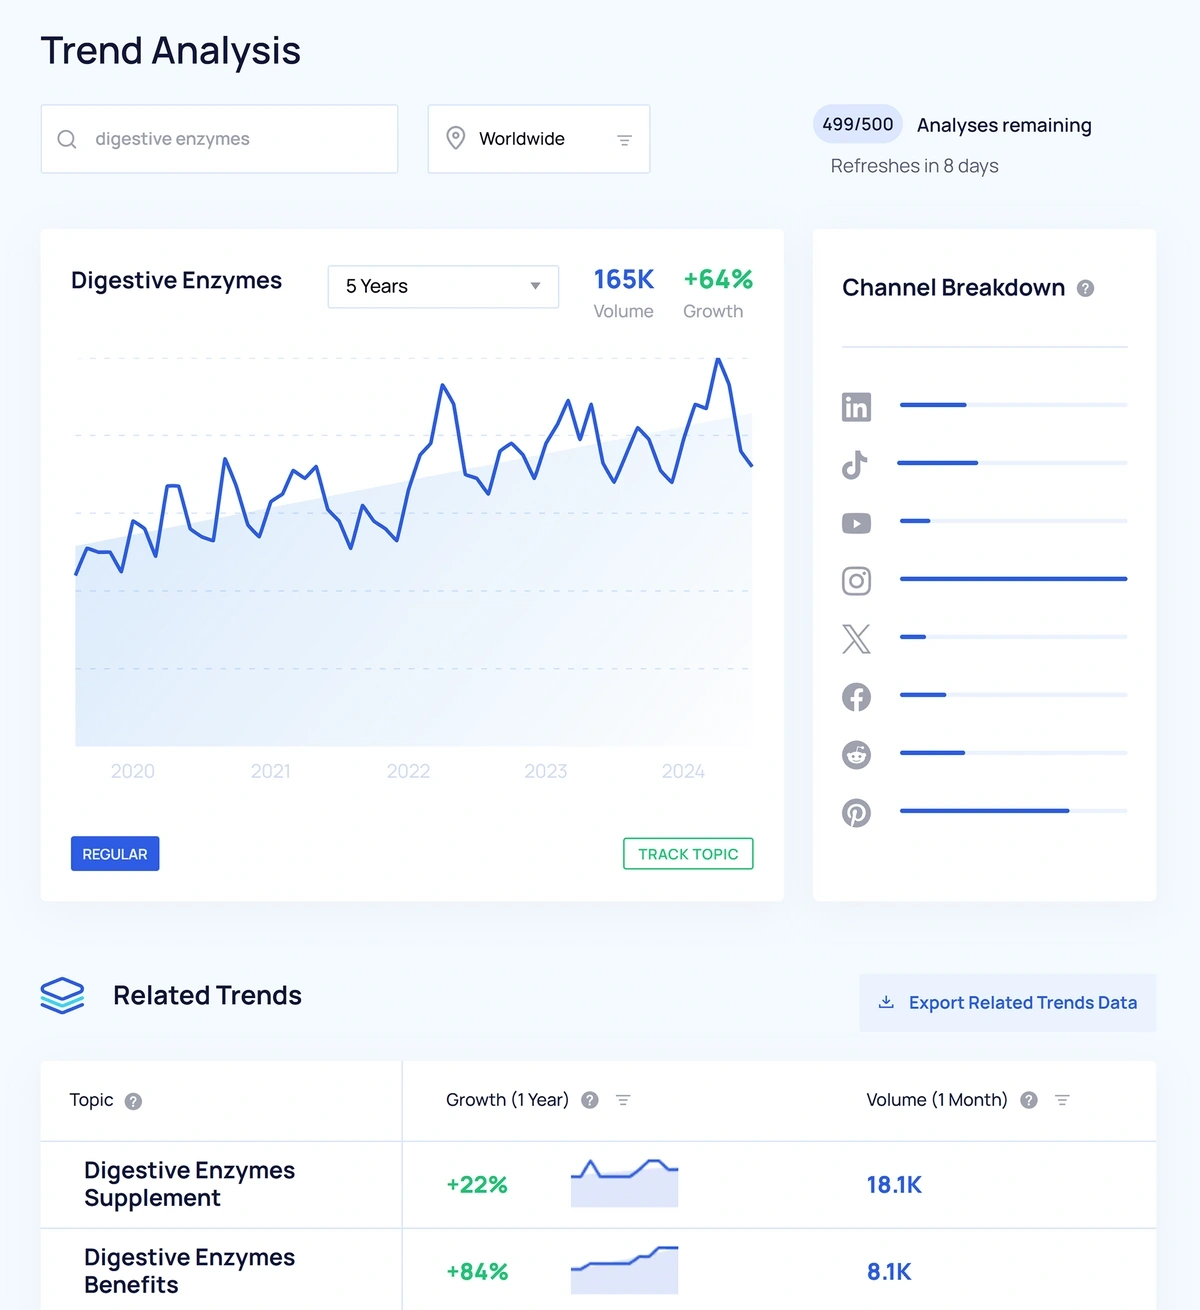
Trend Analysis
You can also access our trend analysis feature to look up products, brand names, and other topics you’ve already heard about (this is similar to Google Trends where you can search by geographic region and look at corresponding trend data).
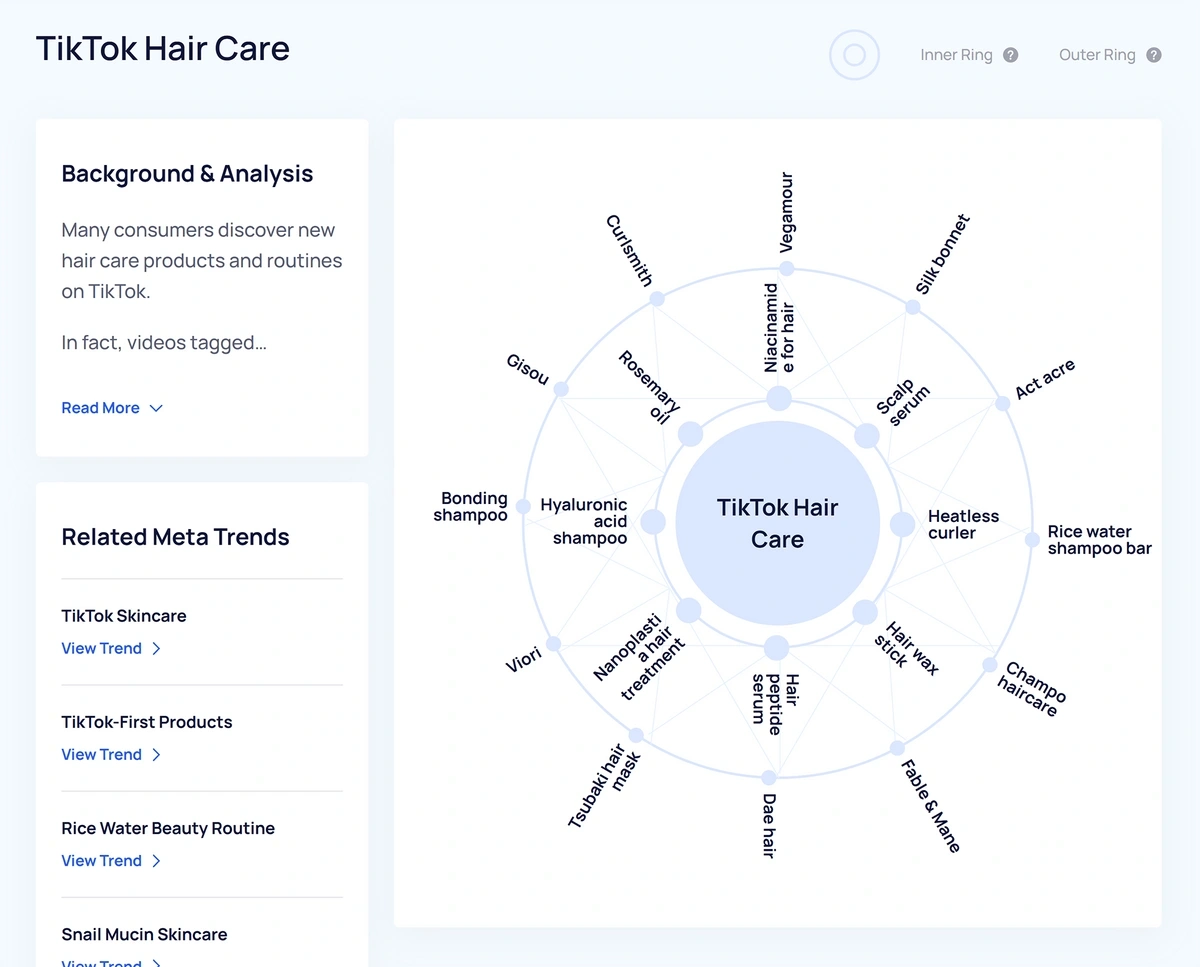
Meta Trends
You can also explore new trends through the Meta Trends library. Meta Trends are groups of trends that all relate to a higher-level concept or idea — so here, you’ll see trends arranged by type of product, technology, or service, such as AI Presentation Makers, Sleep Tech, and TikTok Hair Care, for example.
Within each Meta Trend, you can see:
- Quick background and analysis on the topic, explaining past growth and future expectations.
- A graph of trends that relate to the topic.
- A list of related Meta Trends to continue researching.
Exploding Topics lets you access a host of data through its free tools, but you can also upgrade to the Pro version if you need to increase limits. Paid plans start at $39/month with a 7-day free trial available.
2. Thinknum
Thinknum is an alternative data provider that monitors online businesses (both public and private companies) and what customers are doing on those websites.
Their web scraping AI tracks product inventory, pricing, POS transaction data, retail store locations, customer reviews, employee feedback, and job listing details.
All of this data lets you understand more about company performance and what customers like/dislike about brands they shop with.
Thinknum is an entirely self-serve website with features that let users build out reports with real-time data, identify patterns and outliers across datasets, and monitor company and customer activity into the future.
In addition, the Thinknum team provides weekly reports, case studies, white papers, and webinars so you can access insights and learnings from their expert analysts. You can also use the Thinknum API to consolidate alternative datasets in other traditional data tools you use in your research methods.
While Thinknum provides an array of handy features to understand more about popular brands and consumer behaviors, learning the ins and outs of the platform and how to fully take advantage of features requires some training unless you have a background in this type of data analysis.
For pricing information, you'll need to sign up for the demo and contact Thinknum for pricing based on your needs.
3. Lighthouse
Lighthouse is a short-term rental data provider with insights on major booking companies and over 19 million listings.
They pull data on everything from listing price, to property type, to amenities, and they gather worldwide data so you can look at insights in different geographic regions. It’s a valuable tool for property managers, hotels, DMOs, real estate companies, investors, industry suppliers, and government municipalities.
The features include:
- Rental data dashboard where you can find and analyze listings on an interactive map.
- Analytics tools that let you build out reports and monitor listings/bookings (to increase occupancy, optimize booking rates, and maximize revenue).
- Blog posts with more detailed VR data, curated by the Transparent team.
- Online courses so you can learn more about the data Transparent provides and how to leverage it to guide business decisions and investment opportunities.
- API to aggregate Transparent data in other business reporting tools.
You can demo some of Lighthouse’s online tools for free, but they also have custom plans that are tailored to different industry professionals and their research goals.
We should note — like Thinknum above, Lighthouse has modern and intuitive tools to build out reports and analyze VR data. However, you can expect a slight learning curve as you get to know the platform.
4. Quiver Quantitative
Quiver is a stock research website that’s designed to help non-professional investors understand stock data, accurately predict FinTech trends, and make more data-driven investing decisions.
It’s also used by experienced money managers that want to supplement research methods with alternative data sources.
Quiver Quantitative has user-friendly features that let you break down and more easily interpret big data, but they also provide tutorials on their website that show you how to access data, build reports, and interpret findings. Plus, the Quiver team provides free resources on their blog so you can read analyses from experienced pros.
On Quiver’s stock research website, you can:
- Check the Quiver hourly briefing (updated every hour with the most recent trading activity).
- Learn about popular trading strategies, put together by Quiver data analysts.
- Review alternative data by source (Government; Consumer Interest; SEC Filings; Environment, Social, and Governance) and use advanced filtering options for deeper analysis.
- See which stocks have the highest return each day (Today’s Biggest Gainers) and check stocks that are trending on Quiver.
Quiver is a great resource for both newbies and experienced retail investors because it provides real-time stock market data with easy tools to analyze and understand financial data.
5. InfutorData
InfutorData (formerly Verisk Marketing Solutions) is a customer identity resolution and intelligence platform that provides data on:
- Who customers are — names, addresses, demographic information, lifestyle preferences, and interests.
- Shopping habits and the customer buying journey — how customers find a business, which devices they shop on, and when they make purchases.
- How customers spend their money — which products and services they purchase.
All of this information enables you to learn more about a customer base, which can aid in investment decisions.
It's worth noting that InfutorData states that they safeguards all of this data and consumer privacy through compliant sourcing and responsible data use.
Overall, InfutorData is a pretty robust platform with a variety of software solutions you can choose from to suit your research goals.
6. Dataminr
Dataminr is an alternative data source focused on event and risk detection.
Their proprietary AI scrapes public web data and utilizes alt sources like satellite images and climate data, to detect everything from ransomware attacks and data breaches to natural disasters and severe weather events.
With this data, you can stay ahead of big news before it’s public knowledge and deploy the most effective risk management methods.
In addition to their main offerings, they provide a free “Risk in Real Time” newsletter and resources like blog posts and webinars on their website so you can learn more about what type of insights Dataminr offers.
7. WageScape
WageScape is a popular alt data provider for businesses that want deeper insights into corporate hiring practices.
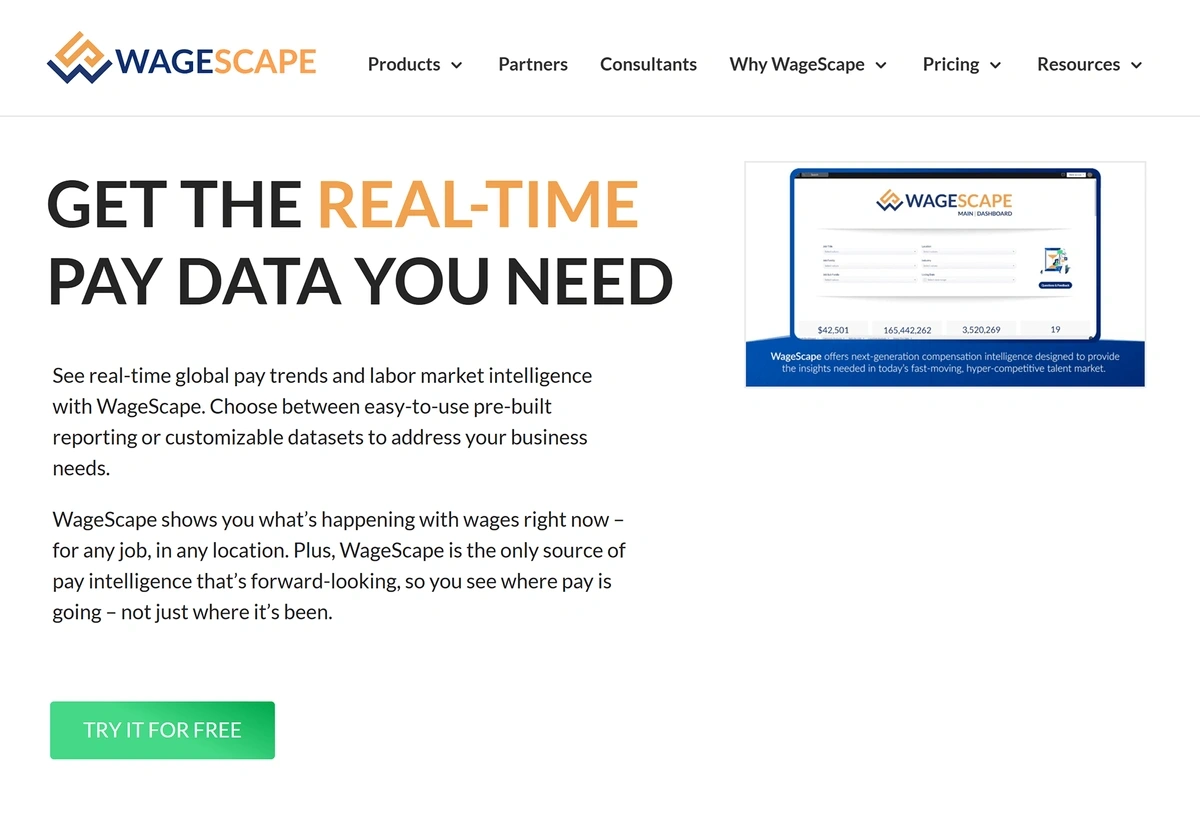
They source insights from standard financial data, as well as public and private business reports. Aside from corporate brands and recruiting firms, WageScape is used by data science teams, consulting firms, and app developers.
Some of the use cases for this product include:
- Business and economic forecasting — identify trending topics and valuable business opportunities, and detect and minimize risks.
- Benchmarking compensation and salary data — understand how to align compensation and benefits with market demand (and where wages are going in the future) and stay competitive when hiring new talent.
- Talent and recruiting — find the right candidates for your employment opportunities and streamline the recruitment process.
- Workforce analytics — stay in the know about competitor recruitment practices, identify ways to attract the best talent, and dig into talent-flow analytics.
Like some of the other names on this list, WageScape is a self-serve product that offers insights via its Data Platform — once you know how to use the software, you can log into the dashboard and dig into insights on your own. However, learning the platform and understanding how to leverage insights can take some training.
8. Flight Aware
Flight Aware is an international flight tracking service.
You can see both public and private planes' flight paths when using the tool—as well as search for routes based on a number of factors like airport or fleet.

For example, you could use Flight Aware to see if jets from a corporate fleet are landing at an airport near their largest competitor's headquarters. This might be a signal of a potential merger or acquisition.
This particular data is most useful for businesses working with airlines, airports, government, travel, and other related entities whose businesses stand to benefit from such data and analysis.
There's no cost to search for individual flights on the FlightAware website. If you want to get alerts about activity on a tracked fleet or route, though, you'll need to purchase a paid plan. Options start at $44.95 per month.
9. Capitol Trades
Capitol Trades monitors investment transactions made by prominent figures in the U.S. government.
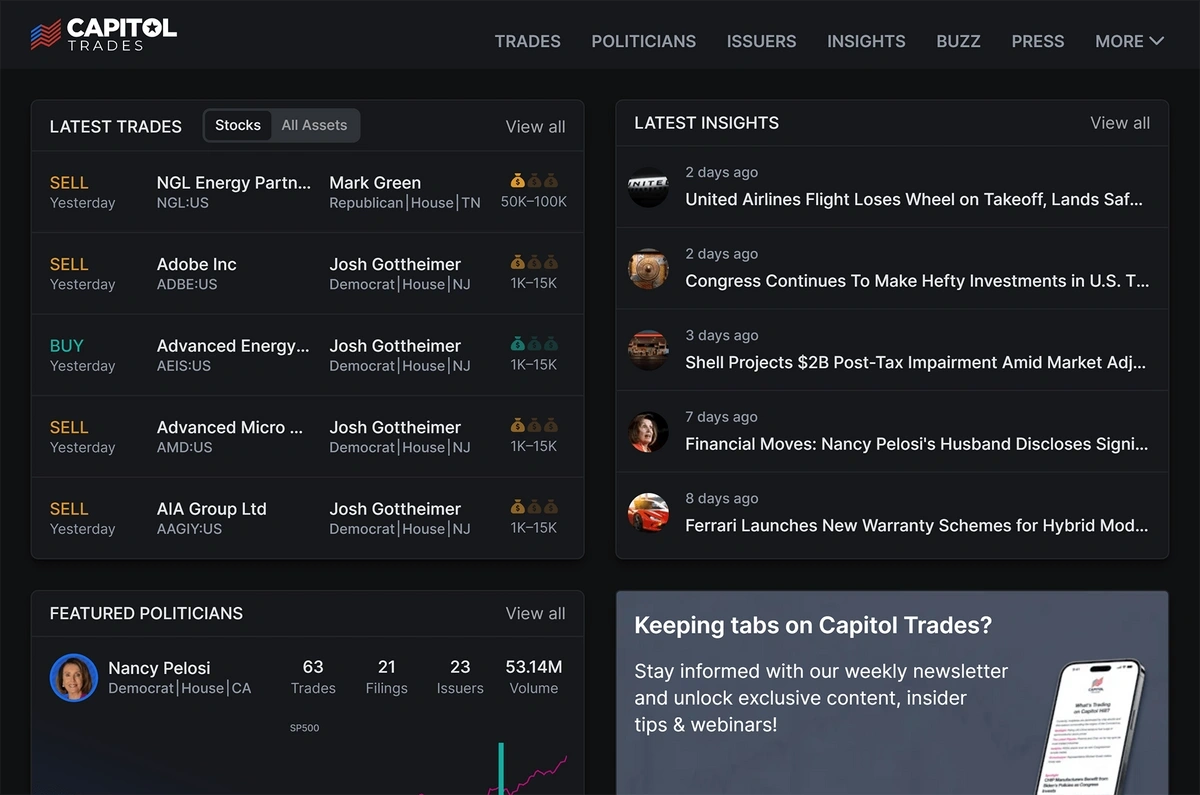
Capitol Trades makes it easy to track a specific politician's activity, too. You can filter the platform's data by a number of variables, including name, political party, and investment sector.
The company also publishes a variety of reports that may be of interest to investors, covering topics like:
- Government regulations
- Cryptocurrency market changes
- Major lawsuits
- Notable political investment activities
- Traditional stock surges
- Corporate partnerships
There is no charge to use Capitol Trades.
10. Umbra
Umbra is a satellite imaging service.
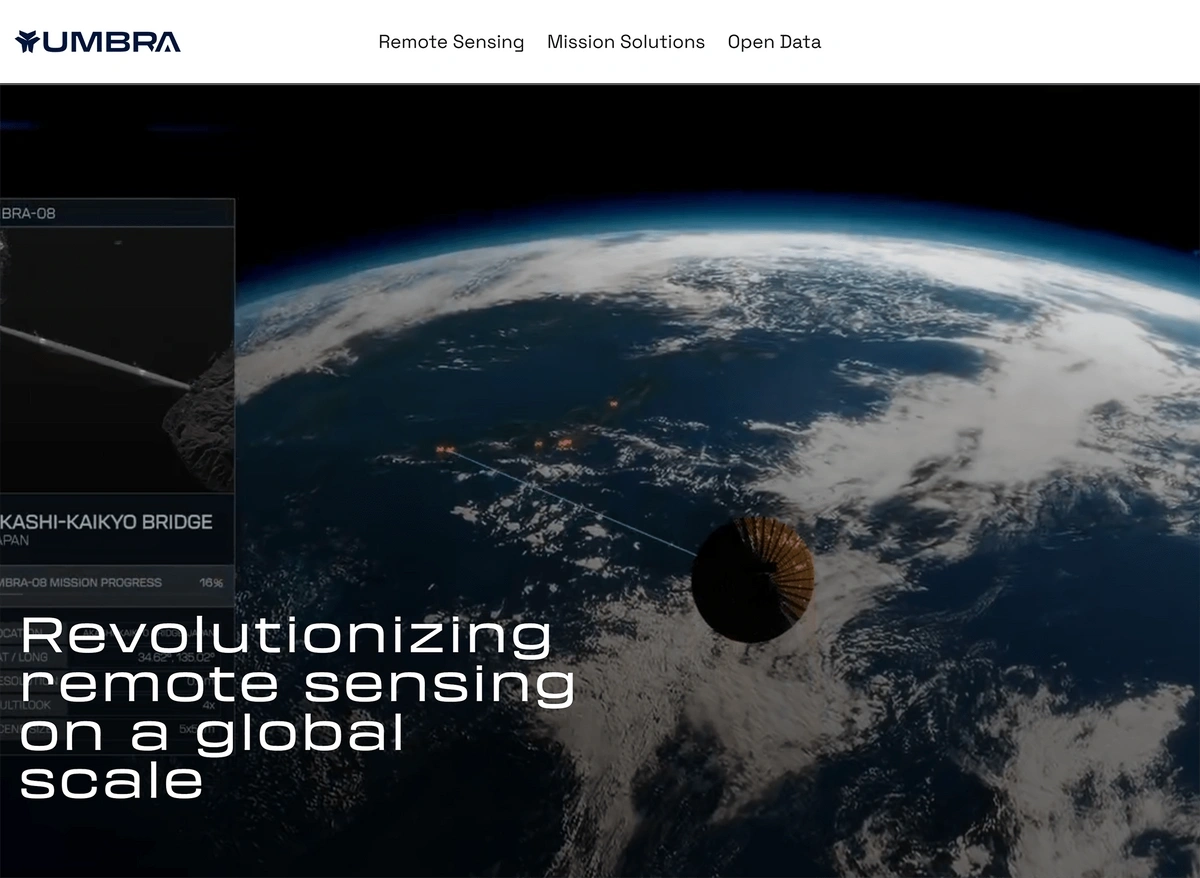
The company's high-resolution satellites deliver clear pictures of specific locations—even if the weather is bad.
You can use satellite imagery as alternative data in a variety of ways, including:
- Tracking the path of or progress on oil and gas pipelines
- Evaluating shipping routes used by potential investment targets
- Monitoring activity in volatile areas
- Watching traffic in and out of consumer shopping centers
All of Umbra's images cover a four-meter square area and are available in four resolutions.
Umbra access is priced per image using an open pricing system. Costs range between $675 and $5,650 depending on satellite dwell time—which impacts clarity—and image resolution.
Conclusion
Alternative data is a useful tool in your investment research workflow, whether you're part of a hedge fund, evaluating startups for investment potential, or interested in expanding a personal portfolio.
To learn more, check out our complete guide to using alternative data for investment decisions and our list of alternative data examples and use cases.
Stop Guessing, Start Growing 🚀
Use real-time topic data to create content that resonates and brings results.

Exploding Topics is owned by Semrush. Our mission is to provide accurate data and expert insights on emerging trends. Unless otherwise noted, this page’s content was written by either an employee or a paid contractor of Semrush Inc.
Share
Newsletter Signup
By clicking “Subscribe” you agree to Semrush Privacy Policy and consent to Semrush using your contact data for newsletter purposes
Written By


Josh is the Co-Founder and CTO of Exploding Topics. Josh has led Exploding Topics product development from the first line of co... Read more