


Get Advanced Insights on Any Topic
Discover Trends 12+ Months Before Everyone Else
How We Find Trends Before They Take Off
Exploding Topics’ advanced algorithm monitors millions of unstructured data points to spot trends early on.

Keyword Research
Performance Tracking
Competitor Intelligence
Fix Your Site’s SEO Issues in 30 Seconds
Find technical issues blocking search visibility. Get prioritized, actionable fixes in seconds.
Powered by data from
Latest Blog Posts
Featured Case Studies
See what's trending before everyone else
Each week, we'll send you our best Exploding Topics. Plus, expert insight and analysis.
The Latest PC Gaming Statistics (2025)

With over 3 billion gamers worldwide, it is no surprise that the PC gaming market continues to go from strength to strength.
Below, we’ll dive into the latest data surrounding PC gaming and other relevant statistics:
Contents
- Top PC Gaming Statistics 2025 (Editor’s Picks)
- How Many PC Gamers Are There?
- Games-As-A-Service And Pay-To-Play Stats
- PC Vs Other Platforms
- PC Gaming Market And Revenue Stats
- Gaming PC Software & Hardware Stats
Top PC Gaming Statistics 2025 (Editor’s Picks)
- Globally, there are around 1.86 billion PC gamers
- 64% of game developers have a preference for PC titles
- F2P PC games market revenue is estimated to be $25.22 billion in 2024
- The gaming PC graphics hardware market is worth approximately $38 billion
How Many PC Gamers Are There?
According to the latest available data, there are an estimated 1.86 billion PC gamers worldwide.
Source: DFC Intelligence
Number of PC Gamers Over Time
Between 2008 and 2018, the number of global PC gamers rose by 41.27%.
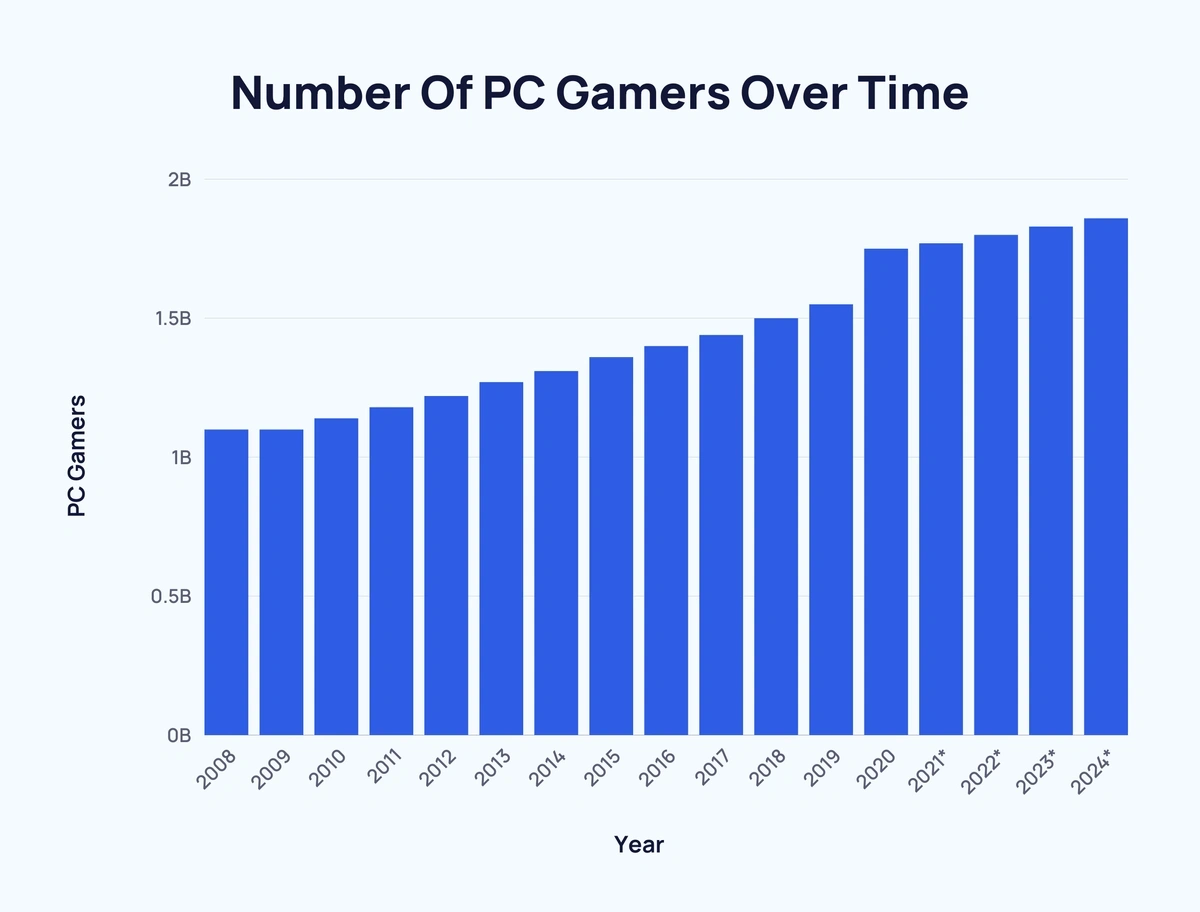
Here’s a breakdown of the number of PC gamers since 2008:
|
Year |
PC Gamers |
Change Over Previous Year |
Change Over Previous Year (%) |
|
2008 |
1.1 billion |
- |
- |
|
2009 |
1.1 billion |
- |
- |
|
2010 |
1.14 billion |
↑ 40 million |
↑ 3.6% |
|
2011 |
1.18 billion |
↑ 40 million |
↑ 3.5% |
|
2012 |
1.22 billion |
↑ 40 million |
↑ 3.4% |
|
2013 |
1.27 billion |
↑ 50 million |
↑ 4.1% |
|
2014 |
1.31 billion |
↑ 40 million |
↑ 3.1% |
|
2015 |
1.36 billion |
↑ 50 million |
↑ 3.8% |
|
2016 |
1.4 billion |
↑ 40 million |
↑ 2.9% |
|
2017 |
1.44 billion |
↑ 40 million |
↑ 2.9% |
|
2018 |
1.5 billion |
↑ 60 million |
↑ 4.1% |
|
2019 |
1.55 billion |
↑ 50 million |
↑ 3.3% |
|
2020 |
1.75 billion |
↑ 200 million |
↑ 12.9% |
|
2021* |
1.77 billion |
↑ 20 million |
↑ 1.1% |
|
2022* |
1.8 billion |
↑ 30 million |
↑ 1.7% |
|
2023* |
1.83 billion |
↑ 30 million |
↑ 1.7% |
|
2024* |
1.86 billion |
↑ 30 million |
↑ 1.6% |
*Predicted figures.
Source: DFC Intelligence
Games-as-a-Service and Pay-to-Play Stats
There are several ways in which gamers can access PC titles aside from one-time purchases.
Games-as-a-Service (GaaS) PC Gaming
One such method is the continuing revenue model known as GaaS. This model was first popularised by hugely lucrative titles such as RuneScape (2001) and World of Warcraft (2004).
In 2024, an estimated 1.8 billion gamers opted for low-end GaaS PC gaming. That’s an increase of around 800 million since 2008.

The premium GaaS category has the next-highest number of participants with approximately 381.4 million people.
Pay-to-Play PC Gaming
Increasingly popular pay-to-play PC games have also seen significant growth in recent years.
Low-end pay-to-play PC games have gained over 100 million players since 2008, reaching 297.6 million this year.
Likewise, premium pay-to-play gaming has seen an increase of almost 80 million players since 2008 (179.5 million in 2024).
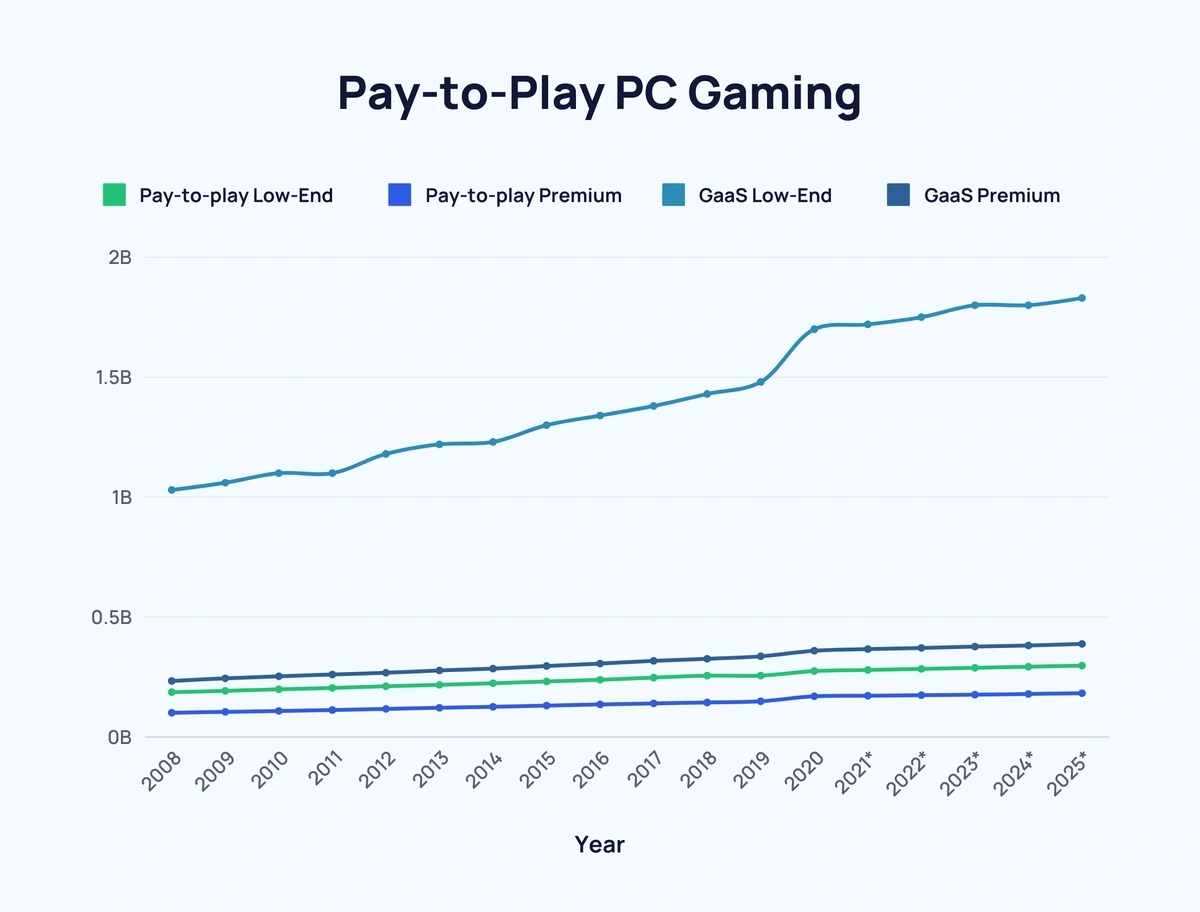
Here’s a breakdown of the most popular PC gaming categories since 2008:
|
Year |
Pay-to-play Low-End |
Pay-to-play Premium |
GaaS Low-End |
GaaS Premium |
|
2008 |
186.8 million |
101 million |
1.03 billion |
233.6 million |
|
2009 |
192.5 million |
104.7 million |
1.06 billion |
244.6 million |
|
2010 |
199 million |
108.5 million |
1.1 billion |
253.1 million |
|
2011 |
204.6 million |
112.4 million |
1.1 billion |
260.5 million |
|
2012 |
211.3 million |
117.1 million |
1.18 billion |
267.8 million |
|
2013 |
217.4 million |
121.9 million |
1.22 billion |
277.3 million |
|
2014 |
224.2 million |
126 million |
1.23 billion |
285 million |
|
2015 |
231.7 million |
131 million |
1.3 billion |
295.9 million |
|
2016 |
238.6 million |
135.7 million |
1.34 billion |
306.2 million |
|
2017 |
247.5 million |
140.1 million |
1.38 billion |
317.5 million |
|
2018 |
255.8 million |
143.9 million |
1.43 billion |
326.2 million |
|
2019 |
255.9 million |
148.9 million |
1.48 billion |
336.3 million |
|
2020 |
275 million |
169.8 million |
1.7 billion |
359.6 million |
|
2021* |
279.4 million |
172.1 million |
1.72 billion |
366.5 million |
|
2022* |
283.8 million |
174.3 million |
1.75 billion |
371.2 million |
|
2023* |
288.6 million |
176.5 million |
1.8 billion |
376.9 million |
|
2024* |
292.9 million |
179.5 million |
1.8 billion |
381.4 million |
|
2025* |
297.6 million |
182.7 million |
1.83 billion |
388.2 million |
*Predicted figures.
Source: DFC Intelligence
PC vs Other Platforms
Overall, game developers have a clear preference for PC as a platform.
A 2023 survey found that around 2 in 3 (65%) game developers were currently working on a PC game.
Want to Spy on Your Competition?
Explore competitors’ website traffic stats, discover growth points, and expand your market share.
By comparison, the two most popular game consoles had approximately half as many game developers working on titles for those platforms in 2023.
Around 1 in 3 (33%) of developers were working on a PlayStation 5 game. While 3 in 10 (30%) were working on an Xbox Series X/S title.
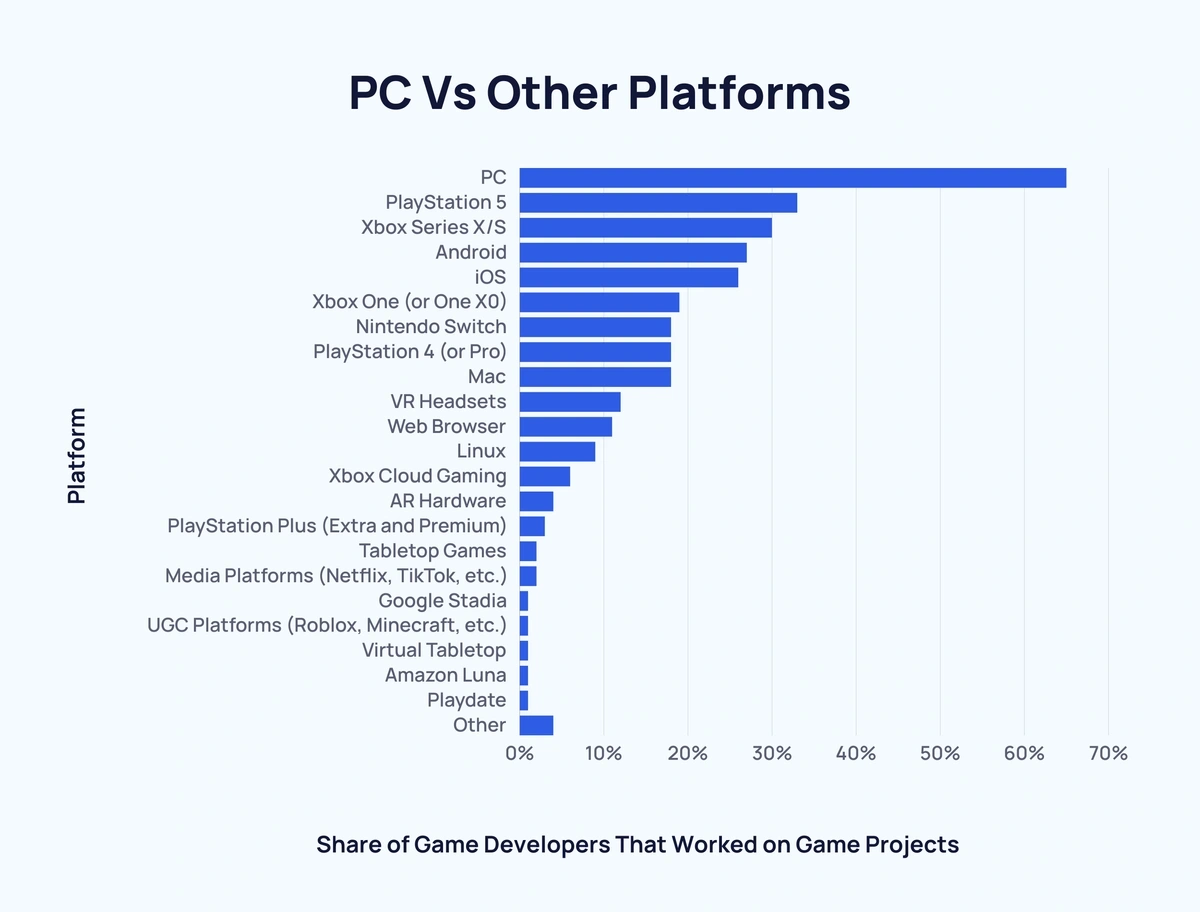
Here’s a full breakdown of the platforms game developers were focussing on in 2023:
| Rank | Platform | Share of Game Developers That Worked on Game Projects |
| 1 | PC | 65% |
| 2 | PlayStation 5 | 33% |
| 3 | Xbox Series X/S | 30% |
| 4 | Android | 27% |
| 5 | iOS | 26% |
| 6 | Xbox One (or One X0) | 19% |
| =7 | Nintendo Switch | 18% |
| =7 | PlayStation 4 (or Pro) | 18% |
| =7 | Mac | 18% |
| 10 | VR Headsets | 12% |
| 11 | Web Browser | 11% |
| 12 | Linux | 9% |
| 13 | Xbox Cloud Gaming | 6% |
| 14 | AR Hardware | 4% |
| 15 | PlayStation Plus (Extra and Premium) | 3% |
| =16 | Tabletop Games | 2% |
| =16 | Media Platforms (Netflix, TikTok, etc.) | 2% |
| =18 | Google Stadia | 1% |
| =18 | UGC Platforms (Roblox, Minecraft, etc.) | 1% |
| =18 | Virtual Tabletop | 1% |
| =18 | Amazon Luna | 1% |
| =18 | Playdate | 1% |
| - | Other | 4% |
The number of major PC video games released/planned for release between late 2022 and the end of 2024 backs up the above figures.
Once again, PC leads the way with a total of 156 releases. That’s at least 35% more than the PlayStation 5 (115) or the Xbox Series X/S (113).
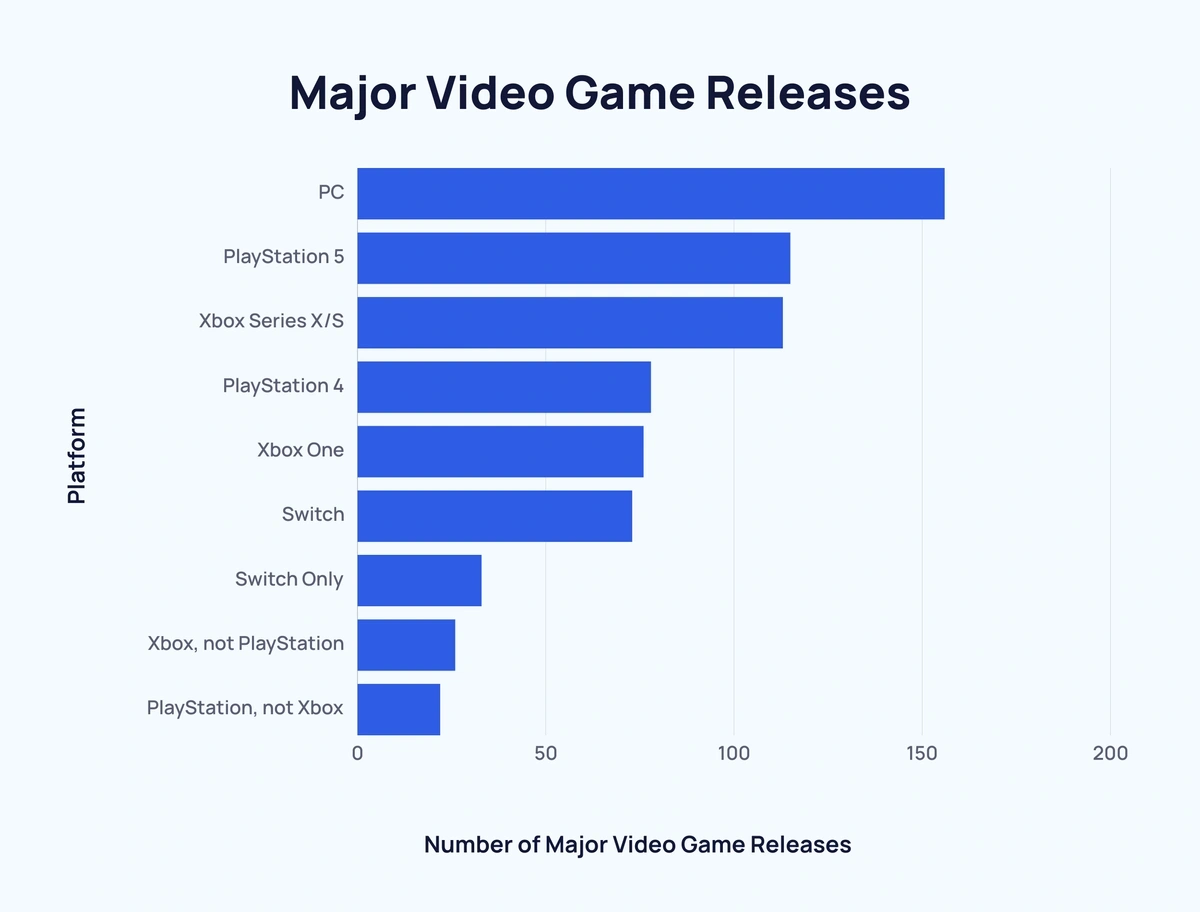
Here’s a closer look at the most popular gaming platforms in terms of major game releases:
| Rank | Platform | Number of Major Video Game Releases |
| 1 | PC | 156 |
| 2 | PlayStation 5 | 115 |
| 3 | Xbox Series X/S | 113 |
| 4 | PlayStation 4 | 78 |
| 5 | Xbox One | 76 |
| 6 | Switch | 73 |
| 7 | Switch Only | 33 |
| 8 | Xbox, not PlayStation | 26 |
| 9 | PlayStation, not Xbox | 22 |
And when it comes to personal preference, game developers also opt for PC as their platform of choice.
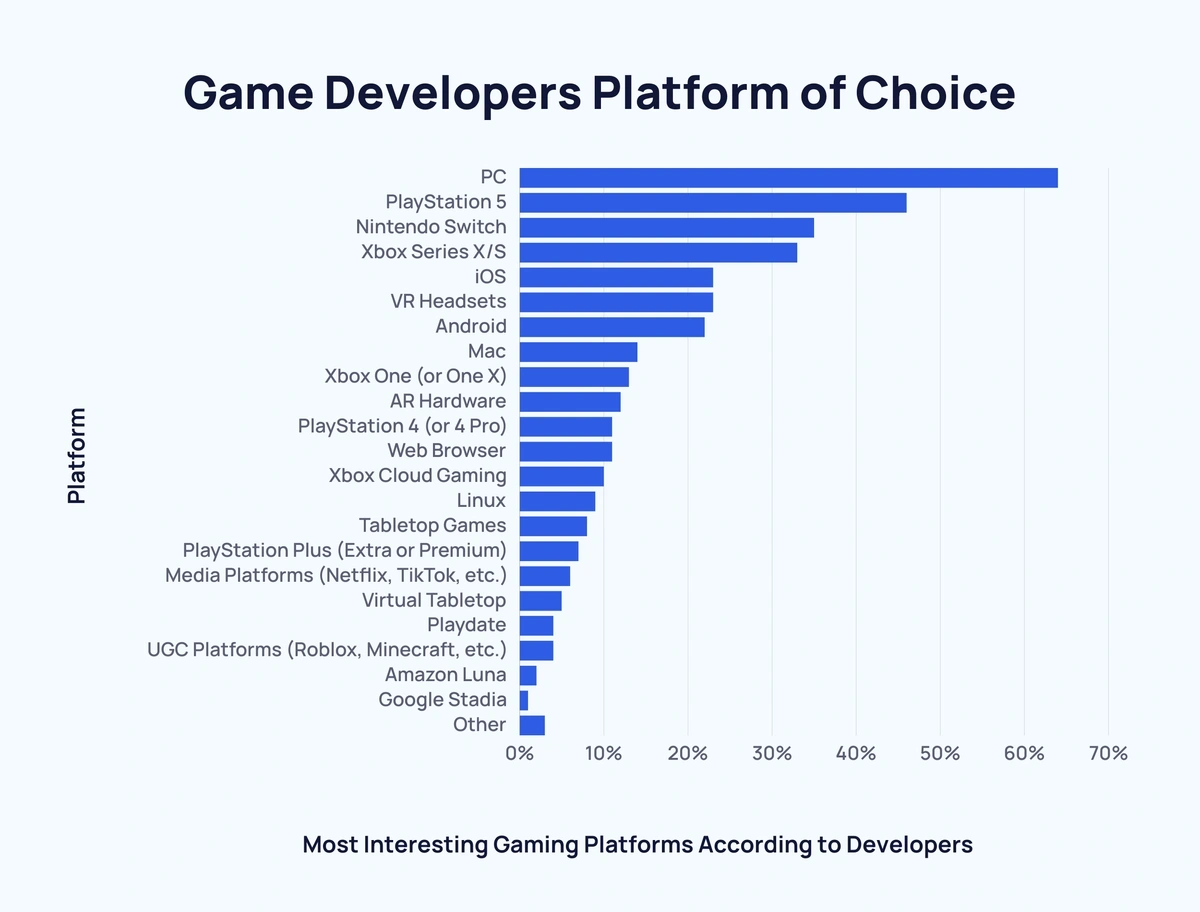
Here’s a full list of gaming platforms ranked in order of preference by game developers:
| Rank | Platform | Most Interesting Gaming Platforms According to Developers |
| 1 | PC | 64% |
| 2 | PlayStation 5 | 46% |
| 3 | Nintendo Switch | 35% |
| 4 | Xbox Series X/S | 33% |
| =5 | iOS | 23% |
| =5 | VR Headsets | 23% |
| 7 | Android | 22% |
| 8 | Mac | 14% |
| 9 | Xbox One (or One X) | 13% |
| 10 | AR Hardware | 12% |
| =11 | PlayStation 4 (or 4 Pro) | 11% |
| =11 | Web Browser | 11% |
| 13 | Xbox Cloud Gaming | 10% |
| 14 | Linux | 9% |
| 15 | Tabletop Games | 8% |
| 16 | PlayStation Plus (Extra or Premium) | 7% |
| 17 | Media Platforms (Netflix, TikTok, etc.) | 6% |
| 18 | Virtual Tabletop | 5% |
| =19 | Playdate | 4% |
| =19 | UGC Platforms (Roblox, Minecraft, etc.) | 4% |
| 20 | Amazon Luna | 2% |
| 21 | Google Stadia | 1% |
| - | Other | 3% |
Sources: Game Developers Conference, DFC Intelligence, Game Developers Conference (2)
PC Gaming Market and Revenue Stats
The free-to-play (F2P) PC gaming market has seen its revenue grow year-over-year since 2018.
Build a winning strategy
Get a complete view of your competitors to anticipate trends and lead your market
Annual market revenue for F2P PC games was projected to hit $25.22 billion in 2024.
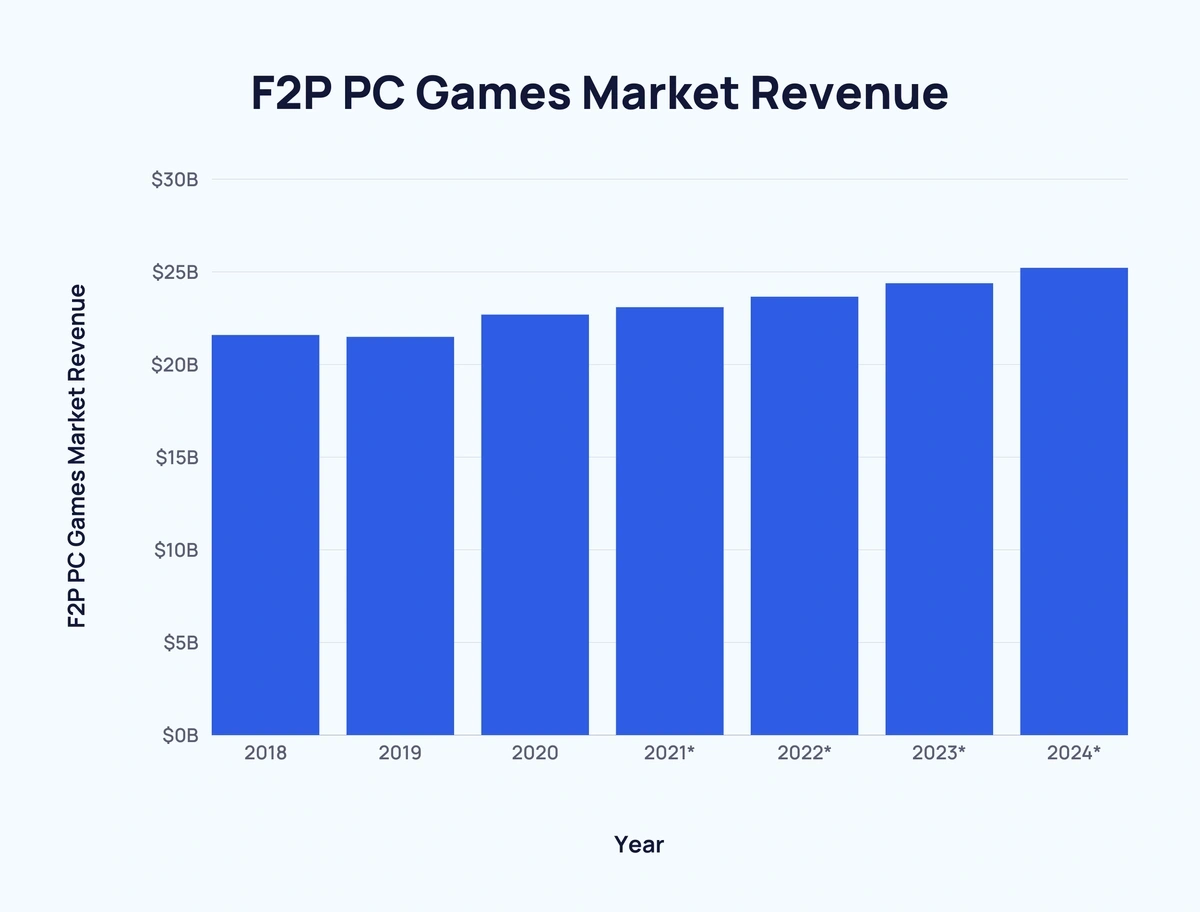
Below, is a breakdown of F2P PC games market revenue over time:
|
Year |
F2P PC Games Market Revenue |
|
2018 |
$21.6 billion |
|
2019 |
$21.5 billion |
|
2020 |
$22.7 billion |
|
2021* |
$23.1 billion |
|
2022* |
$23.66 billion |
|
2023* |
$24.39 billion |
|
2024* |
$25.22 billion |
*Predicted figures.
Similarly, premium PC games revenue continues to increase, climbing from $5.38 billion in 2008 to an estimated $26.33 billion in 2024.
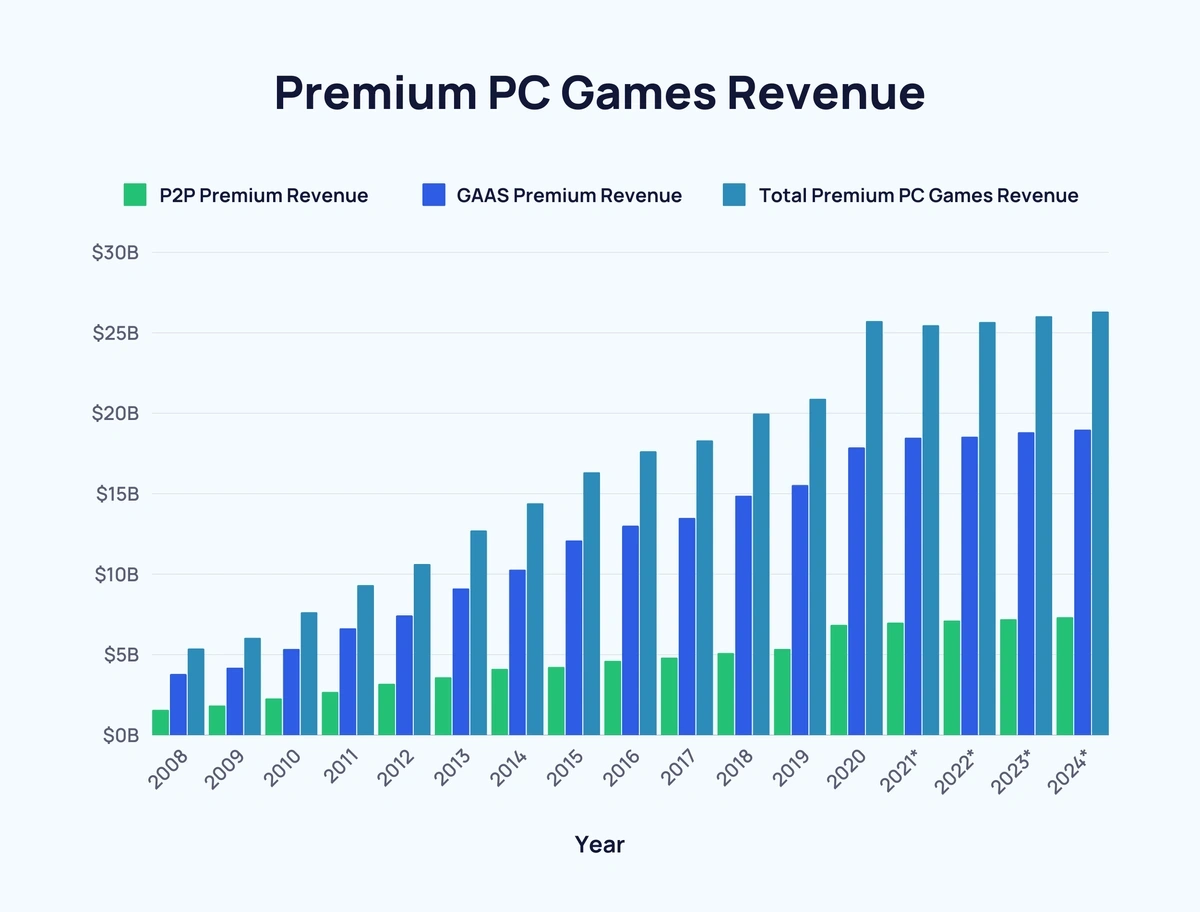
Here’s a breakdown of revenue from the premium PC gaming market over time:
|
Year |
P2P Premium Revenue |
GAAS Premium Revenue |
Total Premium PC Games Revenue |
|
2008 |
$1.58 billion |
$3.8 billion |
$5.38 billion |
|
2009 |
$1.85 billion |
$4.2 billion |
$6.05 billion |
|
2010 |
$2.28 billion |
$5.36 billion |
$7.64 billion |
|
2011 |
$2.69 billion |
$6.64 billion |
$9.33 billion |
|
2012 |
$3.2 billion |
$7.44 billion |
$10.64 billion |
|
2013 |
$3.6 billion |
$9.12 billion |
$12.72 billion |
|
2014 |
$4.12 billion |
$10.29 billion |
$14.41 billion |
|
2015 |
$4.24 billion |
$12.1 billion |
$16.34 billion |
|
2016 |
$4.62 billion |
$13.02 billion |
$17.64 billion |
|
2017 |
$4.82 billion |
$13.5 billion |
$18.32 billion |
|
2018 |
$5.11 billion |
$14.88 billion |
$19.99 billion |
|
2019 |
$5.36 billion |
$15.55 billion |
$20.91 billion |
|
2020 |
$6.86 billion |
$17.88 billion |
$25.74 billion |
|
2021* |
$6.99 billion |
$18.49 billion |
$25.48 billion |
|
2022* |
$7.13 billion |
$18.55 billion |
$25.68 billion |
|
2023* |
$7.21 billion |
$18.83 billion |
$26.04 billion |
|
2024* |
$7.34 billion |
$18.99 billion |
$26.33 billion |
*Predicted figures.
Since 2011, the online PC gaming market has grown from $21.1 billion to an estimated $41.6 billion – an increase of around 98.1%.
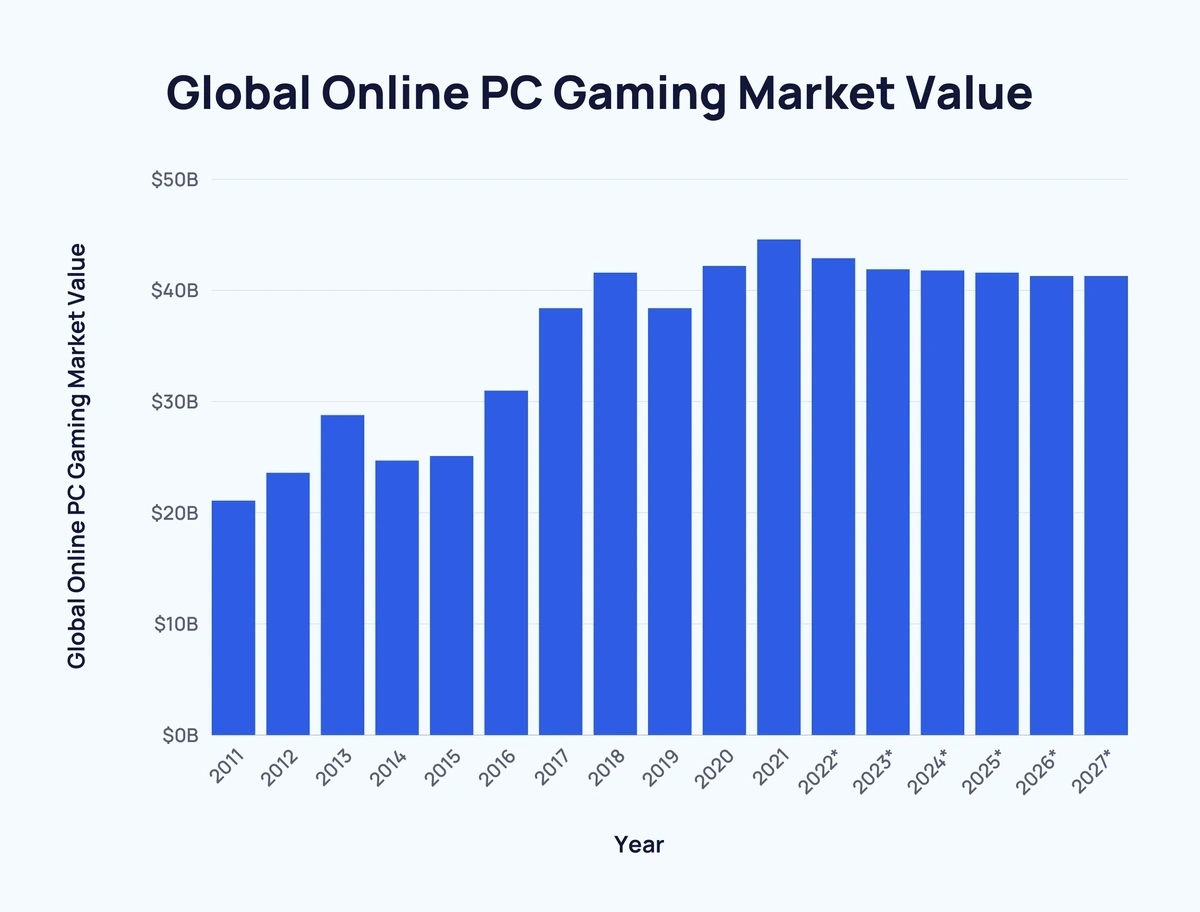
Here are the detailed figures:
|
Year |
Global Online PC Gaming Market Value |
Change Over Previous Year |
|
2011 |
$21.1 billion |
- |
|
2012 |
$23.6 billion |
↑ $2.5 billion |
|
2013 |
$28.8 billion |
↑ $5.2 billion |
|
2014 |
$24.7 billion |
↓ $4.1 billion |
|
2015 |
$25.1 billion |
↑ $0.4 billion |
|
2016 |
$31 billion |
↑ $5.9 billion |
|
2017 |
$38.4 billion |
↑ $7.4 billion |
|
2018 |
$41.6 billion |
↑ $3.2 billion |
|
2019 |
$38.4 billion |
↓ $3.2 billion |
|
2020 |
$42.2 billion |
↑ $3.8 billion |
|
2021 |
$44.6 billion |
↑ $2.4 billion |
|
2022* |
$42.9 billion |
↓ $1.7 billion |
|
2023* |
$41.9 billion |
↓ $1 billion |
|
2024* |
$41.8 billion |
↓ $0.1 billion |
|
2025* |
$41.6 billion |
↓ $0.2 billion |
|
2026* |
$41.3 billion |
↓ $0.3 billion |
|
2027* |
$41.3 billion |
- |
*Predicted figures.
Sources: SuperData Research, DFC Intelligence, Capcom
Gaming PC Software & Hardware Stats
In the space of a decade, the gaming PC graphics hardware market has doubled in value.
In 2012, the market was worth $18.37 billion. By 2022, that figure had more than doubled to an estimated $37 billion.
As of 2024, the graphics hardware market for gaming PC graphics stands at approximately $38 billion.
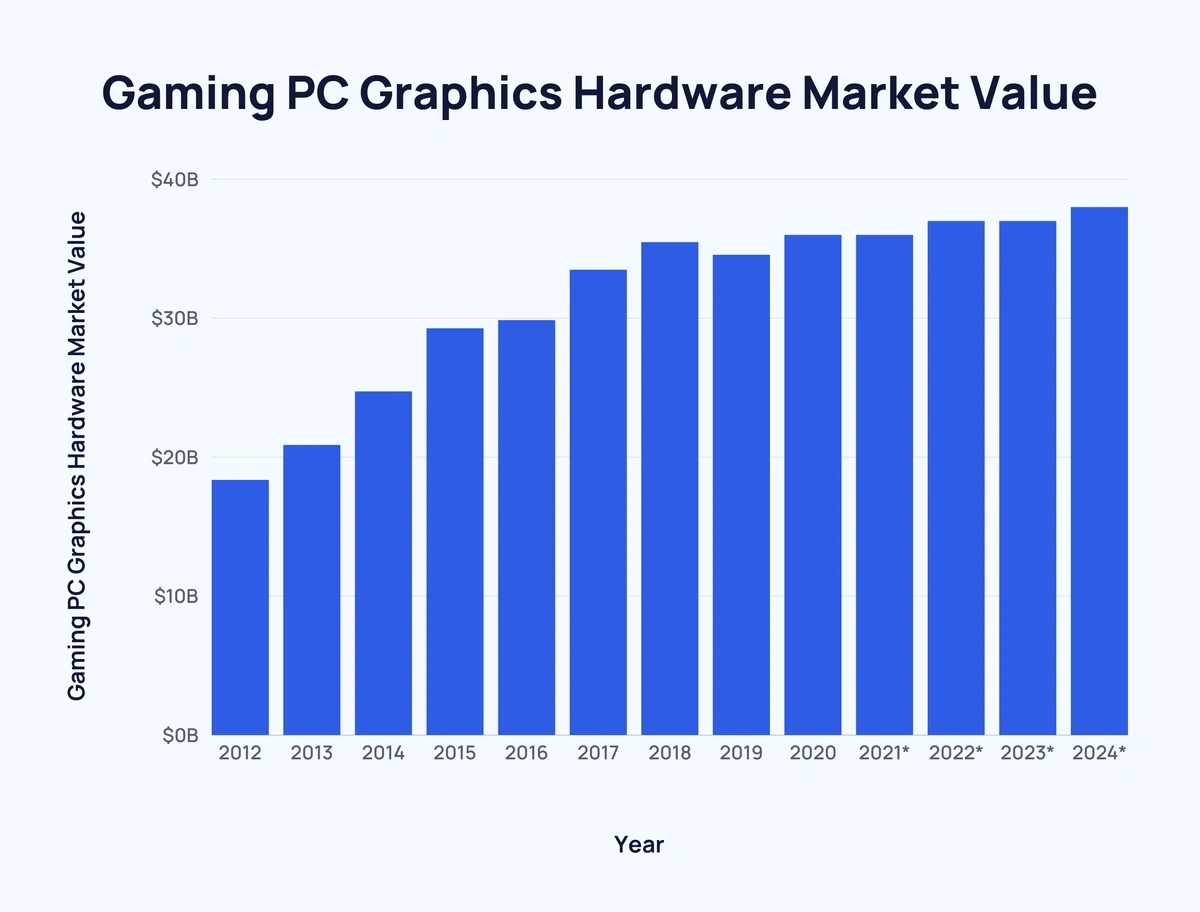
Here’s a breakdown of the gaming PC graphics hardware market since 2012:
|
Year |
Gaming PC Graphics Hardware Market Value |
Change Over Previous Year |
|
2012 |
$18.37 billion |
- |
|
2013 |
$20.88 billion |
↑ $2.51 billion |
|
2014 |
$24.74 billion |
↑ $3.86 billion |
|
2015 |
$29.27 billion |
↑ $4.53 billion |
|
2016 |
$29.87 billion |
↑ $0.6 billion |
|
2017 |
$33.5 billion |
↑ $3.63 billion |
|
2018 |
$35.48 billion |
↑ $1.98 billion |
|
2019 |
$34.57 billion |
↓ $0.91 billion |
|
2020 |
$36 billion |
↑ $1.43 billion |
|
2021* |
$36 billion |
- |
|
2022* |
$37 billion |
↑ $1 billion |
|
2023* |
$37 billion |
- |
|
2024* |
$38 billion |
↑ $1 billion |
*Predicted figures.
Gaming PC graphics software sales revenue has also seen a steady rise for over a decade.
In fact, sales revenue has increased by almost 4x since 2008 ($9.29 billion), reaching an estimated $39.45 billion in 2025.
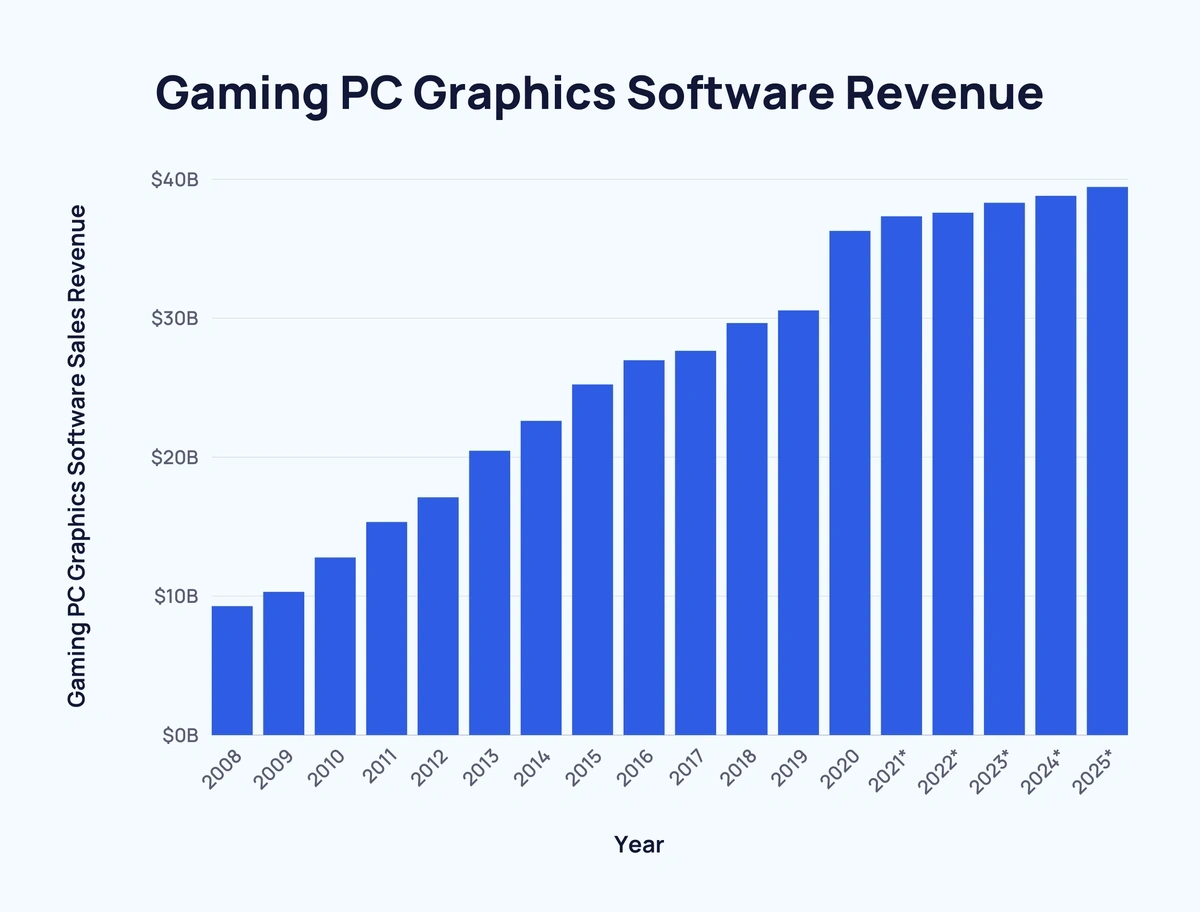
Here’s a look at how sales revenue from gaming PC graphics software has progressed over time:
|
Year |
Gaming PC Graphics Software Sales Revenue |
Change Over Previous Year |
|
2008 |
$9.29 billion |
- |
|
2009 |
$10.31 billion |
↑ $1.02 billion |
|
2010 |
$12.79 billion |
↑ $2.48 billion |
|
2011 |
$15.34 billion |
↑ $2.55 billion |
|
2012 |
$17.11 billion |
↑ $1.77 billion |
|
2013 |
$20.46 billion |
↑ $3.35 billion |
|
2014 |
$22.62 billion |
↑ $2.16 billion |
|
2015 |
$25.24 billion |
↑ $2.62 billion |
|
2016 |
$26.98 billion |
↑ $1.74 billion |
|
2017 |
$27.66 billion |
↑ $0.68 billion |
|
2018 |
$29.65 billion |
↑ $1.99 billion |
|
2019 |
$30.57 billion |
↑ $ 0.92 billion |
|
2020 |
$36.28 billion |
↑ $ 5.71 billion |
|
2021* |
$37.34 billion |
↑ $ 1.06 billion |
|
2022* |
$37.59 billion |
↑ $ 0.25 billion |
|
2023* |
$38.31 billion |
↑ $ 0.72 billion |
|
2024* |
$38.81 billion |
↑ $ 0.5 billion |
|
2025* |
$39.45 billion |
↑ $ 0.64 billion |
*Predicted figures.
Sources: Jon Peddie Research, DFC Intelligence
Key Takeaways
The PC gaming market is booming.
And interest from game developers suggests that it will continue to do so in the foreseeable future.
If you found these stats interesting, take a look at some of our other related content: Amazing Video Game Industry Statistics, How Many Gamers Are There?, and Huge Gaming Industry Trends.
Stop Guessing, Start Growing 🚀
Use real-time topic data to create content that resonates and brings results.

Exploding Topics is owned by Semrush. Our mission is to provide accurate data and expert insights on emerging trends. Unless otherwise noted, this page’s content was written by either an employee or a paid contractor of Semrush Inc.
Share
Newsletter Signup
By clicking “Subscribe” you agree to Semrush Privacy Policy and consent to Semrush using your contact data for newsletter purposes
Written By


Fabio is a research associate at Exploding Topics. Since 2021, Fabio has researched, written, and edited articles for the Explo... Read more