
Average Time Spent on TikTok Statistics (2026)

Since launching in 2016, TikTok has become a juggernaut in the social media landscape.
In 2026, TikTok sees over 2 billion users flock to the platform every month.
With that in mind, we’ll explore the latest TikTok screen time data below.
Average Time Spent on TikTok Statistics (Editor’s Picks)
- Users spend an average of 1 hour and 37 minutes on TikTok each day.
- In 2019, the average daily time spent on TikTok was just 27 minutes.
- Average daily time on TikTok is more than 3x higher than daily time spent on X.
- US users spend 20-25% more time on TikTok than the global average.
- 21% of US teenagers are on TikTok "almost constantly".
How Much Time Do People Spend on TikTok?
The average user spends 1 hour and 37 minutes on TikTok each day.
That equates to approximately 10% of the average person’s waking hours.
As of December 2025, the average time spent on TikTok per visit is 12 minutes 33 seconds. That means, on average, people use TikTok approximately 8 times each day.
Sources: Data Reportal (Digital 2026), Bureau of Labor Statistics, Semrush
TikTok Screen Time Changes Over Time
The average time spent on TikTok has regularly increased year-over-year during the last half-decade.
In 2019, the average user spent 27 minutes and 24 seconds on TikTok.

As of 2025, that figure has more than tripled, reaching over an hour and a half.
Here’s a breakdown of the average daily time spent on TikTok since 2019:
| Year | Average Daily Time Spent on TikTok | Change Over Previous Year |
| 2019 | 27 minutes, 24 seconds | - |
| 2020 | 38 minutes, 36 seconds | ↑ 11 minutes, 12 seconds |
| 2021 | 45 minutes, 18 seconds | ↑ 6 minutes, 42 seconds |
| 2022 | 52 minutes | ↑ 6 minutes, 42 seconds |
| 2023 | 55 minutes, 48 seconds | ↑ 3 minutes, 48 seconds |
| 2024 | 58 minutes, 24 seconds | ↑ 3 minutes, 36 seconds |
| 2025 | 1 hour, 37 minutes | ↑ 38 minutes, 36 seconds* |
(*The latest data comes from Data Reportal's Digital 2026 figures. It does not necessarily represent an actual leap of 38+ minutes, with a new data source used in the latest report.)
Along with the daily time spent on the platform, TikTok's traffic has also increased significantly since 2019. However, it did decrease for the first time in 2025.
| Year | Total Visits | Change Over Previous Year |
| 2019 | 695.7 million | - |
| 2020 | 2.0 billion | ↑ 187.46% |
| 2021 | 12.4 billion | ↑ 520.00% |
| 2022 | 14.7 billion | ↑ 18.55% |
| 2023 | 24.6 billion | ↑ 67.35% |
| 2024 | 26.2 billion | ↑ 6.50% |
| 2025 | 24.6 billion | ↓ 6.1% |
Source: Data Reportal, Semrush
Time Spent Using TikTok vs. Other Social Media Platforms
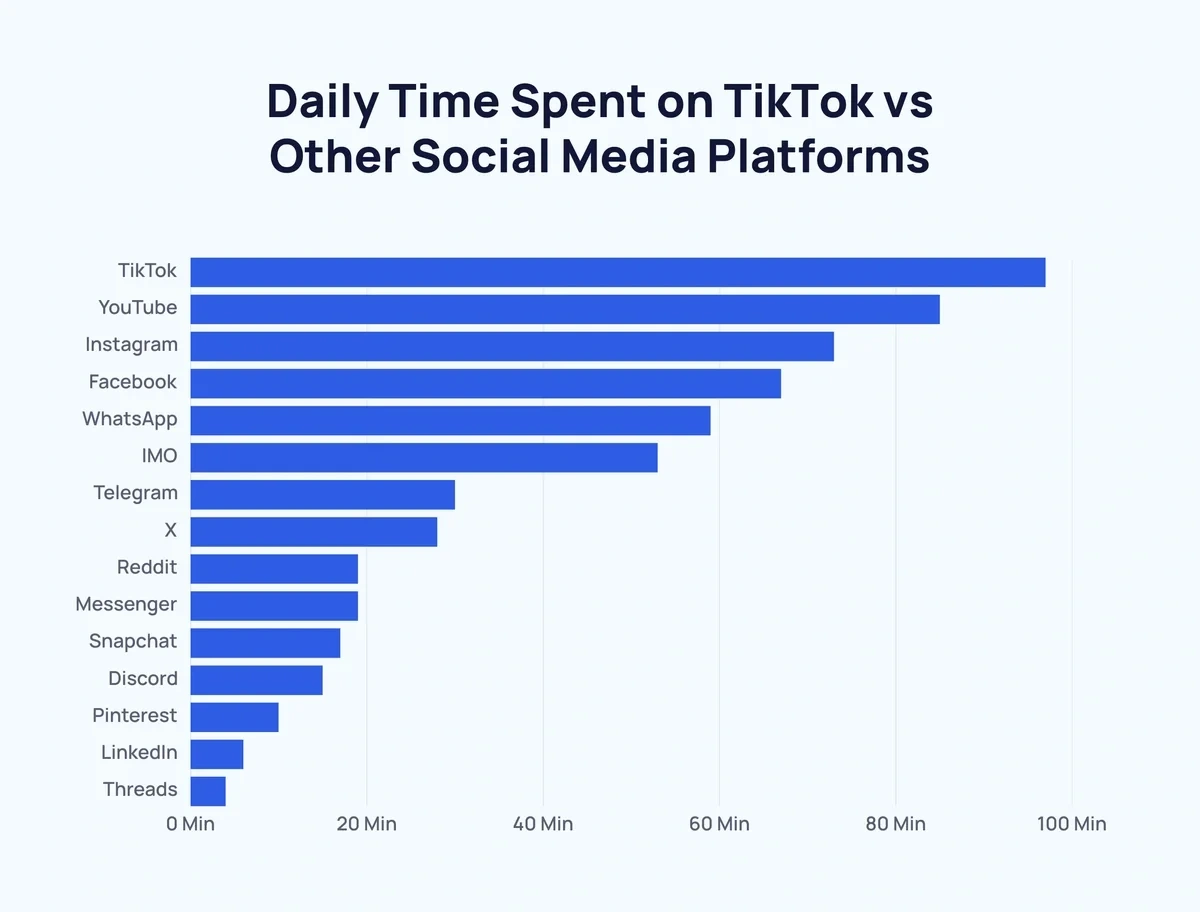
TikTok is leading the way as the social media platform receiving the most user attention from its active users.
Only four social media apps average more than an hour of daily usage. TikTok leads the way from YouTube (1 hour and 25 minutes), Instagram (1 hour and 13 minutes), and Facebook (1 hour and 7 minutes).
Users spend more than 3x as much time on TikTok as they do on X.
Here’s a full breakdown of the average share of time spent on social media platforms:
| Social Media Platform | Average daily usage time |
| TikTok | 1 hour 37 minutes |
| YouTube | 1 hour 25 minutes |
| 1 hour 13 minutes | |
| 1 hour 7 minutes | |
| 59 minutes | |
| IMO | 53 minutes |
| Telegram | 30 minutes |
| X | 28 minutes |
| 19 minutes | |
| Messenger | 19 minutes |
| Snapchat | 17 minutes |
| Discord | 15 minutes |
| 10 minutes | |
| 6 minutes | |
| Threads | 4 minutes |
Source: Data Reportal
Average TikTok Screen Time by Region
The average time spent on TikTok each month has surged in recent years.
In 2020, the global average stood at 13 hours and 18 minutes per month.
By 2024, this figure had increased by over 160%, reaching 34 hours and 56 minutes. That's around 3% of an entire month.
In 2026, TikTok users spend an estimated 48.5 hours per month on the platform.
Unfortunately, country-by-country data has not been published for 2025 or 2026. But according to the latest available data, the US spends 20-25% more time on TikTok than the global average.
Want to Spy on Your Competition?
Explore competitors’ website traffic stats, discover growth points, and expand your market share.
Here’s a list of national averages for monthly time spent on TikTok between 2020 and 2024, plus the up-to-date worldwide average for 2026:
| Country | 2026 | 2024 | 2023 | 2022 | 2021 | 2020 |
| Worldwide | 48 hours, 30 minutes | 34 hours, 56 mins | 34 hours | 23 hours, 30 mins | 19 hours, 36 mins | 13 hours, 18 mins |
| Mexico | - | 45 hours, 25 mins | 45 hours, 1 min | 27 hours, 36 mins | 23 hours, 24 mins | 17 hours, 12 mins |
| Indonesia | - | 44 hours, 54 mins | 38 hours, 26 mins | 29 hours | 23 hours, 6 mins | 13 hours, 48 mins |
| US | - | 43 hours, 53 mins | 45 hours, 37 mins | 26 hours, 48 mins | 25 hours, 36 mins | 21 hours, 30 mins |
| UK | - | 42 hours, 2 mins | 49 hours, 29 mins | 27 hours, 18 mins | 27 hours, 18 mins | 19 hours, 54 mins |
| Argentina | - | 38 hours, 52 mins | 38 hours, 33 mins | 20 hours, 6 mins | 14 hours, 48 mins | 11 hours, 24 mins |
| Australia | - | 38 hours, 51 mins | 42 hours, 13 mins | 29 hours, 36 mins | 23 hours, 24 mins | - |
| Russia | - | 38 hours, 8 mins | 31 hours, 47 mins | 28 hours, 42 mins | 26 hours, 18 mins | 17 hours, 24 mins |
| Canada | - | 37 hours, 43 mins | 38 hours, 47 mins | 25 hours, 54 mins | 22 hours, 36 mins | 17 hours, 6 mins |
| Germany | - | 34 hours, 51 mins | 37 hours, 38 mins | 23 hours, 42 mins | 23 hours, 36 mins | 19 hours, 24 mins |
| Singapore | - | 34 hours, 29 mins | 33 hours, 23 mins | 20 hours, 18 mins | 16 hours, 18 mins | 9 hours, 24 mins |
| France | - | 32 hours, 48 mins | 38 hours, 38 mins | 21 hours, 24 mins | 21 hours, 6 mins | 17 hours, 18 mins |
| Brazil | - | 28 hours, 34 mins | 30 hours, 10 mins | - | 20 hours, 12 mins | 14 hours |
| Turkey | - | 26 hours, 26 mins | 29 hours, 25 mins | 20 hours, 54 mins | 18 hours, 48 mins | 14 hours |
| South Korea | - | 19 hours, 55 mins | 25 hours, 6 mins | 19 hours, 54 mins | 16 hours, 54 mins | 13 hours, 48 mins |
Source: DataReportal
Children & Teenagers TikTok Usage
More than two-thirds of US teens say that they use TikTok. That makes it the second most popular social media app among teens, behind YouTube (a massive 92%).
However, TikTok is second to none in terms of potentially addictive usage patterns. 21% of US teens say they are "almost constantly" on TikTok.
More than half of teenagers report visiting the app at least several times a day. In total, 61% use TikTok daily.
Here's how US teen usage of TikTok compares to other platforms, sorted by the highest levels of "almost constant" usage:
| Social media platform | Almost constant usage | Several times per day | About once a day | Net daily usage among teens |
| TikTok | 21% | 34% | 6% | 61% |
| YouTube | 17% | 43% | 16% | 76% |
| 12% | 31% | 12% | 55% | |
| Snapchat | 12% | 26% | 8% | 48% |
| 3% | 9% | 7% | 20% |
Among US teenage girls, the percentage of "almost constant" TikTok users rises to 24%.
Here's how usage volume breaks down by gender for a selection of the top social media platforms:
| Social media platform | Girls who use "almost constantly" (%) | Boys who use "almost constantly" (%) |
| TikTok | 24% | 17% |
| YouTube | 13% | 20% |
| 15% | 10% | |
| Snapchat | 14% | 11% |
| 3% | 2% |
It's hard to find up-to-date figures on the exact amount of time children and teenagers are spending on TikTok. But data from the UK suggests children are averaging 2 hours and 14 minutes on the platform.
Sources: Pew Research, Statista
Key Takeaways
TikTok’s popularity shows no signs of slowing down. And platform usage time continues to grow each year.
If you found this data insightful, take a look at more TikTok-related stats here: TikTok User Age, Gender, & Demographics, TikTok Content Creator Statistics, and Top 100 TikTok Searches.
Stop Guessing, Start Growing 🚀
Use real-time topic data to create content that resonates and brings results.
Exploding Topics is owned by Semrush. Our mission is to provide accurate data and expert insights on emerging trends. Unless otherwise noted, this page’s content was written by either an employee or a paid contractor of Semrush Inc.
Share
Newsletter Signup
By clicking “Subscribe” you agree to Semrush Privacy Policy and consent to Semrush using your contact data for newsletter purposes
Written By


Fabio is a research associate at Exploding Topics. Since 2021, Fabio has researched, written, and edited articles for the Explo... Read more