


Get Advanced Insights on Any Topic
Discover Trends 12+ Months Before Everyone Else
How We Find Trends Before They Take Off
Exploding Topics’ advanced algorithm monitors millions of unstructured data points to spot trends early on.

Keyword Research
Performance Tracking
Competitor Intelligence
Fix Your Site’s SEO Issues in 30 Seconds
Find technical issues blocking search visibility. Get prioritized, actionable fixes in seconds.
Powered by data from
Latest Blog Posts
Featured Case Studies
See what's trending before everyone else
Each week, we'll send you our best Exploding Topics. Plus, expert insight and analysis.
How to Automate Trend Detection and Content Briefs with Exploding Topics (Step-by-Step)

The modern web revolves around trends.
And businesses with a strong content focus can’t afford to ignore the rise and fall of trending ideas in their niche.
When executed right, trend-focused content strategies can scale your online visibility and presence faster than anything else.
In my experience, the number 1 reason most teams are unable to persist with trend-targeted content is the lack of systems.
You need high-quality trend data (and fast) to go anywhere with this strategy in a meaningful way.
I built an automated trends monitor workflow that pipelines into a brief generator for qualifying topics using n8n.
In this post, I’ll walk you through creating something similar for your team.
Quick Overview of the Trends Monitor and Content Brief Generator
The trends monitor automation is a time-saving system that finds the top winning trends every month and logs them in a sheet.
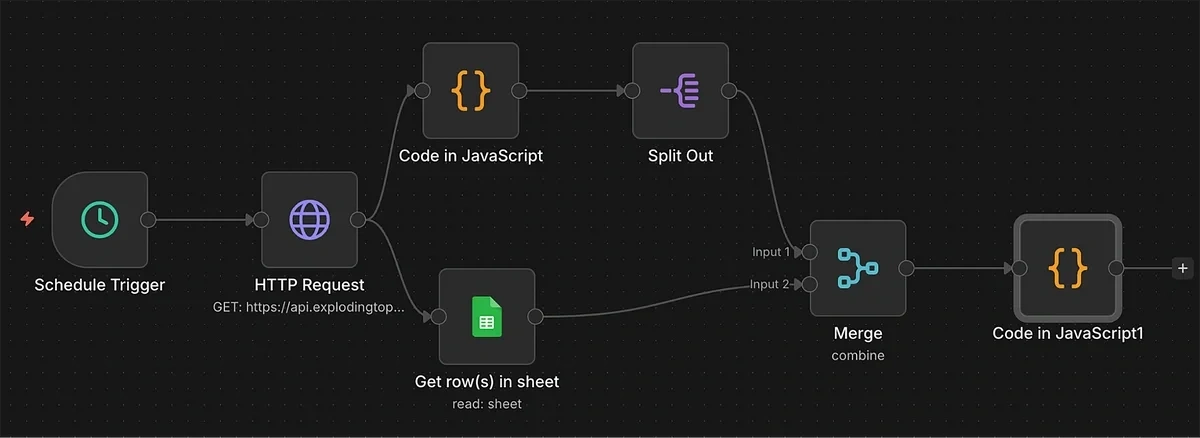
Here’s a snapshot of the full workflow in n8n:
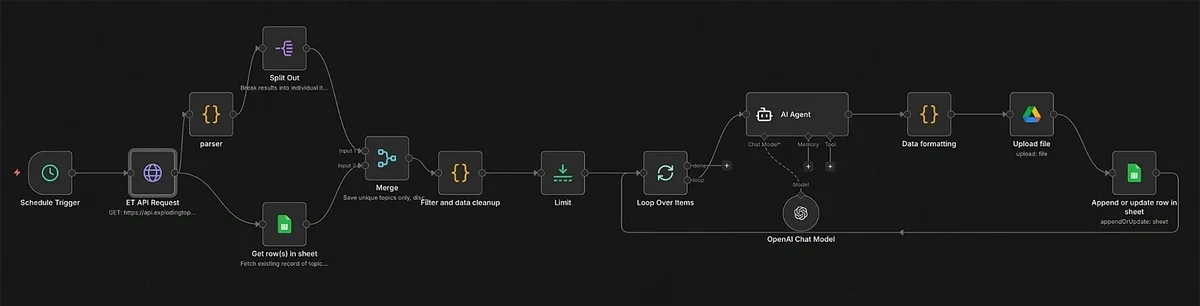
It’s easier than it looks! And as of Q2 2026, Exploding Topics has official integrations with both Zapier and n8n, making the process even simpler.
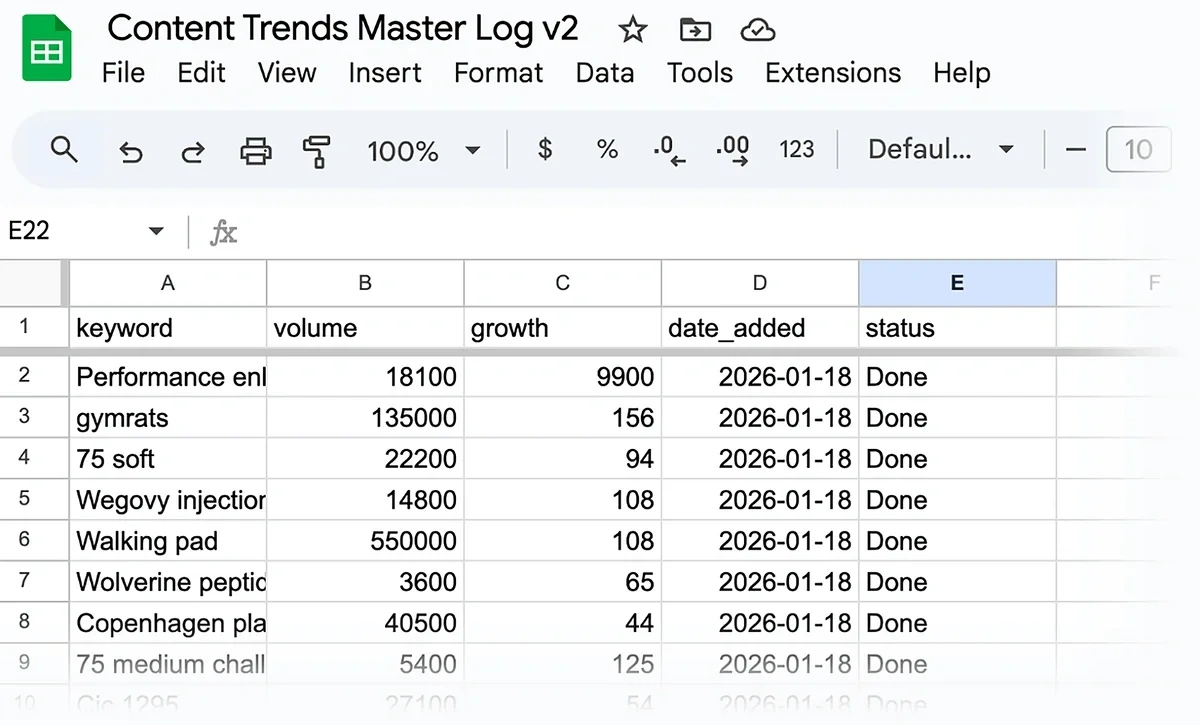
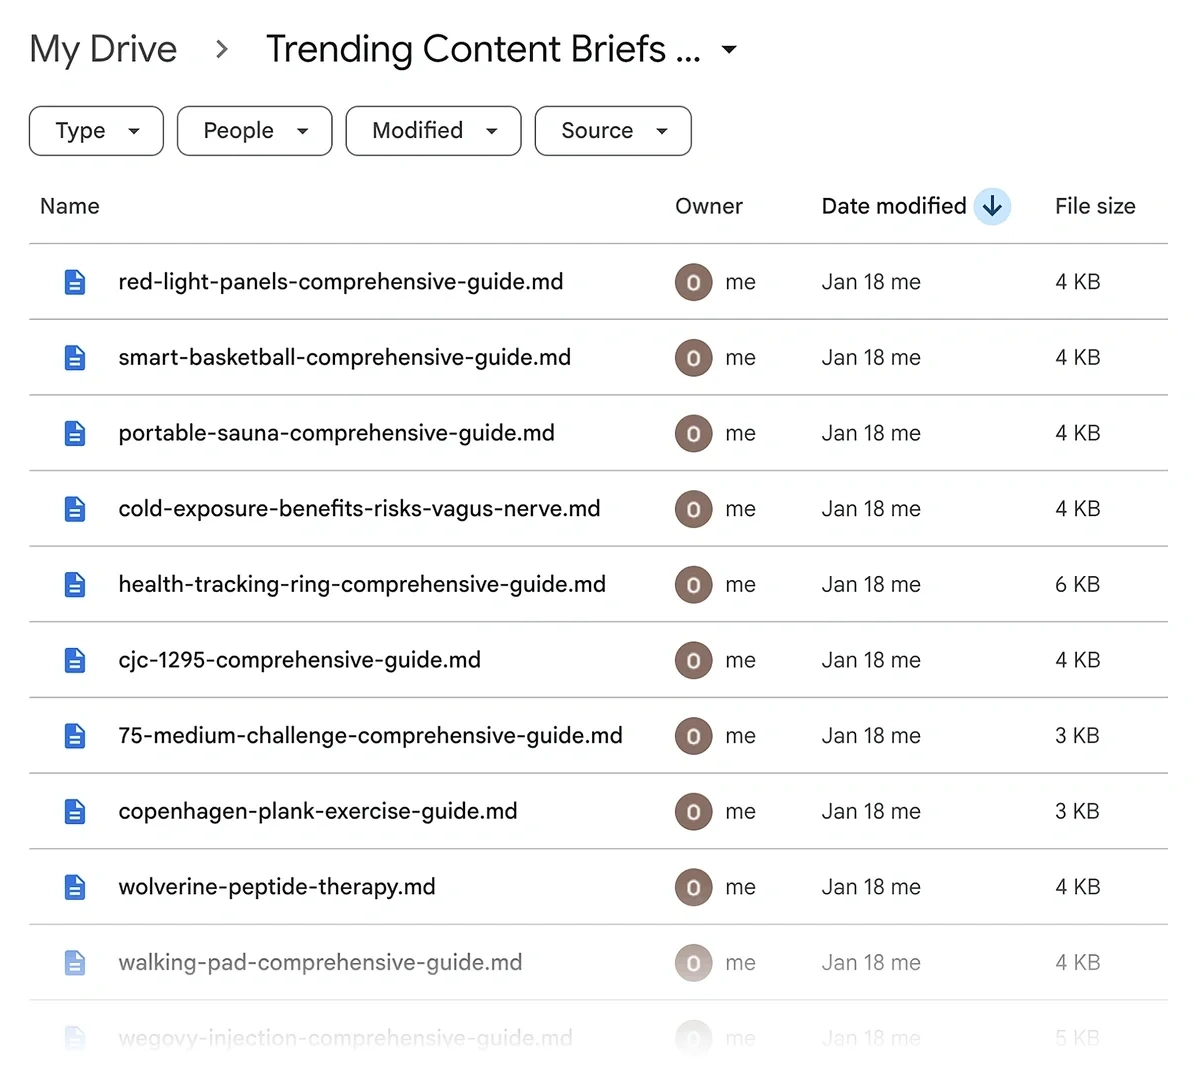
And once you’ve finished setting it up, you’ll have new trends coming into your sheet automatically every month:
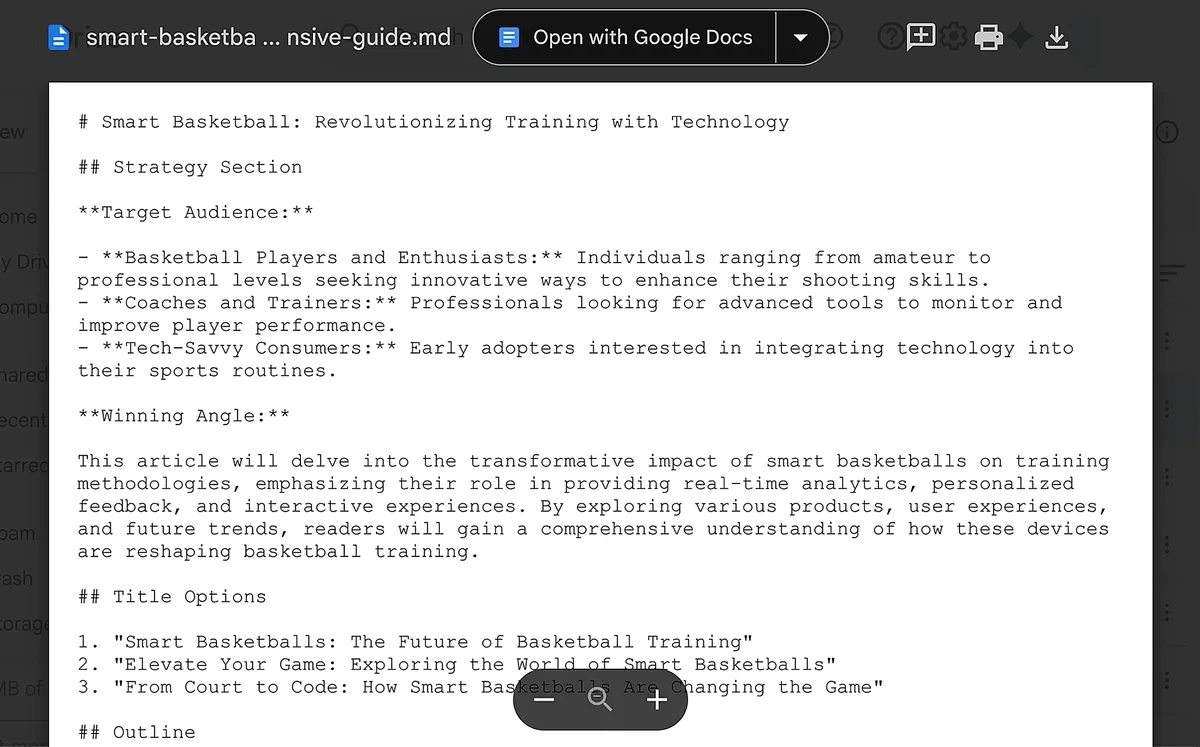
For each trend in the sheet, the automation will also generate a content brief before uploading it to your Google Drive:
Ready to get started?
Building the Content Trends Workflow
Tools you’ll need:
- Exploding Topics API
- n8n
- OpenAI/Gemini/Claude API
- Google Drive and Google Sheets API
1. Configure Exploding Topics API with Query Parameters
The Exploding Topics API will serve as the data source supplying trend information for this automation.
That's plenty for this workflow
Once you’ve acquired the Exploding Topics Business plan, go to the app and click on “API Access" on the sidebar menu.
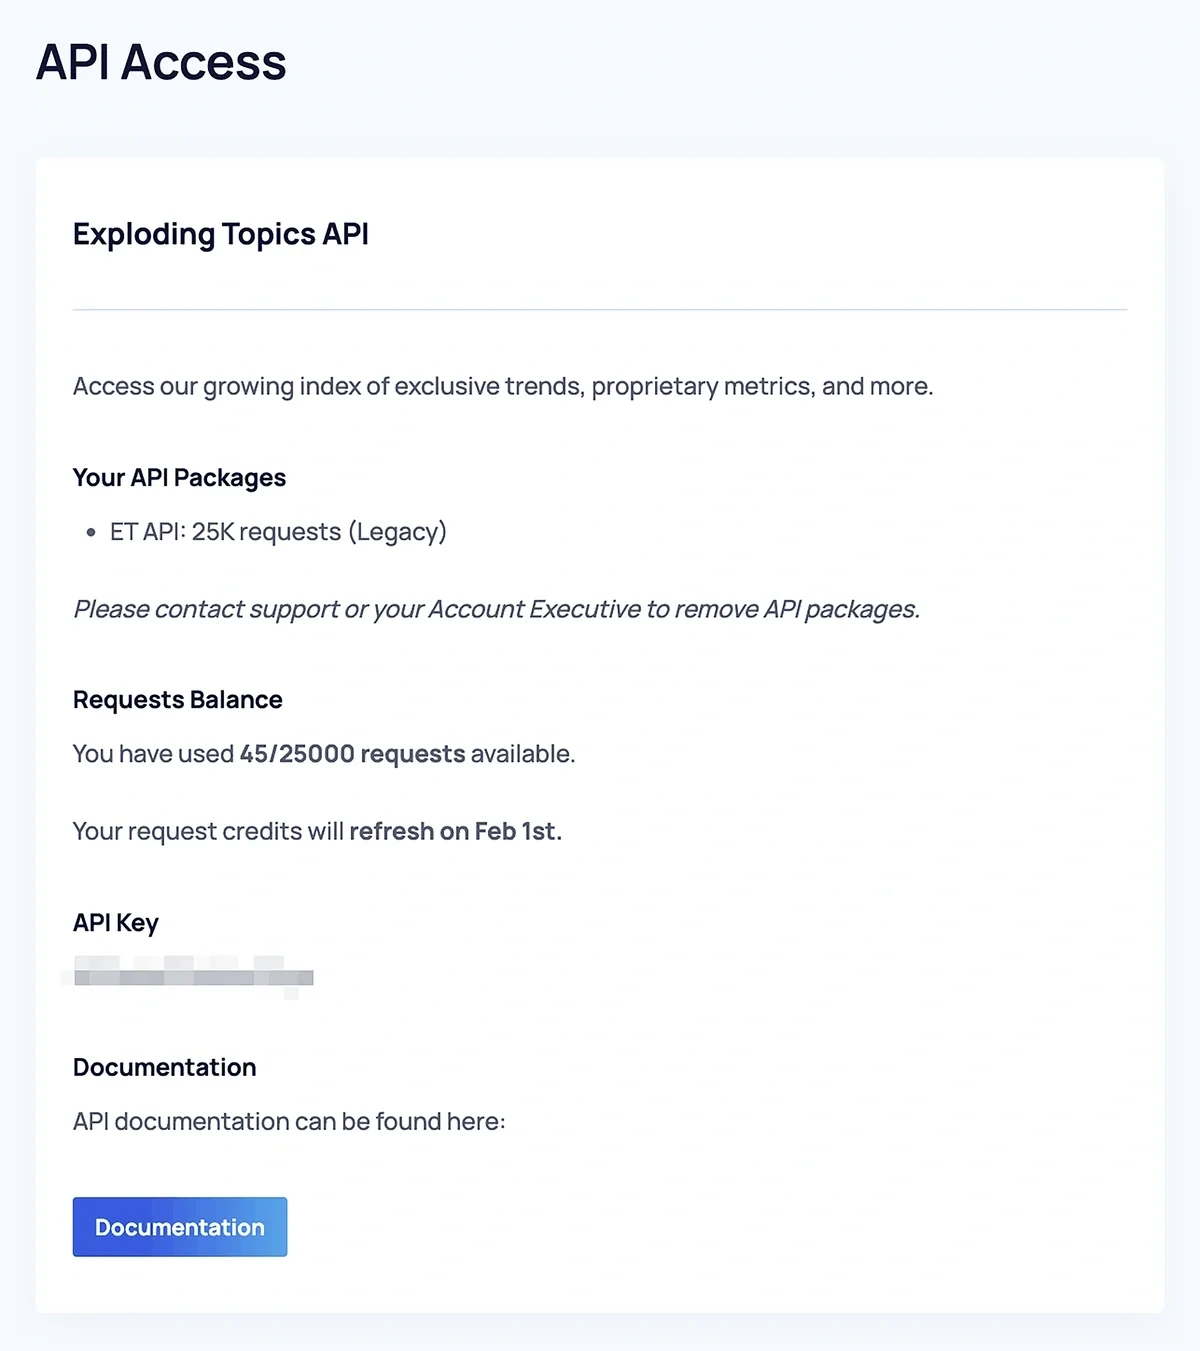
Find your API Key and copy it.
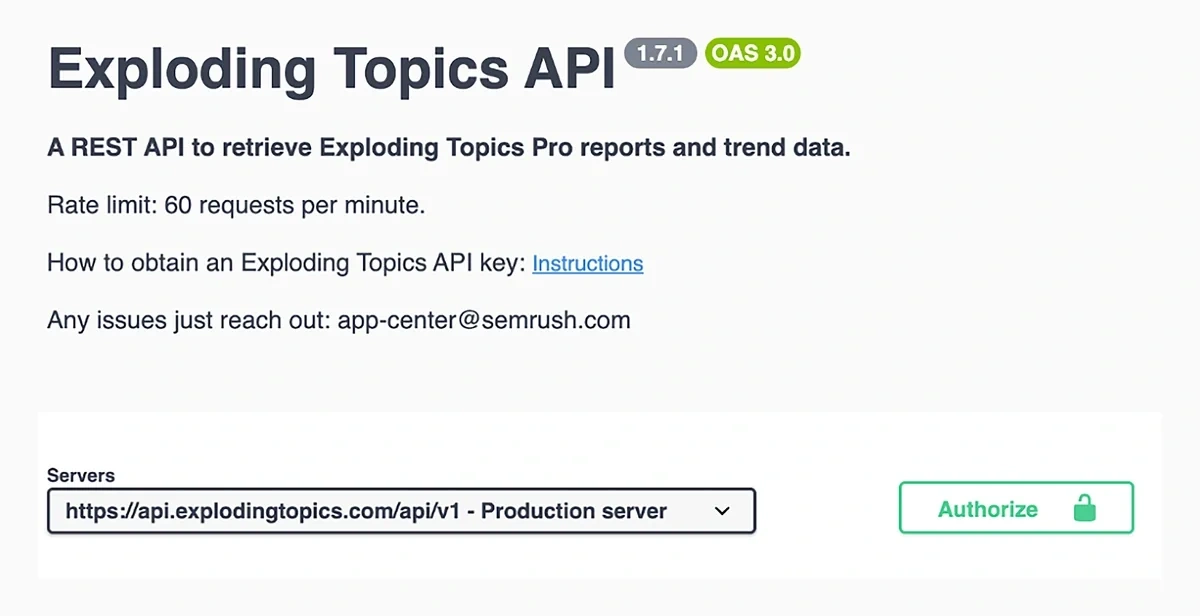
Then, click the “Documentation” button at the bottom.
This opens a page to construct API request URLs with the exact parameters you need for your trend monitoring system.
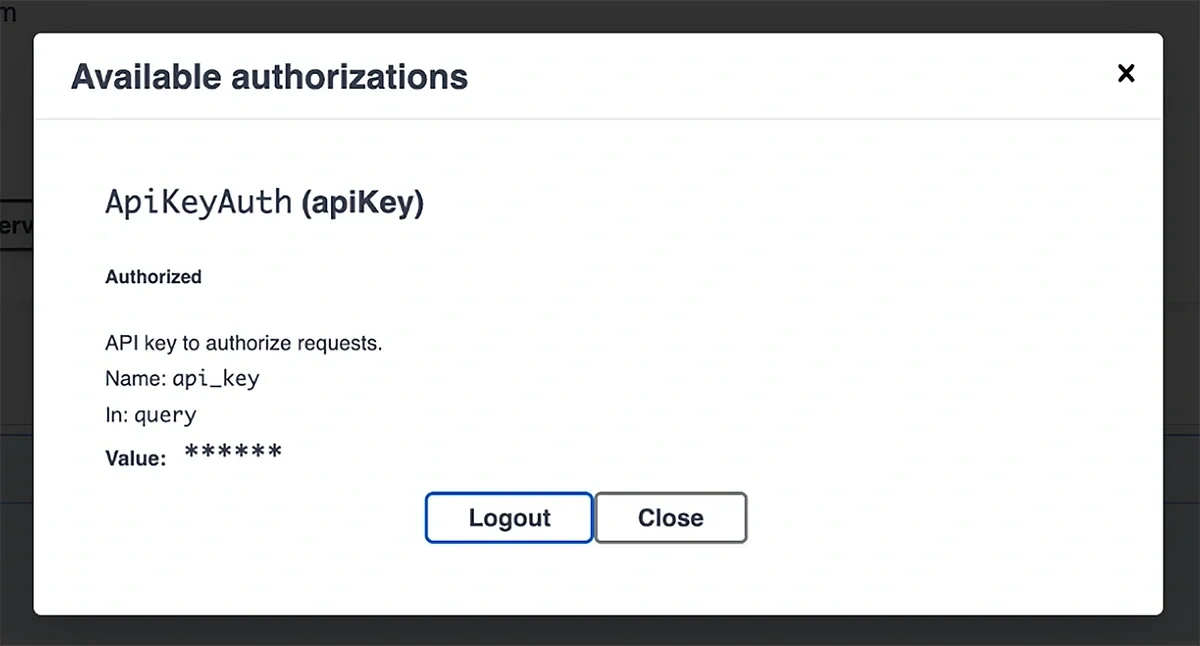
To start, click on the green “Authorize” button on the right.
When the modal pops up, paste your API key and click the “Authorize” button underneath.
Next, expand open the GET/Topics endpoint to reveal its parameters. You can press the “Try it out” button to select your parameters and get the HTTP URL with your filters and parameters dialed in.
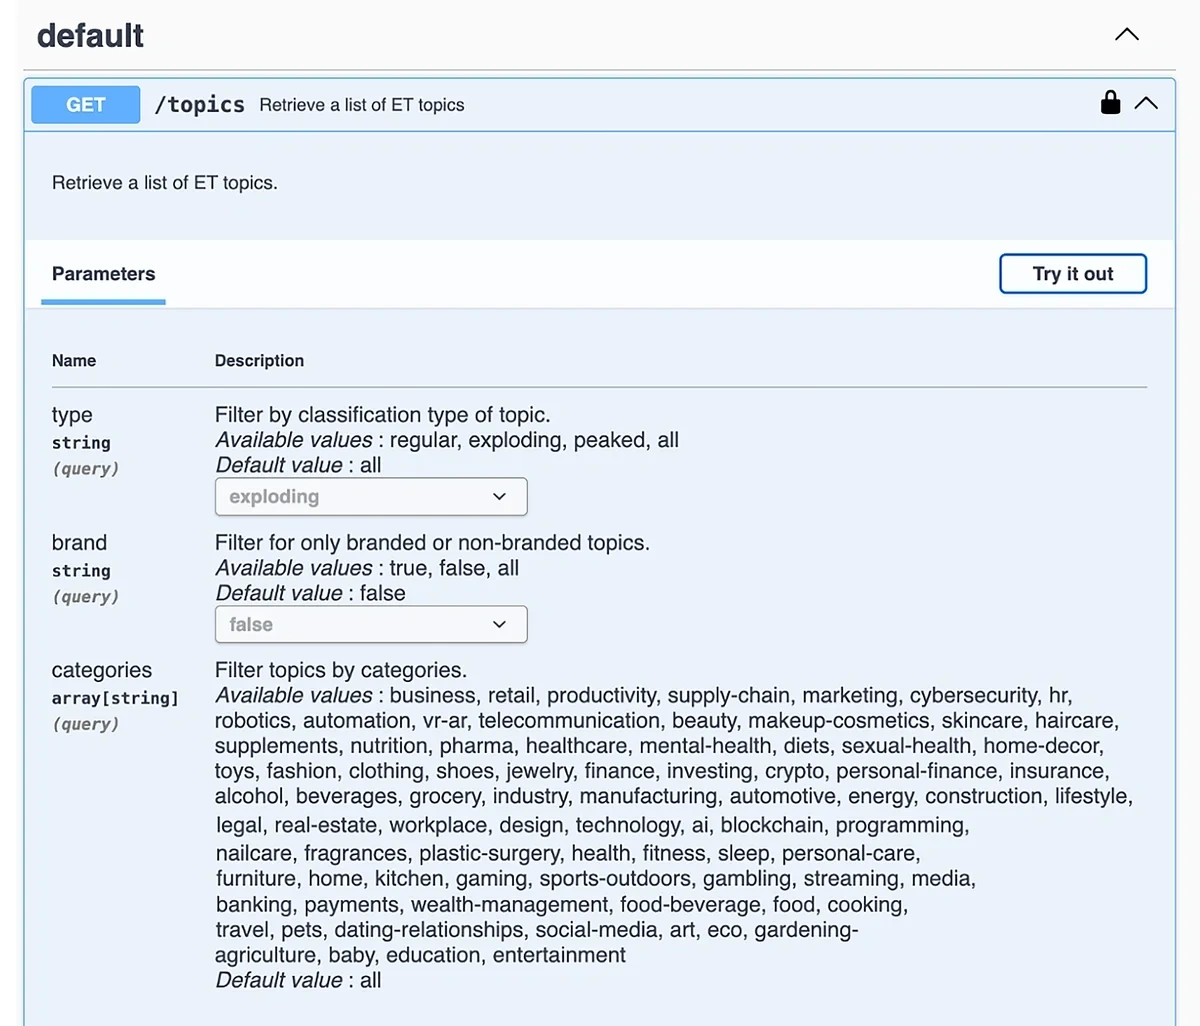
As I said earlier, the exact parameters depend on your goals and the kind of trends you’re interested in.
For this example, I want to focus on the trending topics that are showing the best growth figures in the past 6 months.
These represent the high-potential topics with a recent history of rising growth.
At the same time, content around these topics is usually unlikely to be saturated, giving you an opportunity to catch it before your competitors.
(You can view our 90-day, trend-matched editorial system for content calendar planning to see how best to implement trends into your content strategy.)
Here’s what the parameter settings would look like for a trend monitor sensitive to this scenario:
| Parameter | Value | Why |
| Type | Exploding | High-growth opportunities |
| Brand | False | Ignore branded terms |
| Categories | {select one or multiple categories matching your business niche} | Extract data from niche-relevant database |
| Sort | Growth | Fastest-rising topics MoM |
| Order | Desc | Top growing topics first |
| Timeframe | 6 (in months) | 6 months of data to supply trend context |
| Offset | 0 | Results gathered from the beginning without skipping any |
| Limit | 50 | Total topics to retrieve in each API call |
| Response_timeframe | last_12_months | Gather data from recent search history |
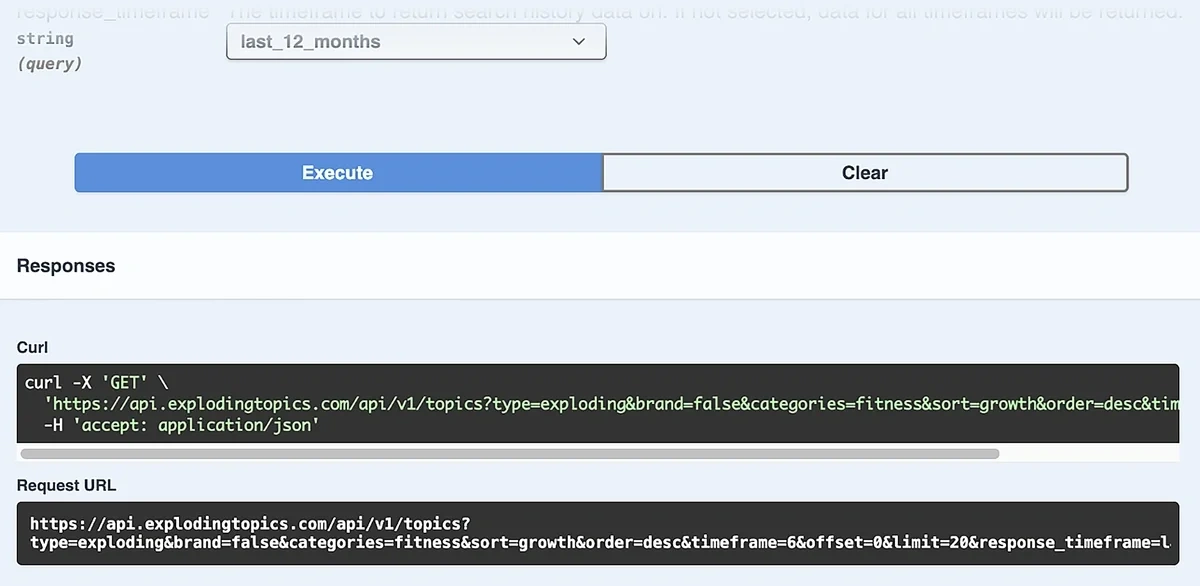
Click on the “Execute” after setting your parameters to generate the full request URL for API calls:
2. Prepare Your Spreadsheet
Create a Google Sheet with these 5 columns:
- keyword
- volume
- growth
- date_added
- status
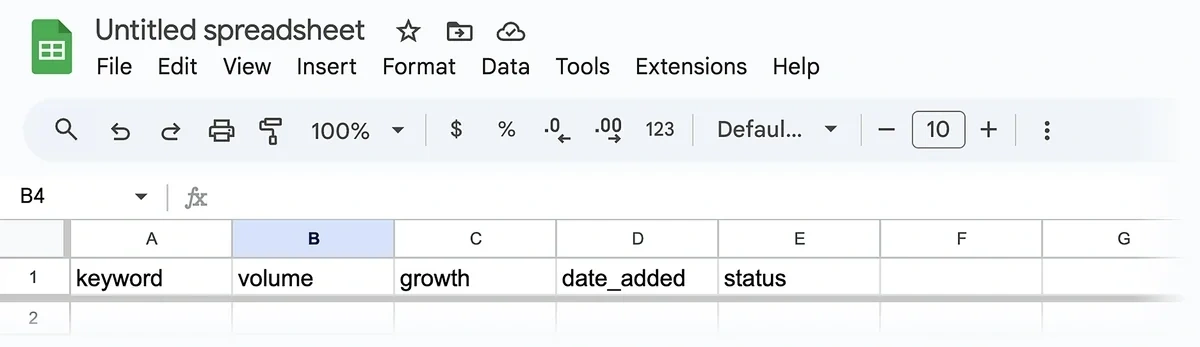
Give your sheet a descriptive title so you can easily find it later when connecting n8n with your spreadsheet.
Note: Don’t capitalize the first letter of your column names. This is necessary for mapping data from the API to the spreadsheet.
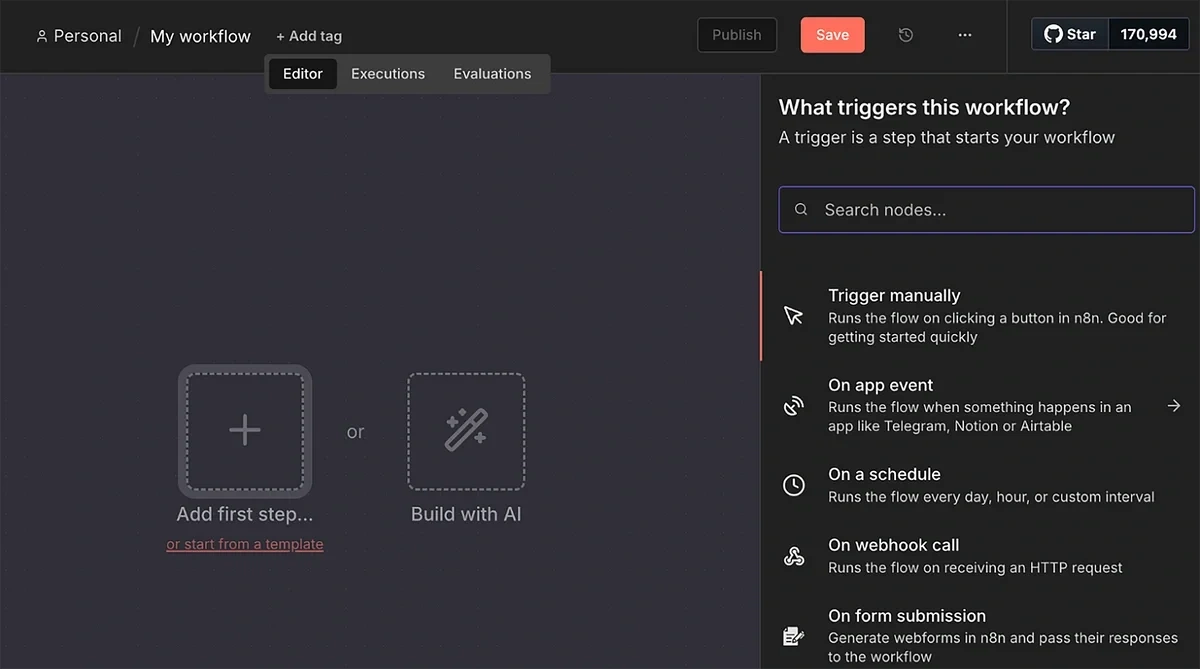
3. Build a New n8n Workflow and Set Up a Trigger
Log in to your n8n account and create a new workflow.
The first node you need for the workflow is a trigger.
For our purposes, it makes sense to use a scheduled trigger so that the automation runs on regular intervals to detect new trends.
After selecting the “On a schedule” trigger, use the rules to set a frequency of 1 month.
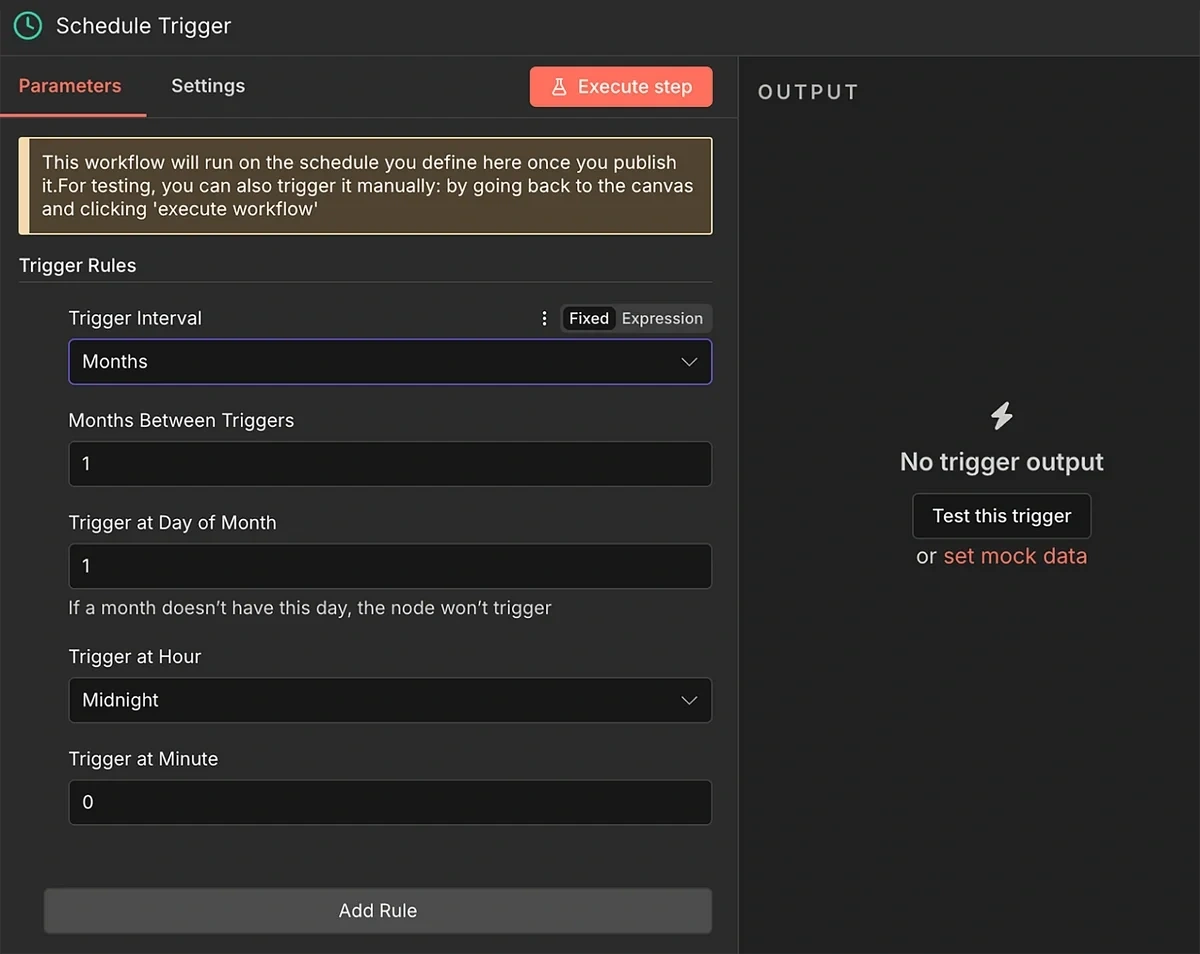
You can use a more frequent schedule if you want to monitor upcoming trends in shorter intervals.
However, there’s a higher chance of returning zero fresh results that meet the minimum growth and volume criteria we will set later.
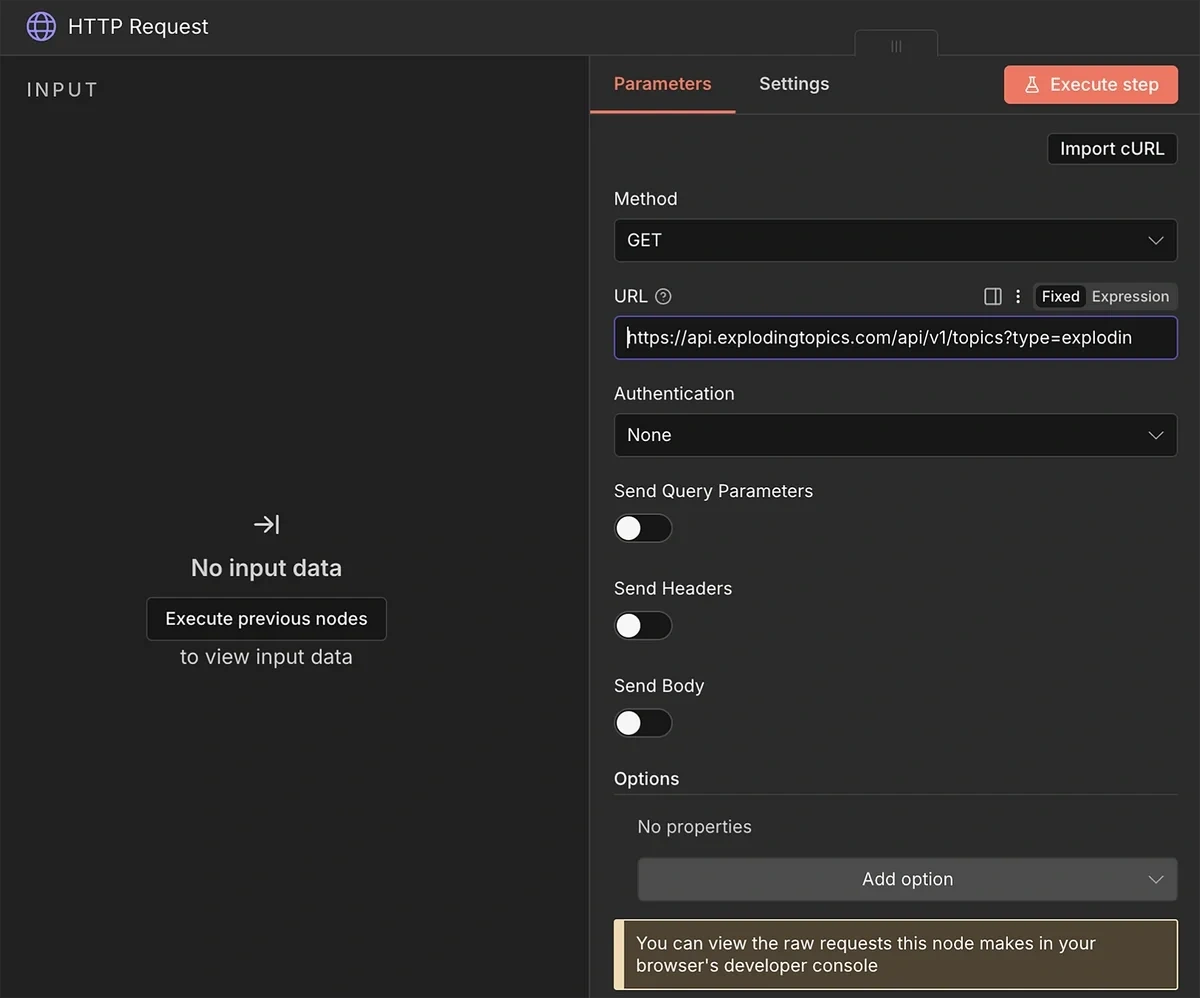
4. HTTP Request from Exploding Topics API
Next, add the HTTP Request node to the trigger.
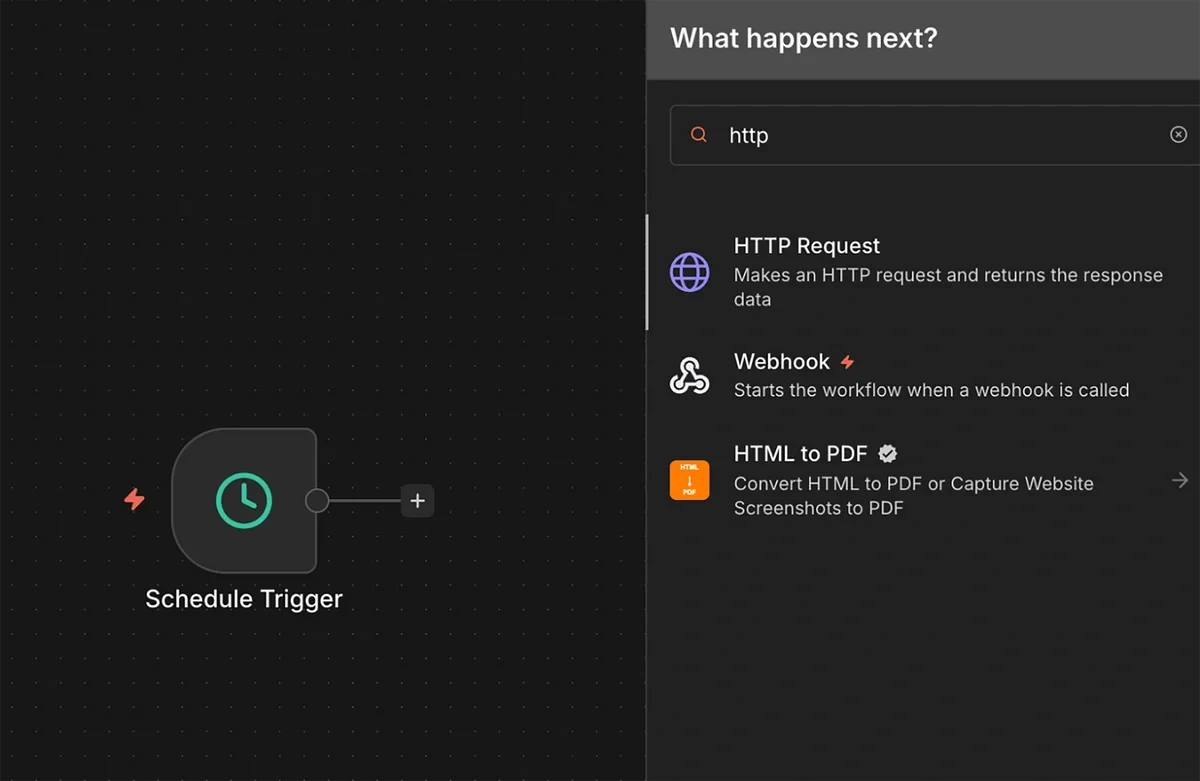
Copy-paste the request URL that you generated with the Exploding Topics API documentation earlier into the URL field.
Leave the other fields to their default setting.
Next, we’ll add a JavaScript code node.
The HTTP request sometimes returns data in a packed form with all the raw data inside a single field. This can cause the workflow to stop prematurely.
This JavaScript code parses the data into a structured format. Other nodes in the workflow can then read it easily
With the JavaScript code below, we can parse the data into a structured format.
Other nodes in the workflow can then read it easily:
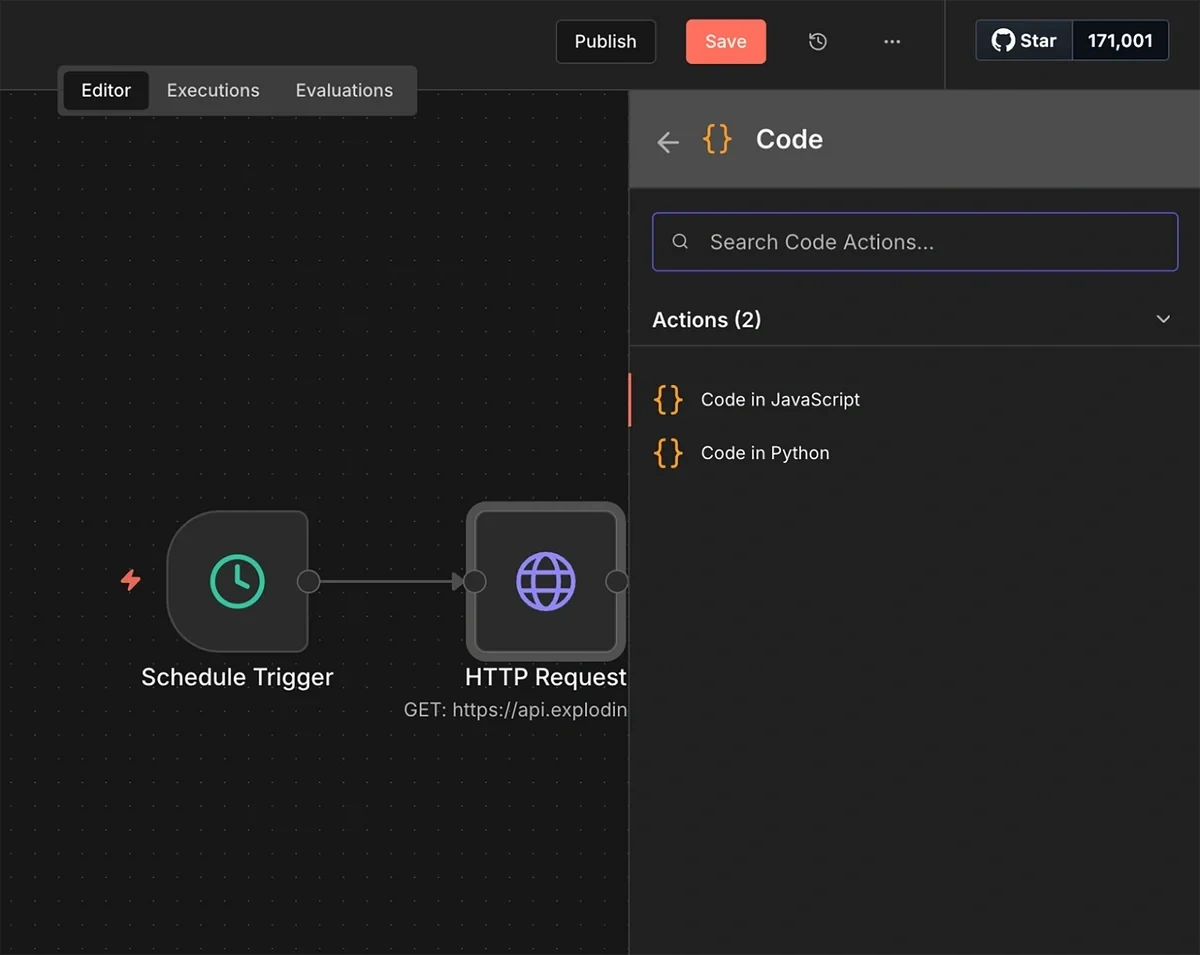
Add a Code node after the HTTP Request and paste in this JavaScript:
// Loop over all items (usually just 1 from the API)
return $input.all().map(item => {
    const json = item.json;

    // SCENARIO 1: The data is "Squished" inside a string called 'data'
    if (typeof json.data === 'string') {
        try {
            // Parse the string into real JSON
            const parsed = JSON.parse(json.data);
            return { json: parsed };
        } catch (e) {
            // If it fails, just pass the original item
            return item;
        }
    }

    // SCENARIO 2: The data is already perfect
    return item;
});
The parser code will make sure the workflow keeps functioning smoothly regardless of the format of the output returned from the API call.
The HTTP request node serves as the input to another node: a Google Sheets node with the “get rows in sheet action”.
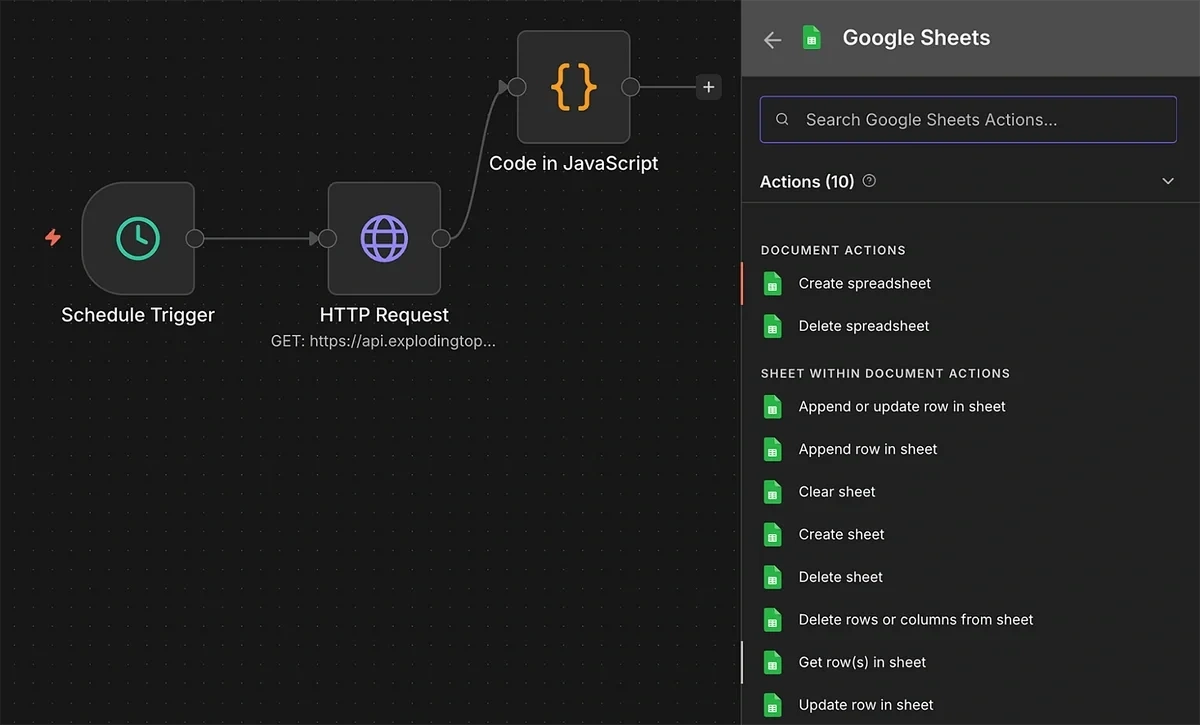
However, you’ll need to enable connection between n8n and your Google Cloud to allow your automation to read and modify files in your Google Drive.
5. Connect Google Cloud with n8n
As you add the get row(s) node, select the “Create new credential” option.
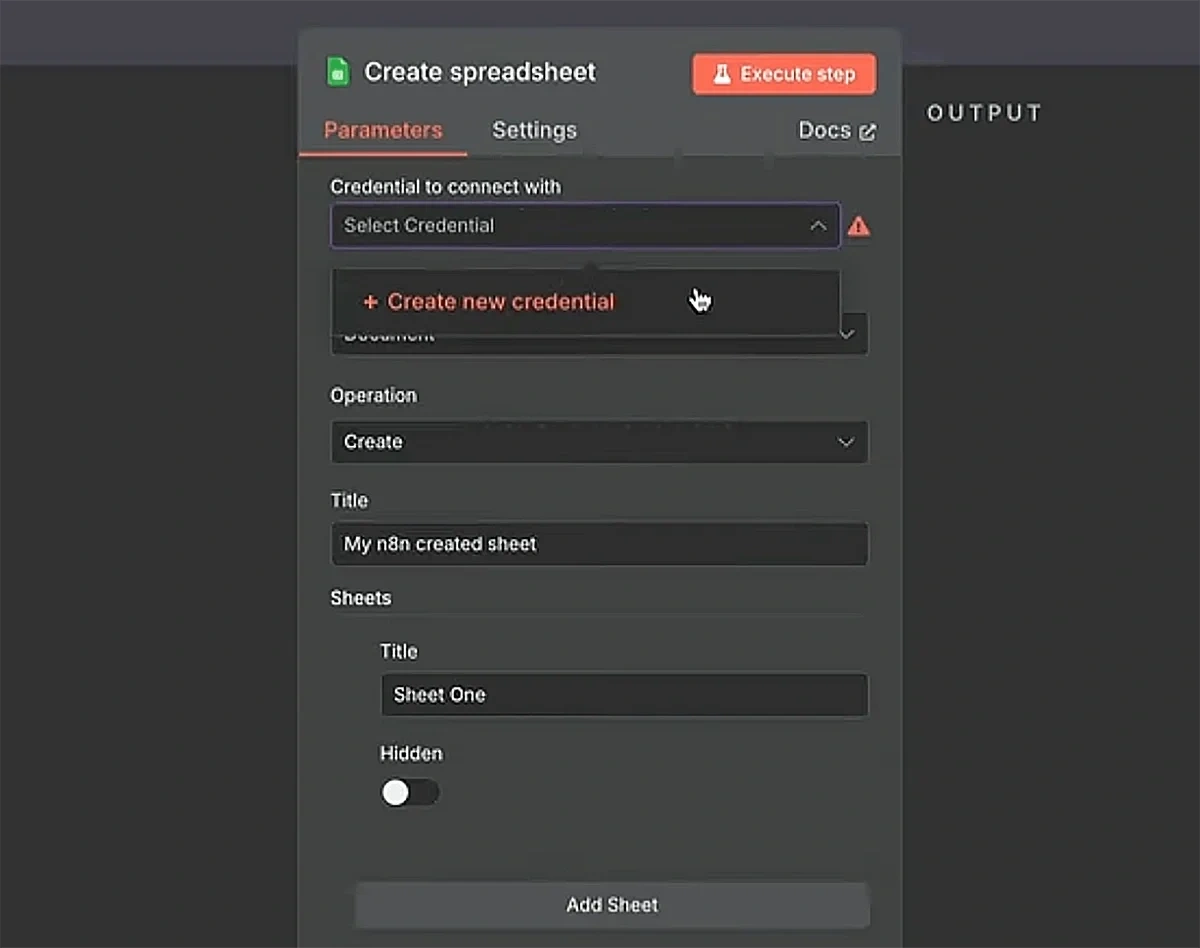
Choose “OAuth2 (recommended)” as your connection method.
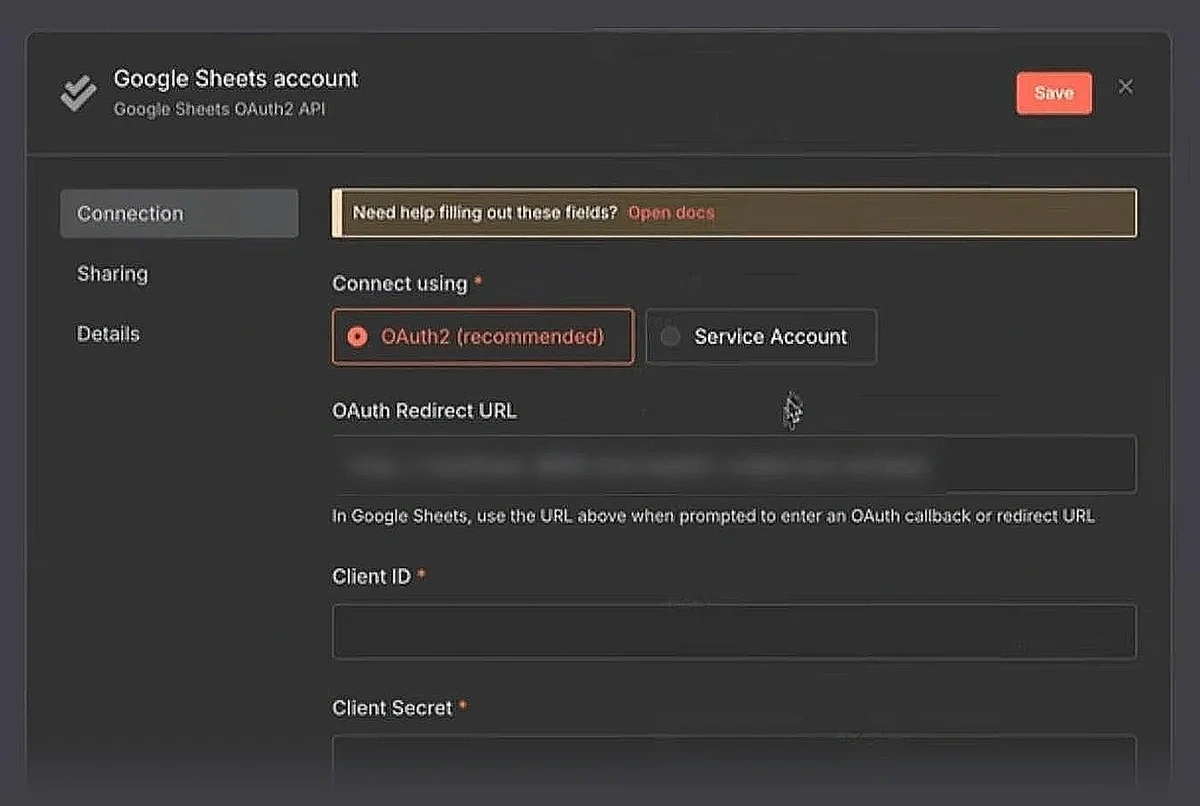
This will take you to your Google Cloud.
You’ll need to set up a new project in your Google Cloud and set up the connection.
Here’s a helpful video walkthrough from n8n showing the entire connection process:
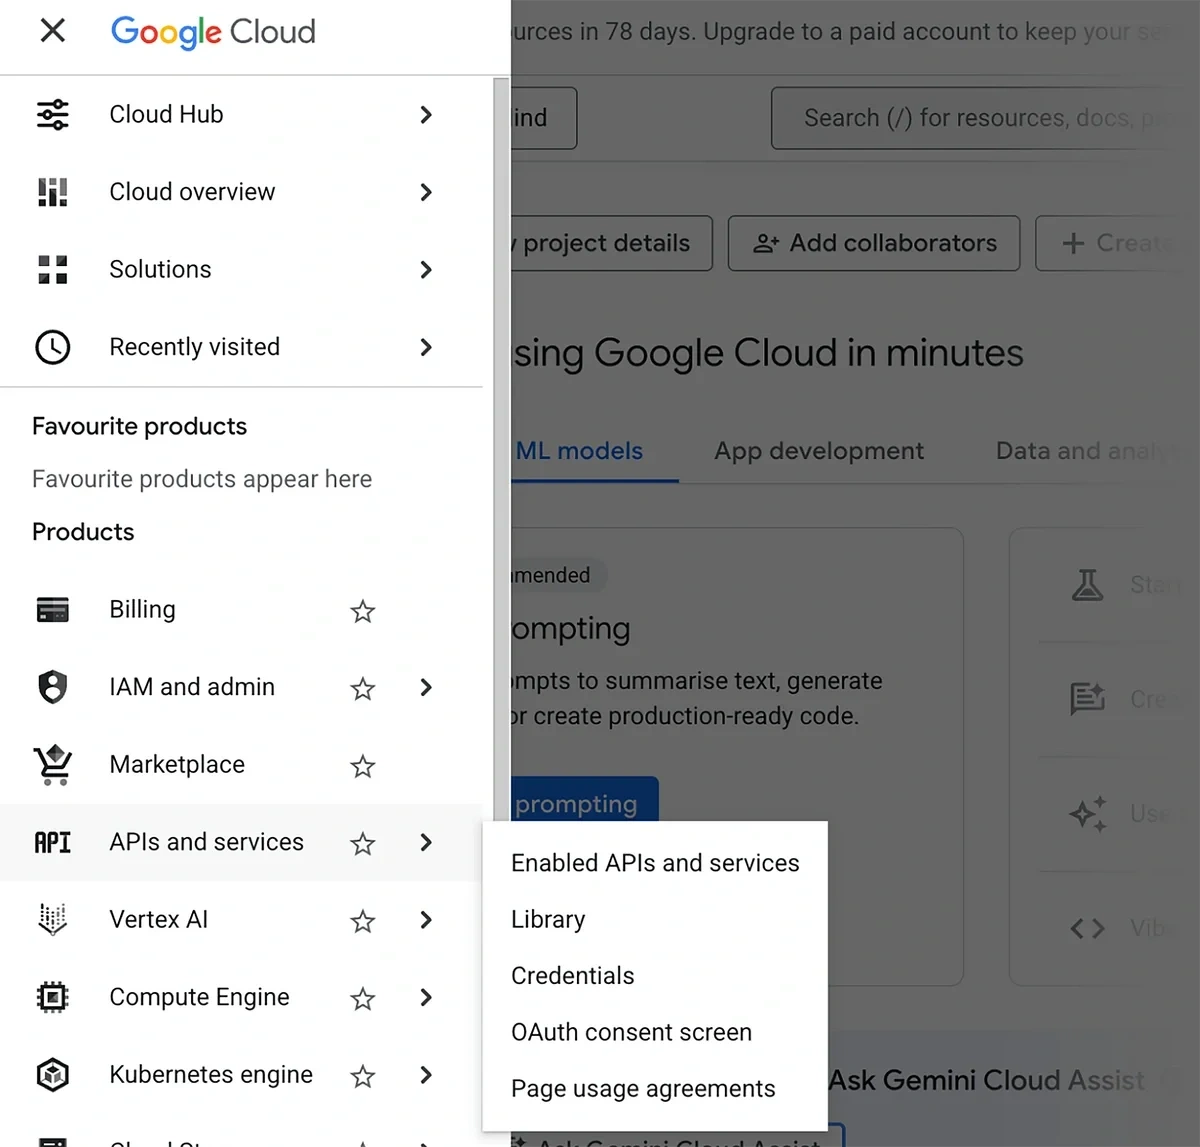
While you’re in your Google Cloud dashboard, make sure to enable APIs for your Google Drive, Google Sheets, and Google Docs as well
Click on the hamburger icon on the left (next to the Google Cloud logo) to open the navigation menu.
Then, hover your cursor over APIs and services and select “Library”.
Use the search bar to find Google Sheets and click on it.
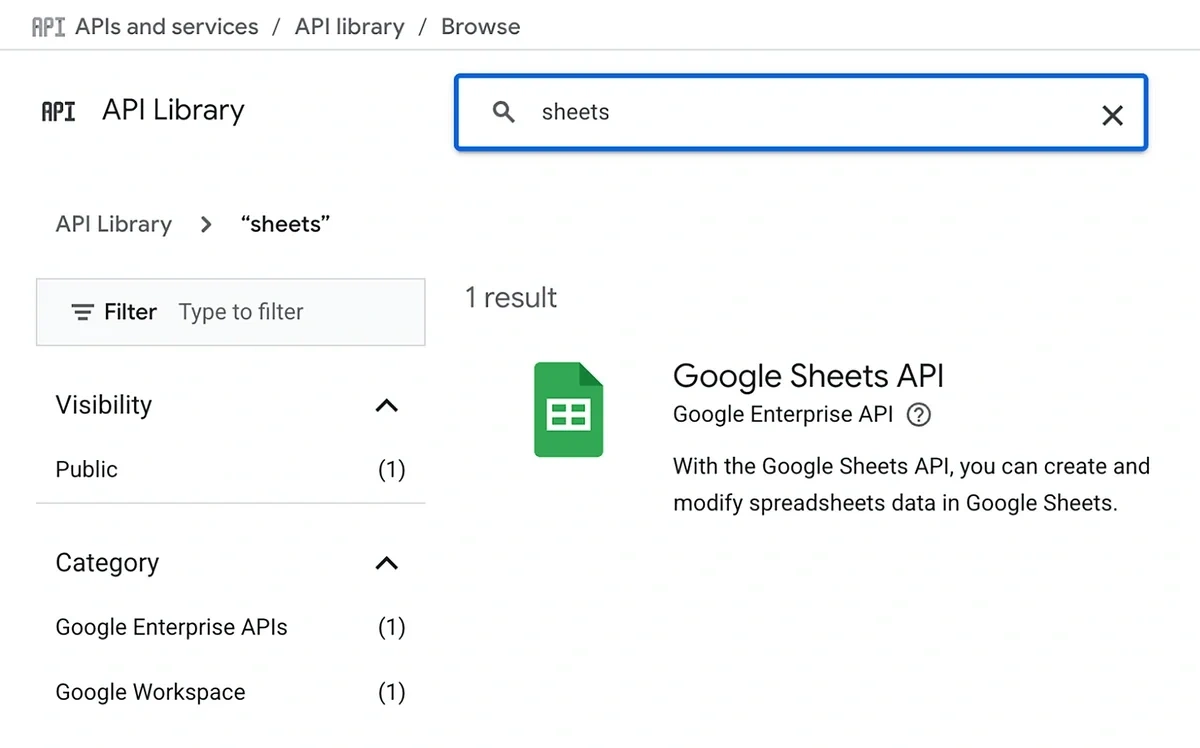
Click “Enable”.
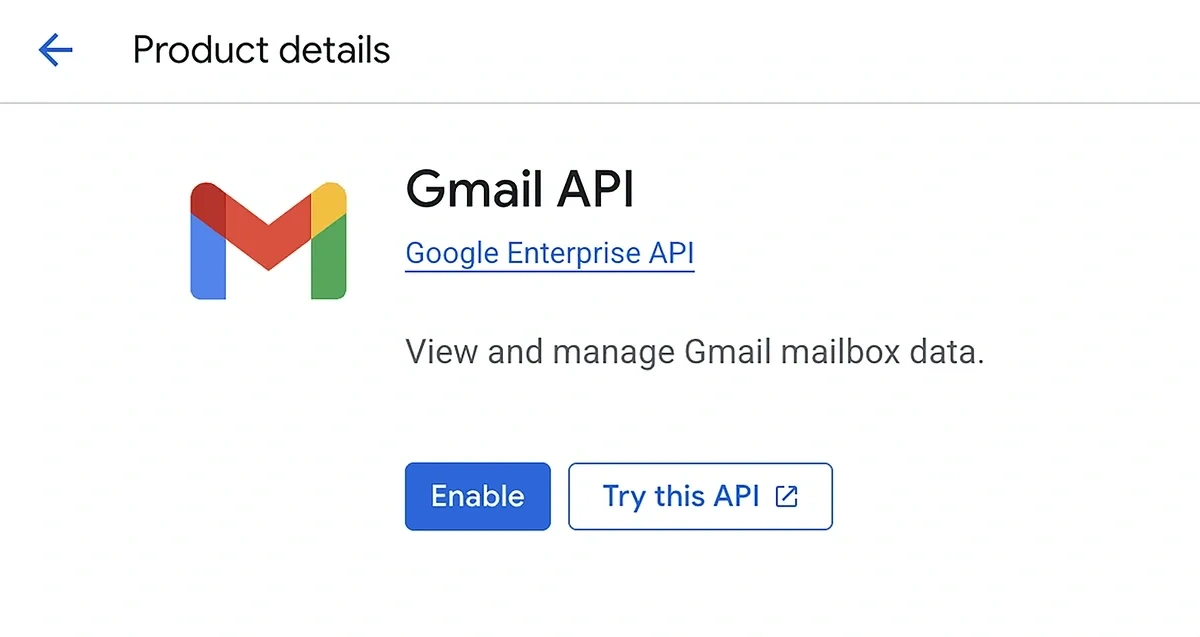
Repeat the process for other Google products like Drive and Docs to enable their APIs as well.
After you’re done with the setup, you’ll see a notification confirming that your account is connected.
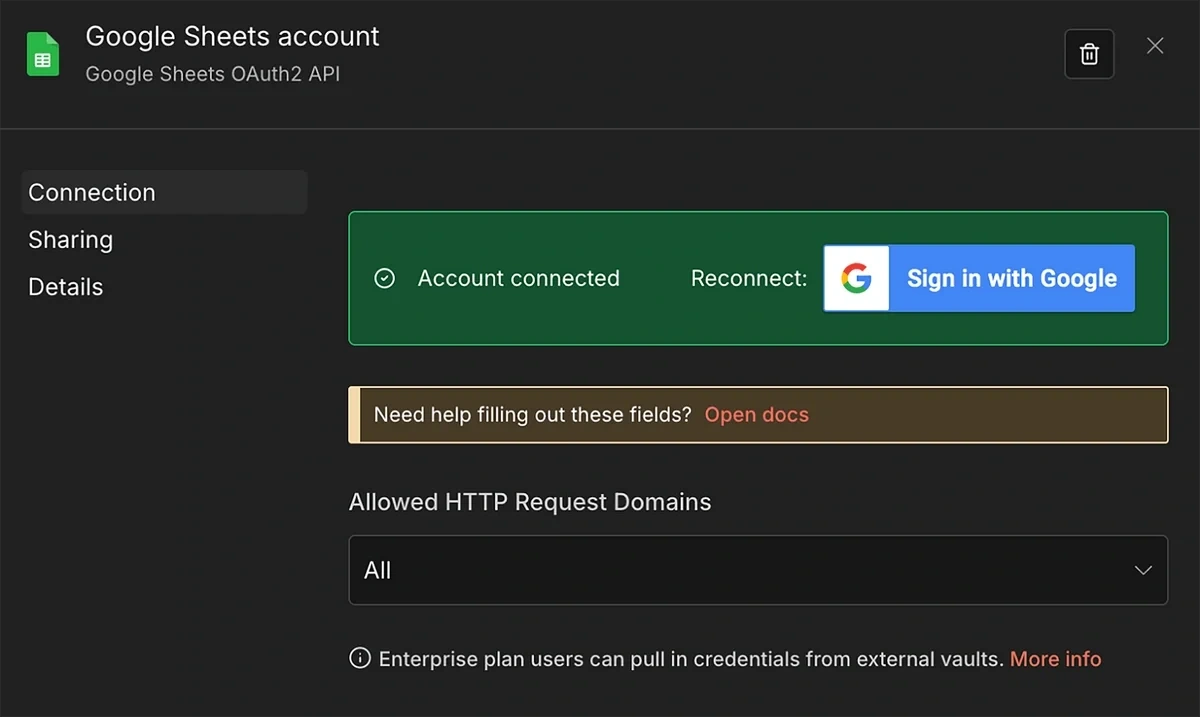
Close this modal to move back to the parameter configuration for the Get row(s) node.
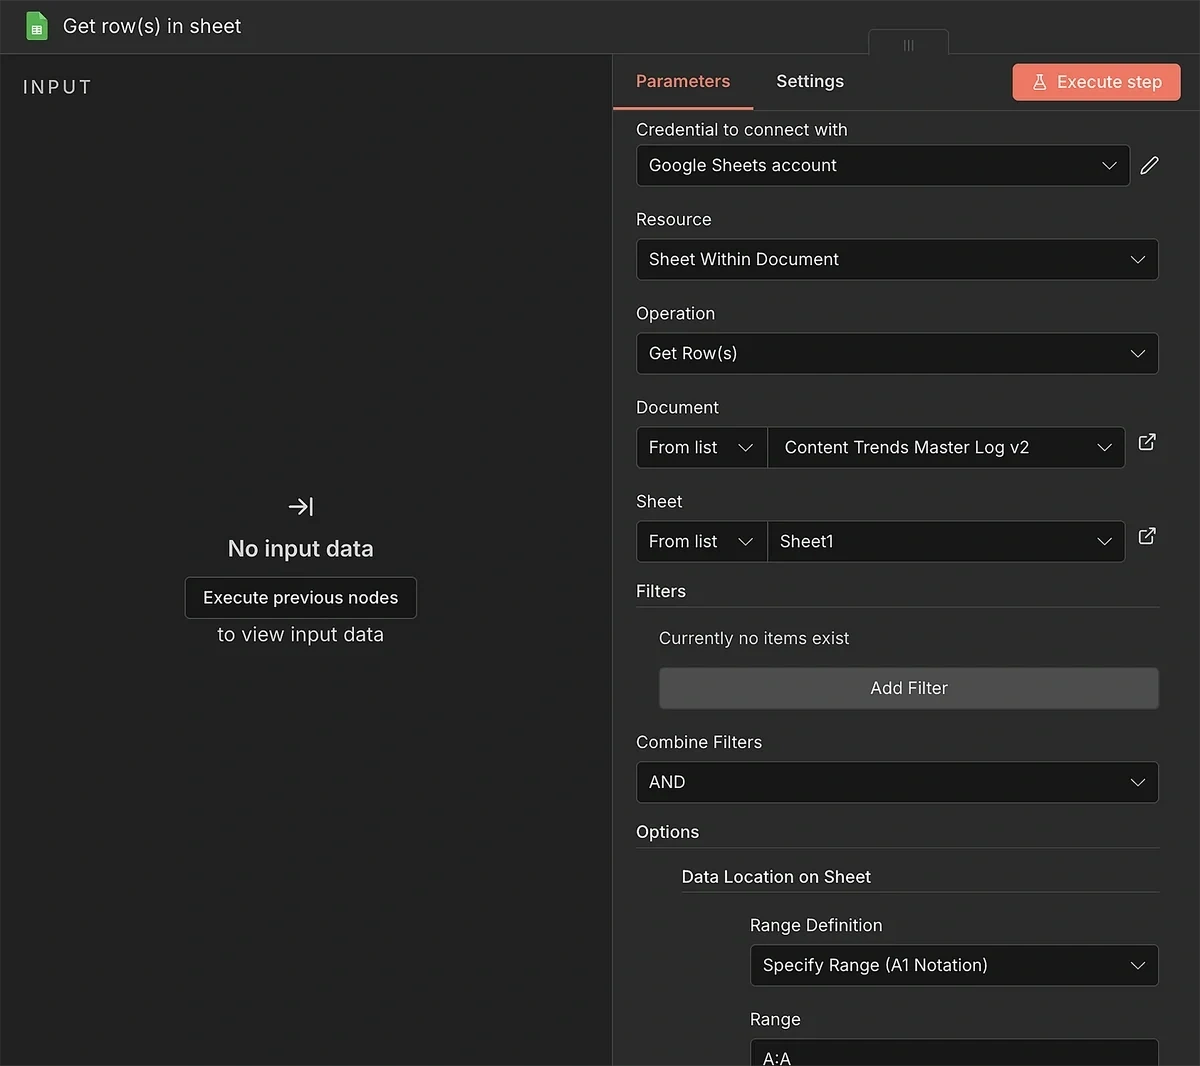
Update these settings:
- Document (From list): Use the dropdown to select the spreadsheet you created in step 2
- Sheet (From list): Select the relevant sheet within the document
I also used an additional option to force the instance to pull data only from the first column.
This isn’t super important, but it helps the workflow function smoothly without being overloaded with data not needed for an operation.
I used the “Data Location on Sheet” option with the Specify Range (A1 Notation) method. To select the first column (keyword), you can specify the range as “A:A”.
6. Split, Merge, and Filter
In step 4, we created a data parser to add structure to the API output when necessary.
Now, we need to connect the output of the parser to a Split Out node.
Why’re we doing this?
Because by default, n8n will process all trends coming from the API as a single item.
Using the Split Out function, we can treat each trend as a separate item.
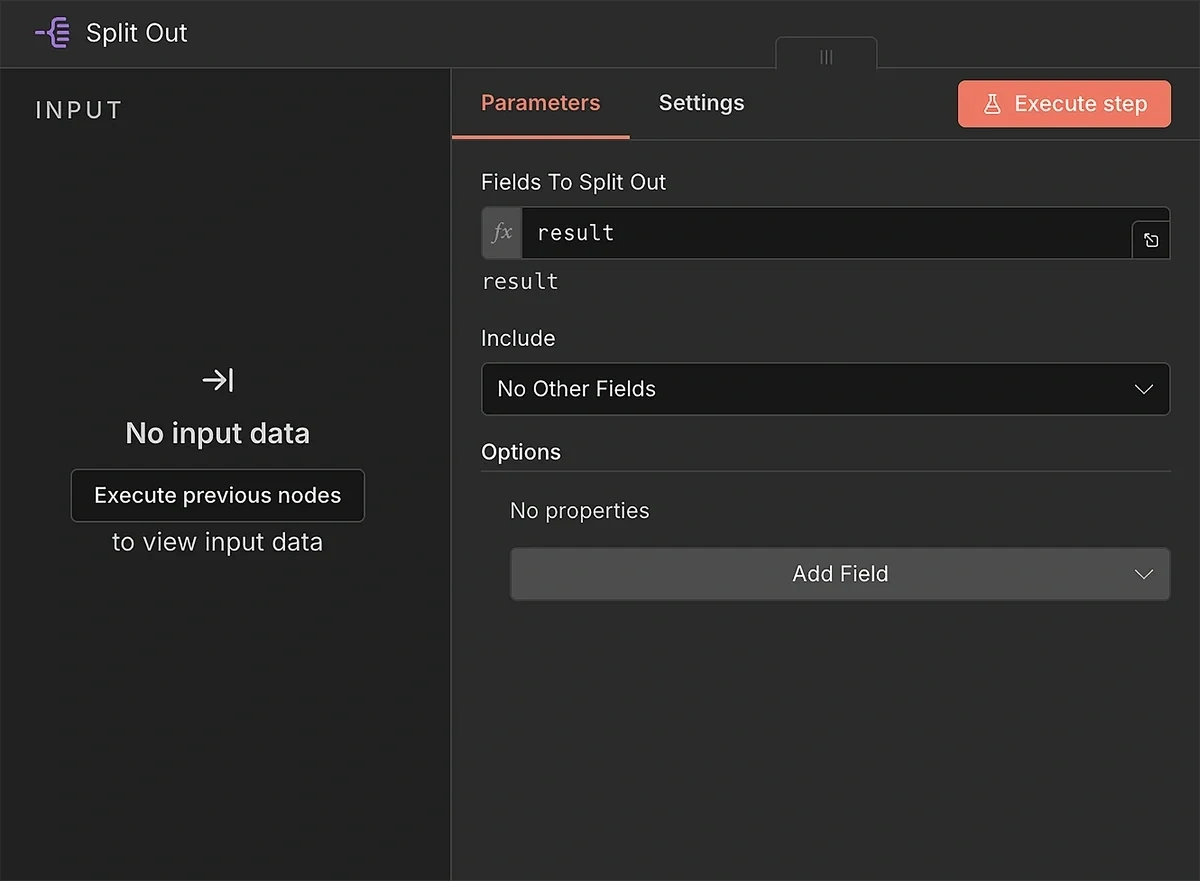
Type in “result” in Fields to Split Out. This ensures that the node looks for the correct field from the API when separating trends into multiple individual ones.
Next, insert the Merge node.
This is where the two branching paths that started from the parser and the Get row nodes will merge into one.
Naturally, the Merge operation needs two inputs. Follow this order for the input connections:
- Split out output > Merge input 1
- Get row(s) in sheet output > Merge input 2
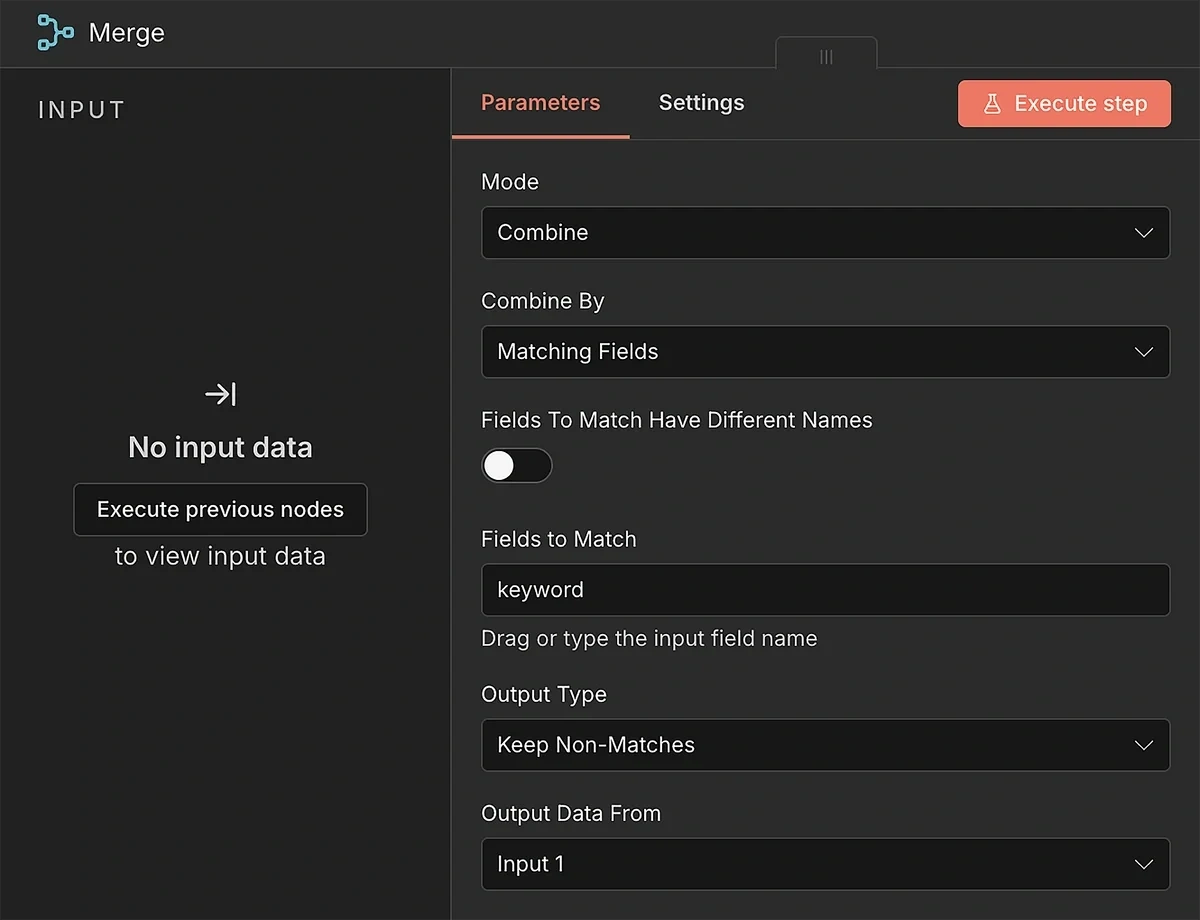
Update the parameter fields to combine data from the two data streams and retain only the unique trends that aren’t already in your log:
- Mode: Combine
- Combine By: Matching Fields
- Fields to Match Have Different Names: (turned off)
- Fields to Match: keyword
- Output Type: Keep Non-Matches
- Output Data From: Input 1
With these settings, the Merge node will take care of passing new trends forward for every run.
We’ll still need to add a filtering logic so that we only retrieve trends having a minimum growth and volume level.
This can be handled by another JavaScript code, connected to the output of the Merge node.
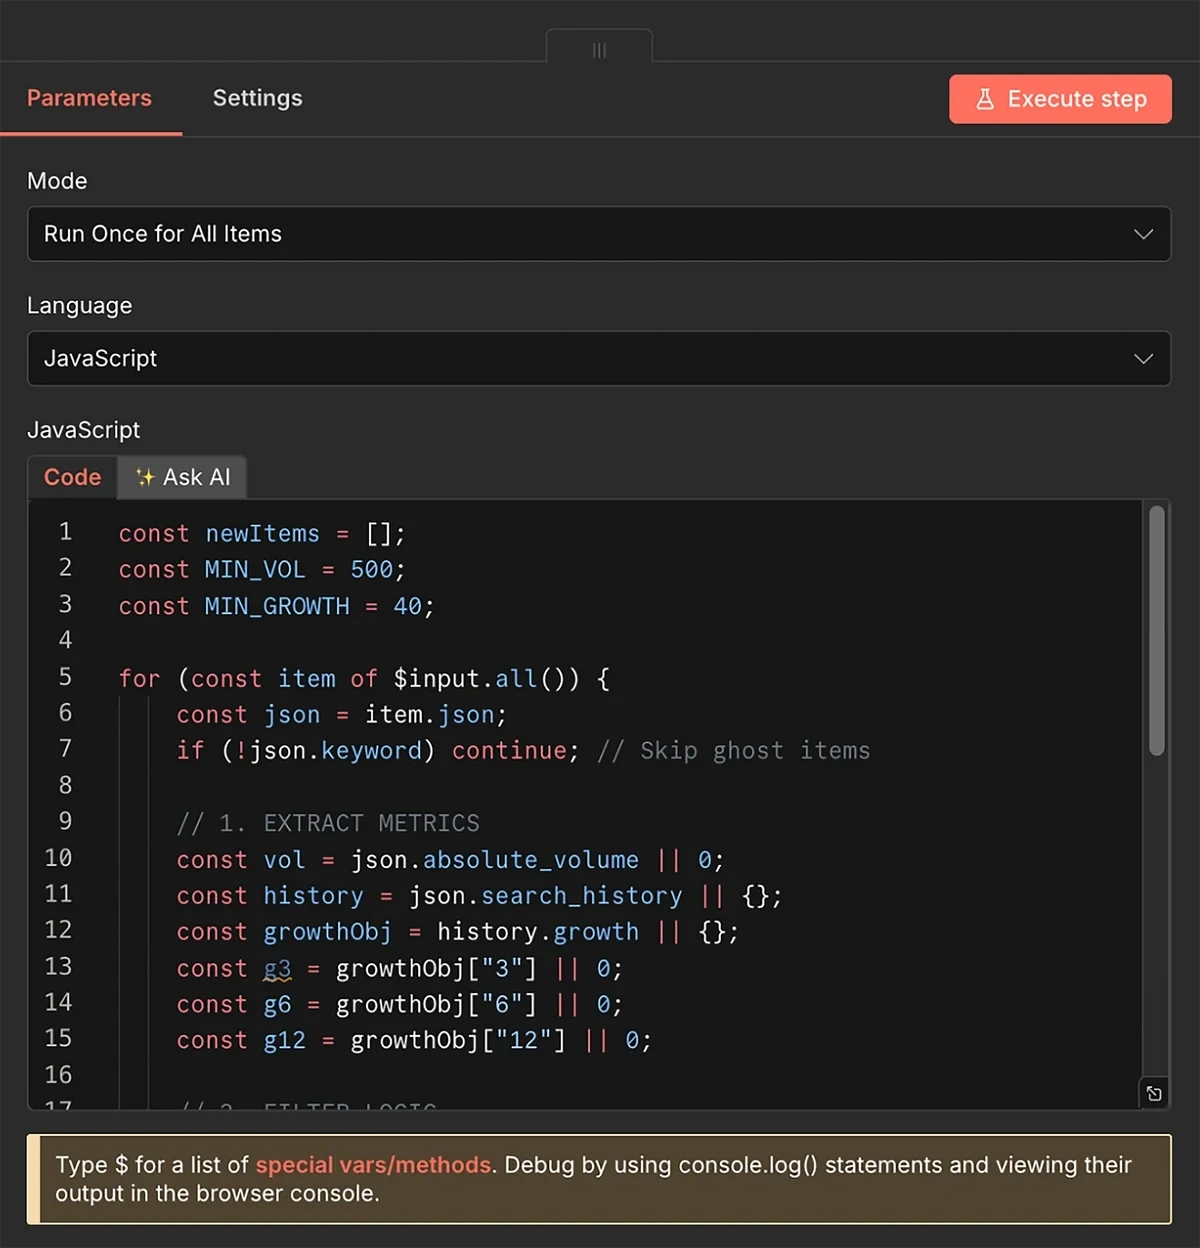
const newItems = [];
const MIN_VOL = 500;
const MIN_GROWTH = 40;

for (const item of $input.all()) {
    const json = item.json;
    if (!json.keyword) continue; // Skip ghost items

    // 1. EXTRACT METRICS
    const vol = json.absolute_volume || 0;
    const history = json.search_history || {};
    const growthObj = history.growth || {};
    const g3 = growthObj["3"] || 0;
    const g6 = growthObj["6"] || 0;
    const g12 = growthObj["12"] || 0;

    // 2. FILTER LOGIC
    if (vol < MIN_VOL) continue;
    if (g6 < MIN_GROWTH) continue;

    // 3. CLEAN OUTPUT
    newItems.push({
        json: {
            keyword: json.keyword,
            volume: vol,
            growth: g6,
            status: "Done",
            date_added: new Date().toISOString().split('T')[0],
            // Context for AI
            description: json.description || "",
            growth_6mo: g6,
            growth_12mo: g12,
            related_trends: (json.related_trends || []).slice(0, 10)
        }
    });
}
return newItems;
The filter code I’m using accepts trends with a search volume of 500 and a minimum growth of 40%.
Trends that meet these criteria are unlikely to be too competitive while still growing fast enough to reach increasing levels of popularity in the months to come.
These are the trends that most content marketing teams would want to target.
That said, you can play around with the filters if you’d rather use different volume and growth thresholds. You’ll just have to change the numeric values in these two lines of the code:
const MIN_VOL = 500;
const MIN_GROWTH = 40;
At this point, your automation flow should look something like this:
7. Send Trend Data to AI Agent
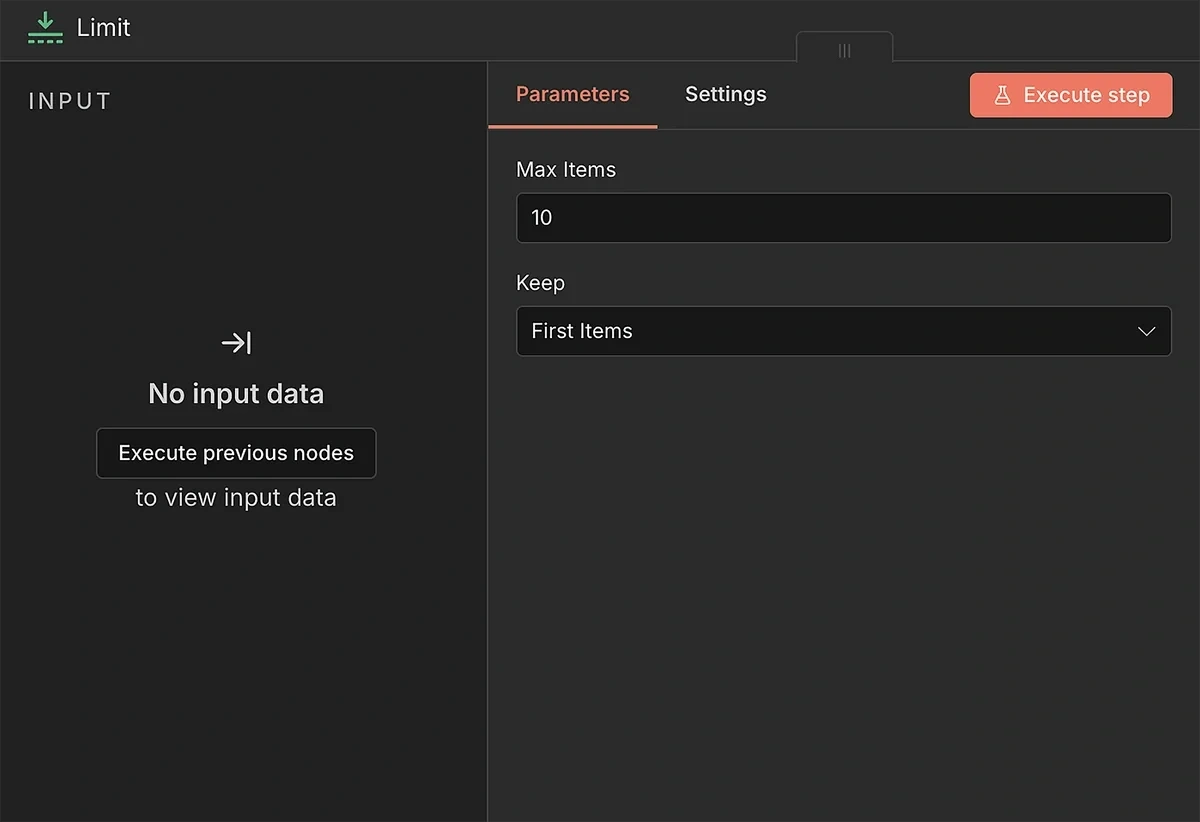
Before the AI can process the trend data to generate briefs, I recommend adding a preliminary step for placing data limits.
The Exploding Topics API request URL we generated earlier retrieves up to 50 search trends at a time.
In most cases, 50 briefs a month would be quite the overkill.
You need to add some cost and API credit control depending on your budget and capacity.
The Limit node lets you control how many search trends you want to send to the AI agent for brief generation.
I use a limit of around 10 items, which is manageable from both AI credits and your production capacity standpoint.
Additionally, we need to ensure the AI agent receives data for only one search trend at a time, so it doesn’t get overwhelmed and hit rate limits.
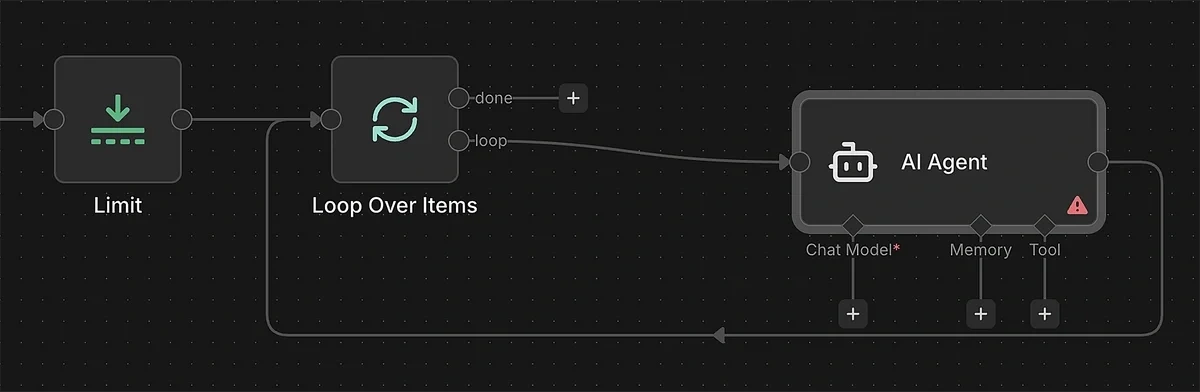
Add the “Loop Over Items (Split in Batches)” and connect it to the output of the Limit node.
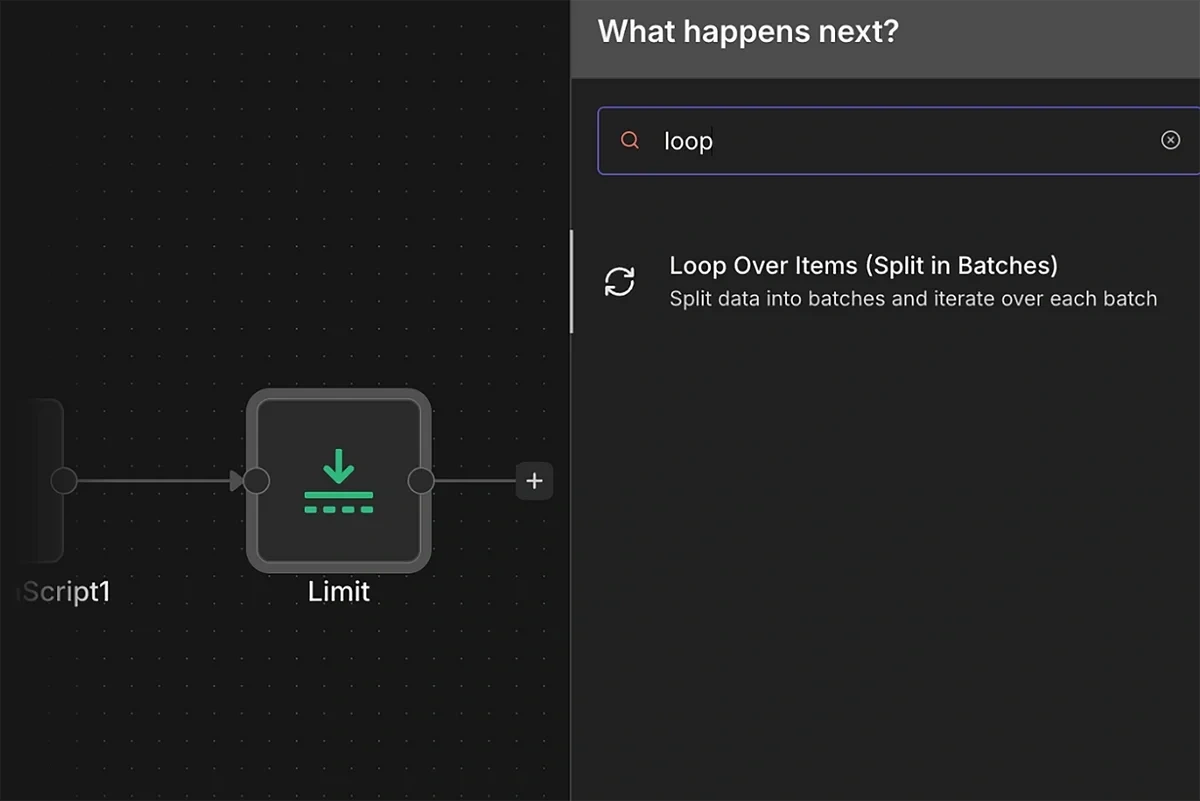
Leave the Batch Size to the default at 1 so the incoming stream of trend data is sent one by one to the AI.
8. Generate Trend Topic Briefs with AI
Connect the loop output of the previous node to the AI Agent node.
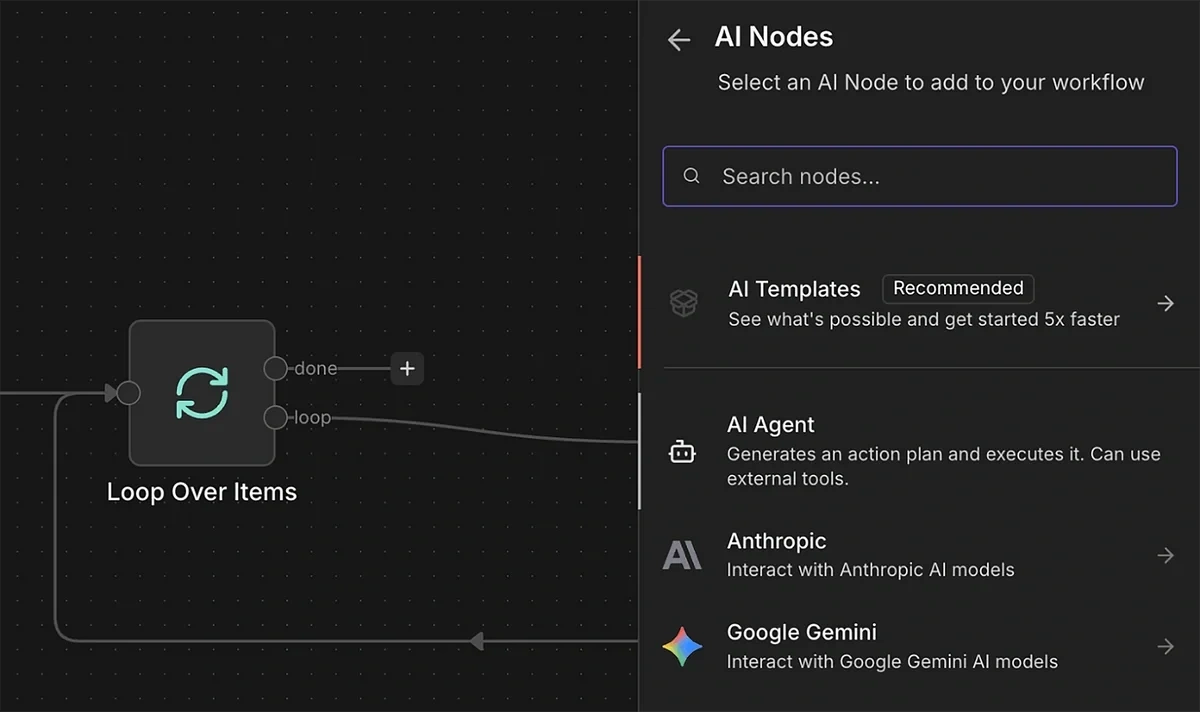
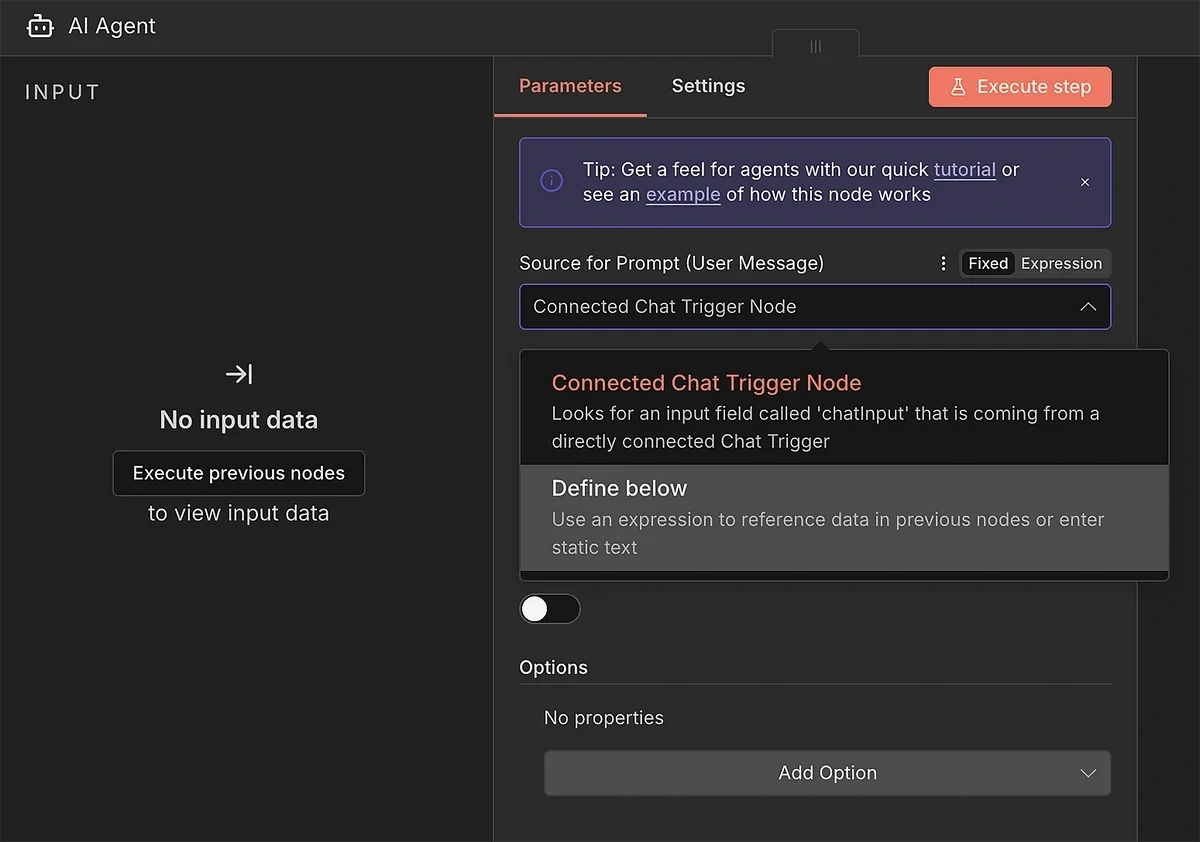
Click open the AI Agent parameters. Set the “Source for Prompt” to “Define below”.
This will let you enter a custom AI prompt with instructions for using the data input to generate a high-quality content brief.
Here’s the prompt I used:
You are an expert SEO Content Strategist. Create a high-level Content Brief.
### 1. THE TOPIC DATA
* **Main Topic:** {{ $json.keyword }}
* **Definition:** {{ $json.description }}
* **Search Volume:** {{ $json.volume }}
* **Growth (6mo):** {{ $json.growth }}% (This is a "Hot" trend)
* **Growth (12mo):** {{ $json.growth_12mo }}%
### 2. RELATED TRENDS (CRITICAL)
* These are rising sub-topics related to the main keyword:
* {{ $json.related_trends.length > 0 ? JSON.stringify($json.related_trends) : "No related trends provided." }}
### 3. YOUR TASK
**Step 1: RESEARCH**
* Use Google Search to analyze the Top 10 results for "{{ $json.keyword }}".
* Determine the User Intent (informational, transactional, commercial etc.).
**Step 2: STRATEGY**
* Find a "Content Gap": What are competitors missing?
* **Mandatory:** If "Related Trends" (Section 2) has data, you MUST pick at least 1 (preferably more) of them and integrate them into the outline as H2s or H3s. Use the ones with the strongest semantic connection and that contribute to the depth of the content. Do not ignore them.
**Step 3: WRITE THE BRIEF (Markdown)**
* **Strategy Section:** Define Target Audience and Winning Angle.
* **Title Options:** Provide 3 clickable title ideas (No generic "Ultimate Guides").
* **Outline:** A detailed H2/H3 structure with content notes.
### OUTPUT INSTRUCTIONS
* **slug:** Write a short, kebab-case-slug.
* **title:** Write the best SEO title from your options.
* **markdown_body:** Write the full Strategy and Outline here.
It’s a very detailed prompt that doesn’t leave anything ambiguous for the AI model. The instructions for the output format are deliberate and ensure the output is generated in a structured format.
I also recommend adding a system prompt to guide AI behavior when it’s interpreting provided data for brief generation.
Click “Add Option” and select “System Message”.
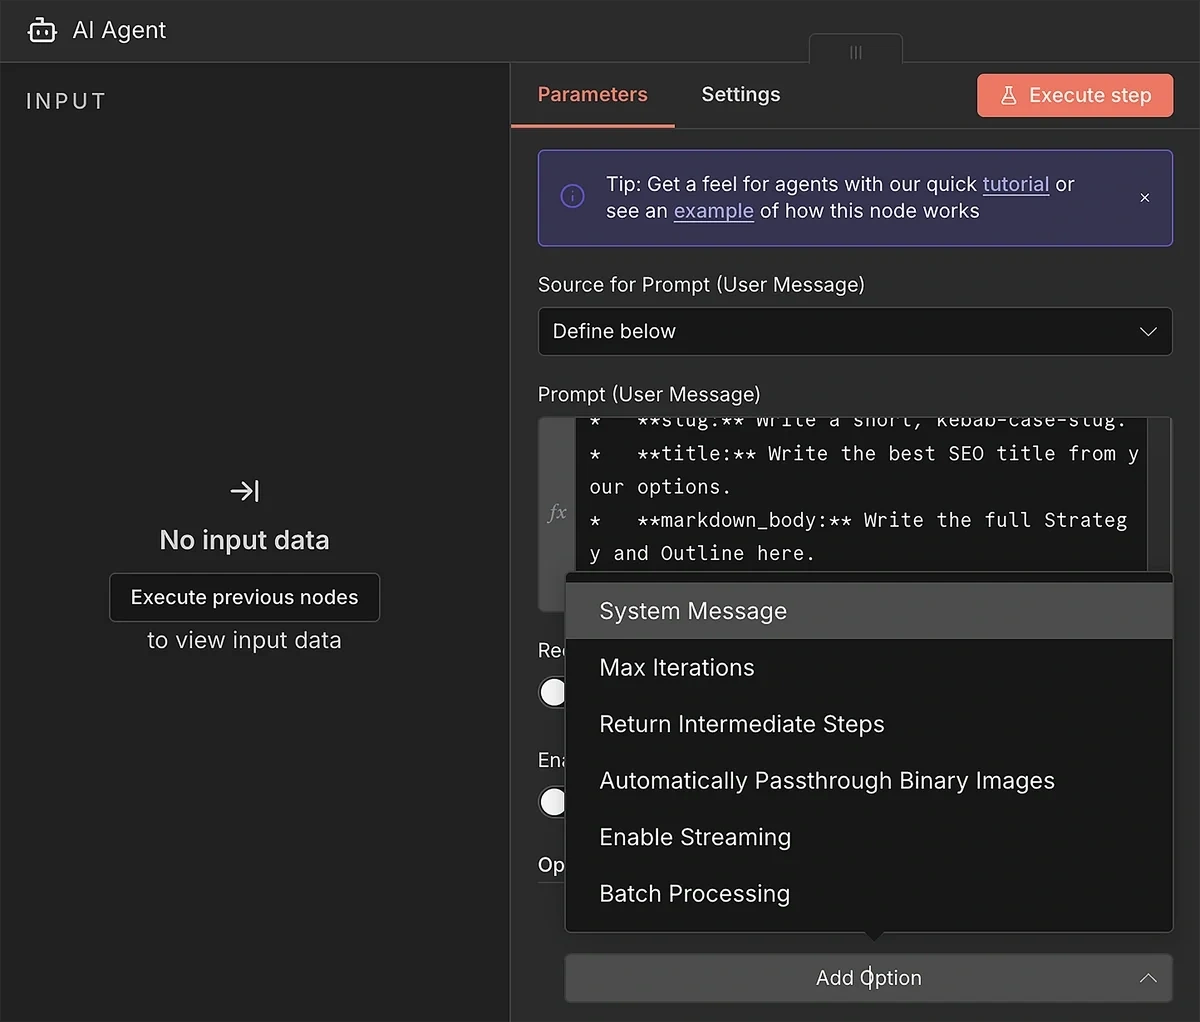
Copy-paste this prompt into the System Message textbox:
You are a Senior Content Strategist and Subject Matter Expert. Your job is not to fill templates, but to design the most comprehensive, helpful, and high-ranking resource on the internet for a given topic.
Your Philosophy:
1. SEMANTIC COMPLETENESS: You analyze the topic to understand the full scope of the user's problem. You do not just stuff keywords; you answer the question behind the search.
2. DYNAMIC STRUCTURE: You determine the outline structure based solely on the topic's demands. A "How-to" topic gets a step-by-step structure; a "Definition" topic gets a conceptual deep-dive; a "Comparison" gets a feature breakdown.
3. DATA SYNTHESIS: You have access to "Current Search Results" (what exists) and "Exploding Trends" (what is rising). You must synthesize these. Use Exploding Trends to add cutting-edge value, but only if they fit naturally. If they are irrelevant, discard them.
Once that’s done, close the current model. Click on the “+” icon under Chat Model.
You can select any model that you prefer. I recommend using an OpenAI model because it gives you built-in tools like web search as well.
Use your API credentials to connect the AI model with n8n. After you’re connected, you can select a specific model from the dropdown.
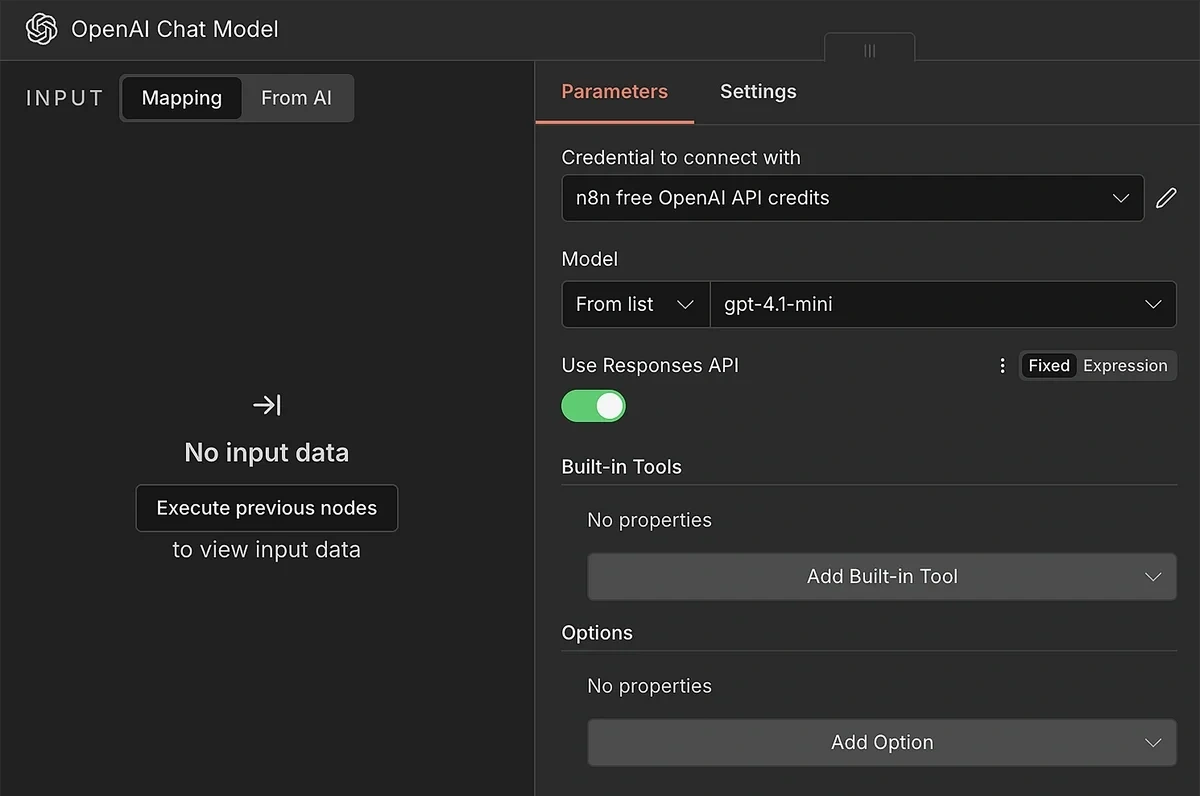
If you’re using an OpenAI model, it’s a good idea to enable the “Use Responses API” toggle. Doing so will allow you to use built-in tools.
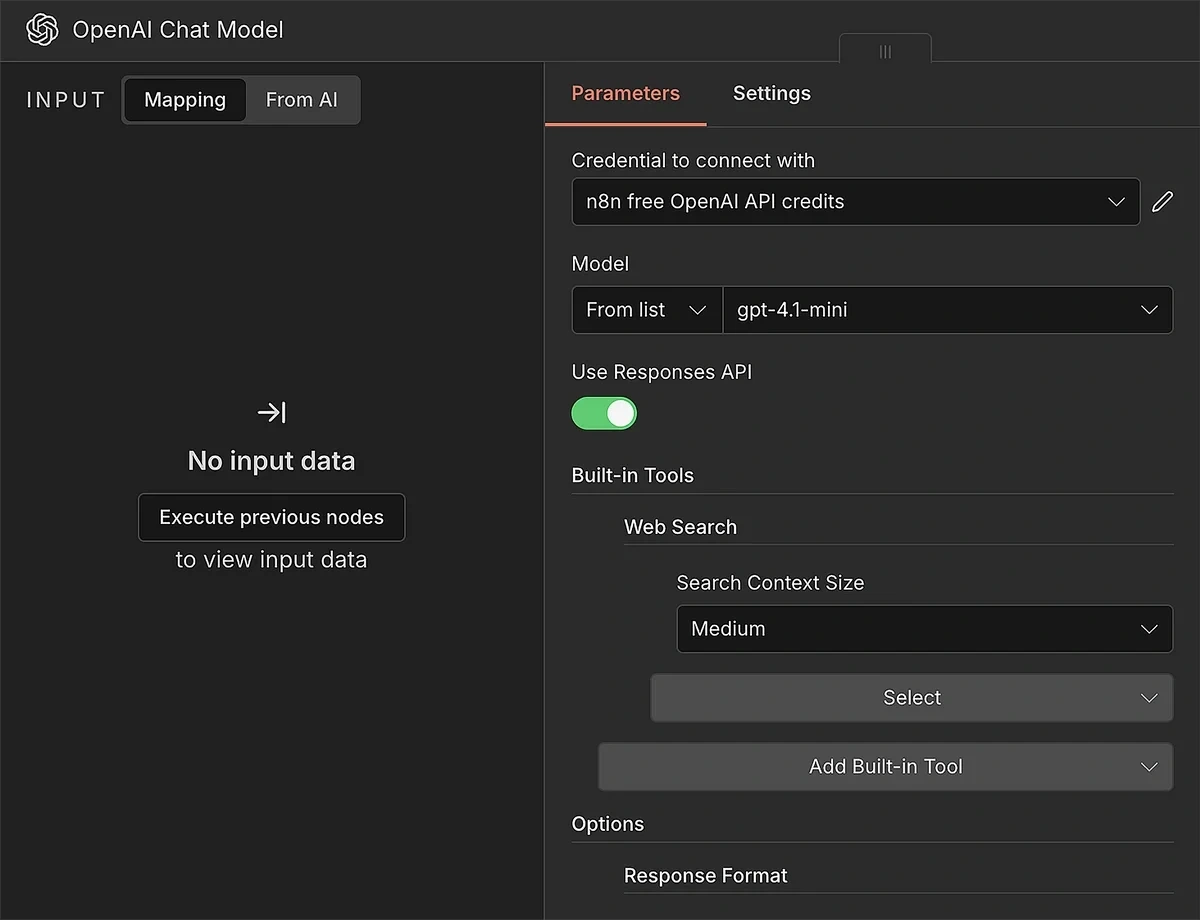
Click open the “Add Built-in Tool” menu and choose “Web Search”.
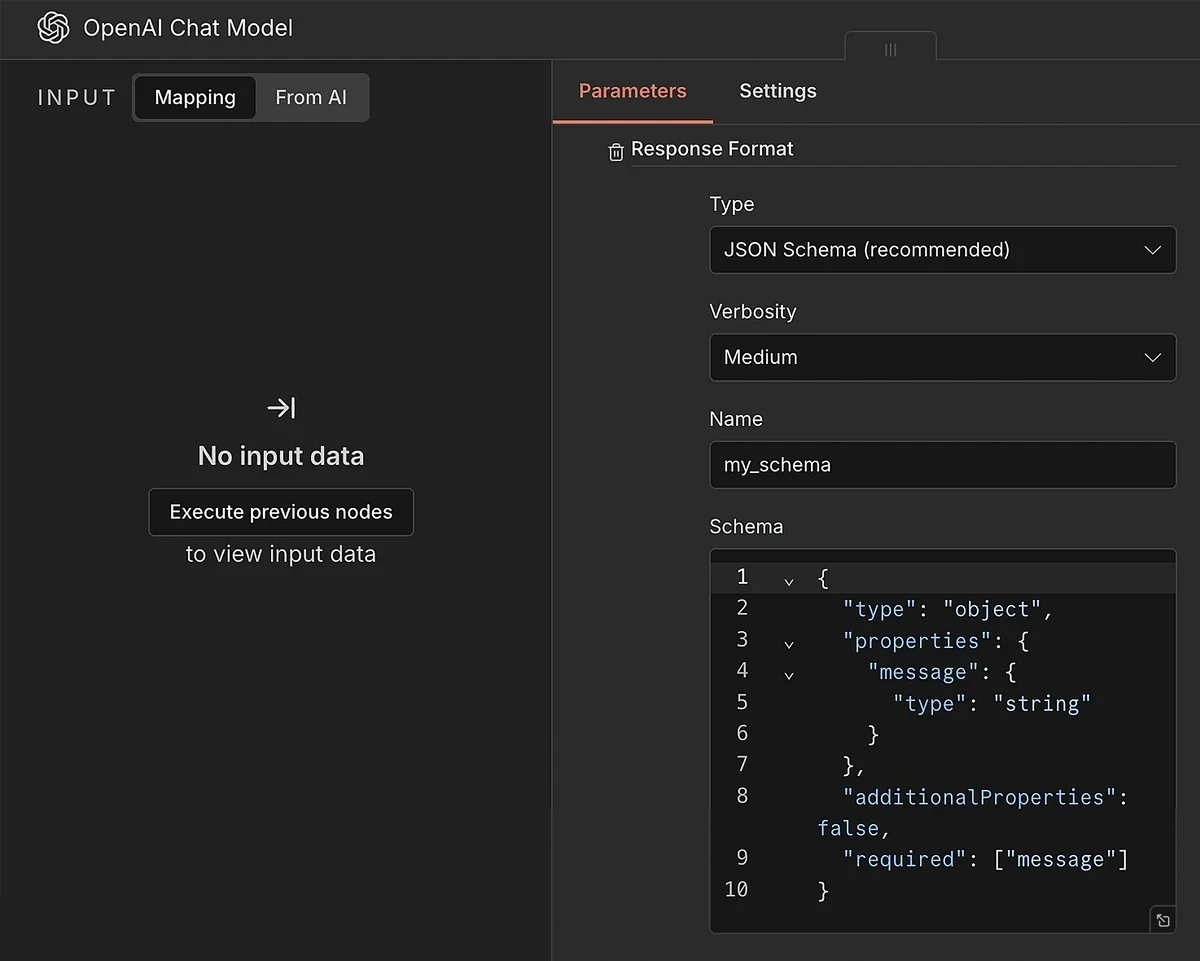
We also need to require the chat model to produce output in schema format.
Select “Response Format” from the Add Options menu. The format we need is “JSON Schema (recommended)”.
A verbosity level of medium is reasonable.
Enter a name for your schema (without spaces). Then, copy-paste the following JSON schema into the box:
{
  "type": "object",
  "properties": {
    "message": {
      "type": "string"
    }
  },
  "additionalProperties": false,
  "required": ["message"]
}
This completes the AI model configuration.
We just need to take the output from the AI and upload the brief file to Drive now.
9. Upload the Content Brief and Update Content Log Sheet
The AI model will generate the brief, but it needs a few additional operations to convert the brief into an uploadable file.
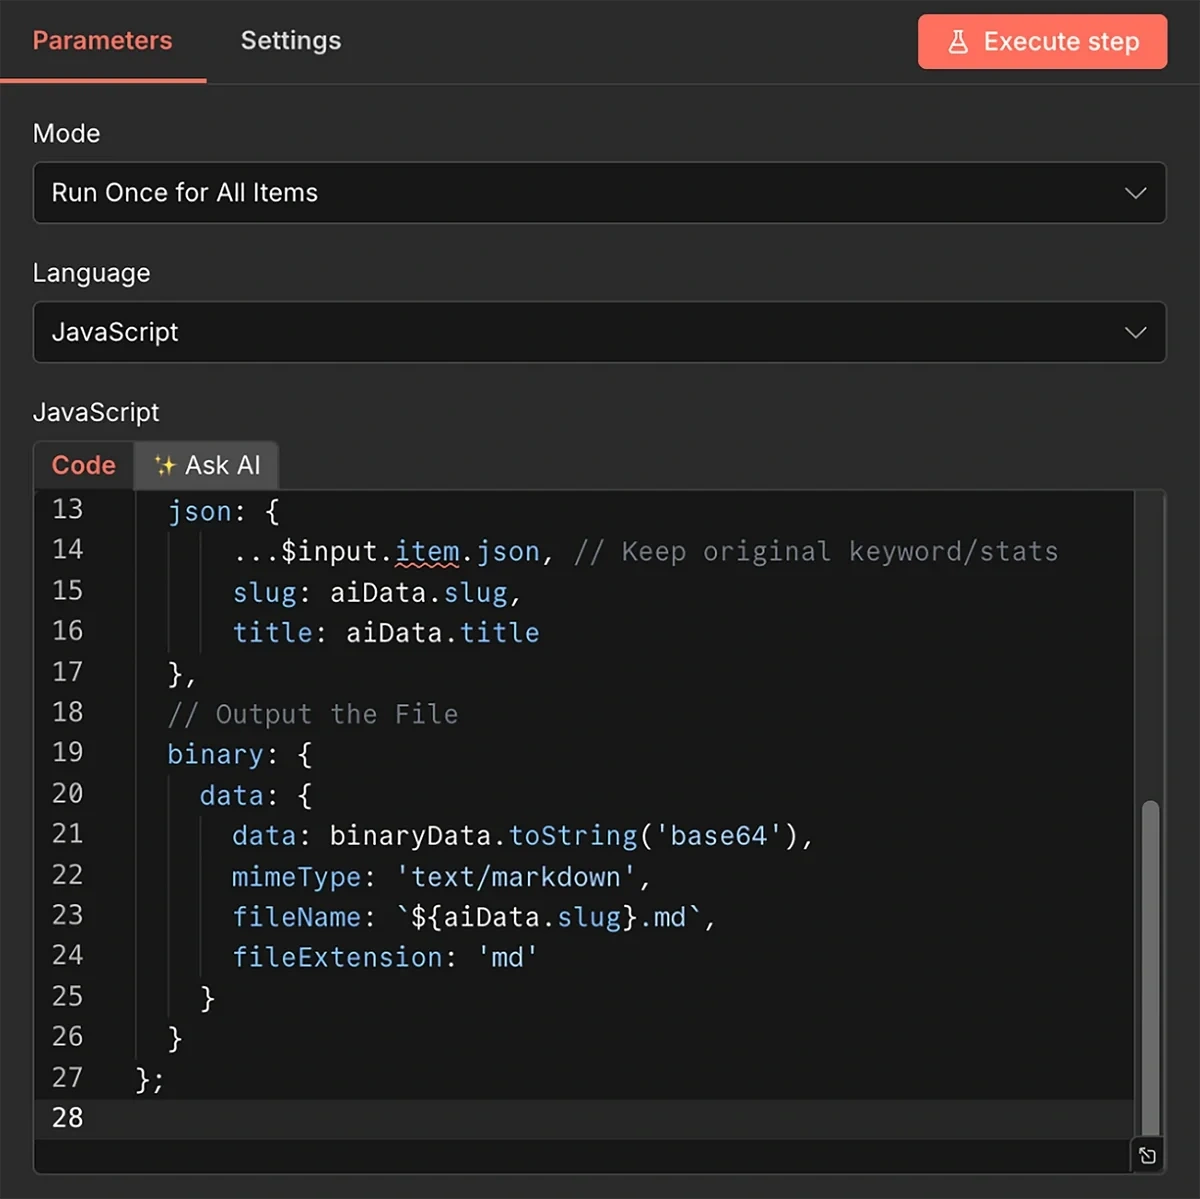
To do this, we’ll first add JavaScript code immediately after the AI model. Insert code into this component:
// 1. Get the stringified JSON from the AI output
const rawString = $input.item.json.output;

// 2. Parse it into a real Object
const aiData = JSON.parse(rawString);

// 3. Create the File Content (Title + Body)
const fileContent = `# ${aiData.title}\n\n${aiData.markdown_body}`;
const binaryData = Buffer.from(fileContent, 'utf8');

return {
  // Output flattened JSON so Google Drive can easily see {{ $json.slug }}
  json: {
      ...$input.item.json, // Keep original keyword/stats
      slug: aiData.slug,
      title: aiData.title
  },
  // Output the File
  binary: {
    data: {
      data: binaryData.toString('base64'),
      mimeType: 'text/markdown',
      fileName: `${aiData.slug}.md`,
      fileExtension: 'md'
    }
  }
};
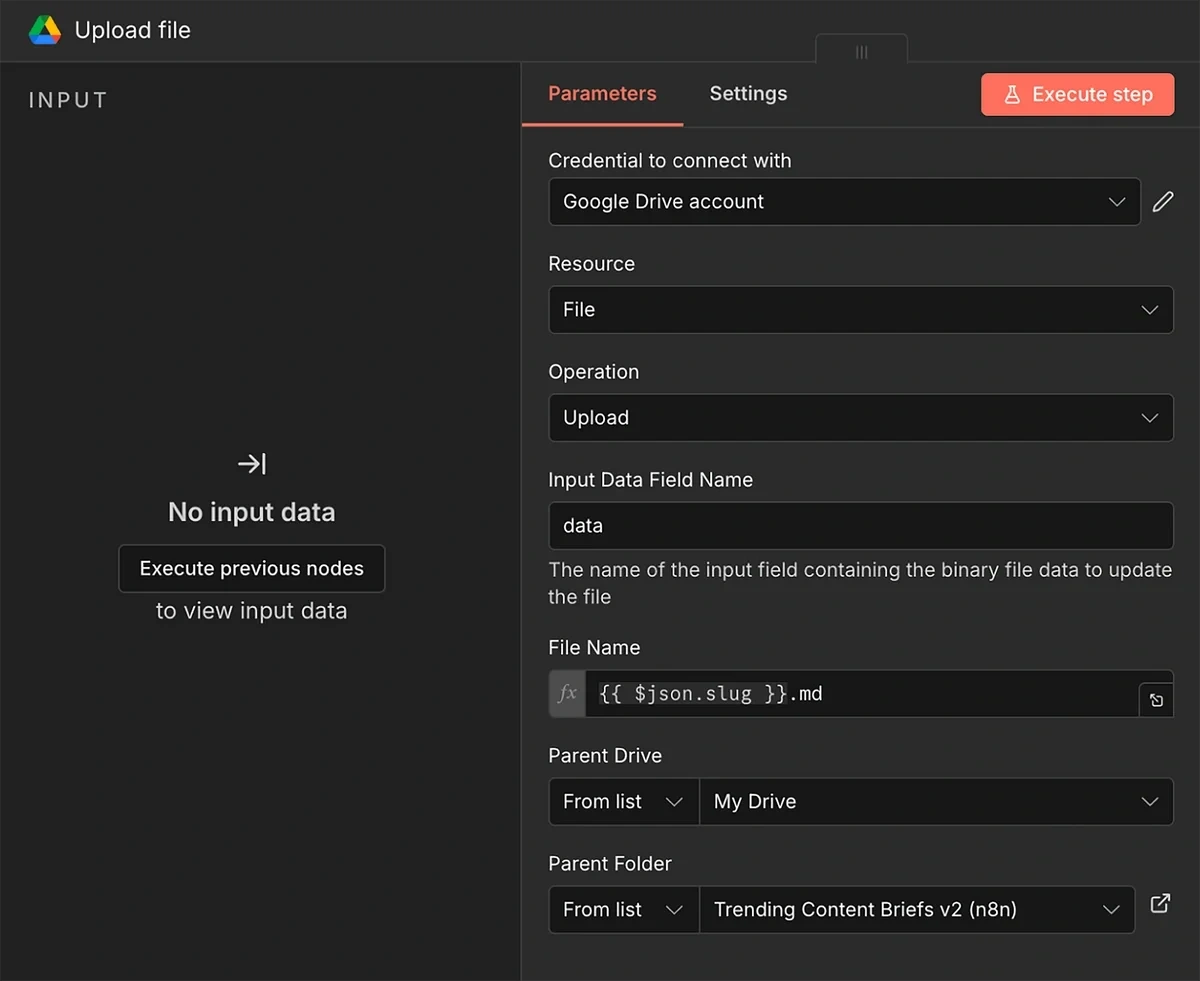
Next in the series is the Google Drive node, with the Upload File action. The goal is to update the spreadsheet for your record and also to avoid retrieving duplicate trends during the next runs.
You should already be connected to your Google Drive account since you previously connected Google Sheets in step 5.
All you have to do is configure the file upload field parameters:
- Resource: File
- Operation: Upload
- Input Data Field Name: data
- File Name: {{ $json.slug }}.md
- Parent Drive: Select the drive for upload
- Parent Folder: Select the folder for upload
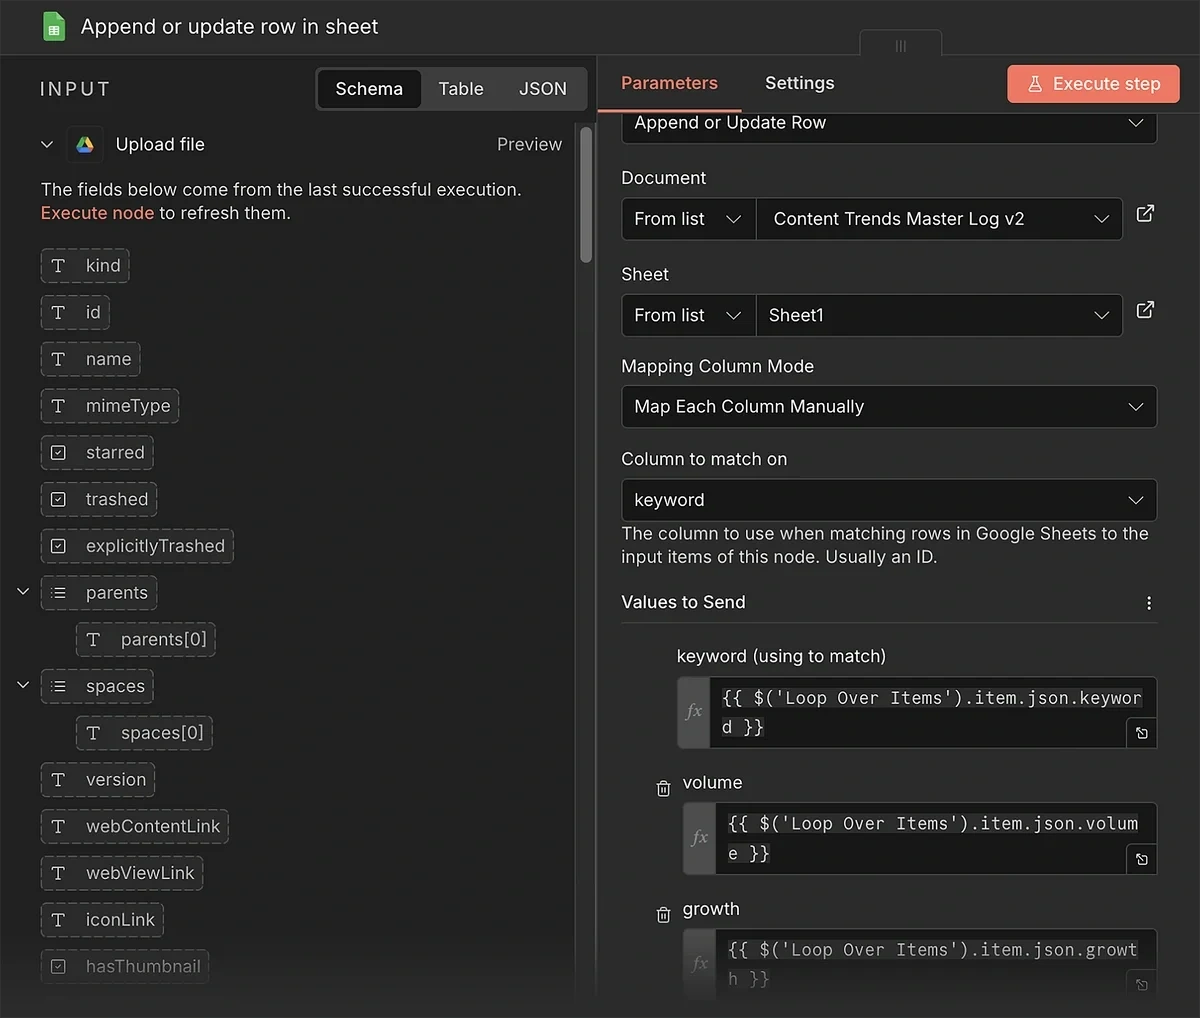
Finally, you need another Google Sheet node. Select the “Append or update row in sheet” action for this step.
In the parameter panel, select the spreadsheet you created in step 2.
After that, choose the manual method for “Mapping Column Mode”, and enter “keyword” in the Column to Match on field.
We need to map data from the Loop Over Items node to the columns in this sheet. Here are the corresponding values for each column:
- keyword: {{ $('Loop Over Items').item.json.keyword }}
- volume: {{ $('Loop Over Items').item.json.volume }}
- growth: {{ $('Loop Over Items').item.json.growth }}
- date_added: {{ $('Loop Over Items').item.json.date_added }}
- status: Done
The setup is now complete. Don’t forget to save your workflow and run a test execution.
If everything looks good, you can publish the workflow so it automatically runs on a schedule, churning out new content briefs and uploading them to our Drive folder.
Your content team can then take over the production based on the brief.
While these briefs are generally decent, I still recommend reviewing each brief manually.
You also have the flexibility to connect this workflow to another one in n8n, such as an automation for blog post generation.
But that’s up to you.
Automate Content Trend Detection Now
The Exploding Topics API gives you access to a goldmine of trending content ideas that give you an edge among competitors.
This automation is only one example of what you can achieve with the Exploding Topics API. You can create similar workflows to automate trend detection for products or startups as well.
Get your Exploding Topics API key today.
Stop Guessing, Start Growing 🚀
Use real-time topic data to create content that resonates and brings results.

Exploding Topics is owned by Semrush. Our mission is to provide accurate data and expert insights on emerging trends. Unless otherwise noted, this page’s content was written by either an employee or a paid contractor of Semrush Inc.
Share
Newsletter Signup
By clicking “Subscribe” you agree to Semrush Privacy Policy and consent to Semrush using your contact data for newsletter purposes
Written By


Osama is an experienced writer and SEO strategist at Exploding Topics. He brings over 8 years of digital marketing experience, spe... Read more