


Get Advanced Insights on Any Topic
Discover Trends 12+ Months Before Everyone Else
How We Find Trends Before They Take Off
Exploding Topics’ advanced algorithm monitors millions of unstructured data points to spot trends early on.

Keyword Research
Performance Tracking
Competitor Intelligence
Fix Your Site’s SEO Issues in 30 Seconds
Find technical issues blocking search visibility. Get prioritized, actionable fixes in seconds.
Powered by data from
Latest Blog Posts
Featured Case Studies
See what's trending before everyone else
Each week, we'll send you our best Exploding Topics. Plus, expert insight and analysis.
How to Measure SEO Performance in 2025

SEO produces a ton of data that you can use to measure your progress over time.
The challenge is that you can fall into the trap of tracking too many variables.
The key is focusing on meaningful SEO metrics that actually reveal your performance trends and offer clarity for making decisions.
In this post, you’ll learn about the most important SEO metrics you should track. I’ll also touch on tracking important SEO metrics for AI answer engines.
Key SEO Performance Metrics & How to Measure Them
1. Organic Traffic
Organic traffic is the web traffic you drive from unpaid search engine results. Traditionally, it’s the most direct way to measure your SEO performance.
When your organic traffic is healthy, it’s the strongest sign that your website has a prominent search presence for queries your audience is interested in.
GA4 gives you the most accurate way to measure organic traffic.
In your GA4 dashboard, you can navigate to “Reports” and click the “Acquisition” dropdown under “Lifecycle”.
Then, select “Traffic acquisition”.
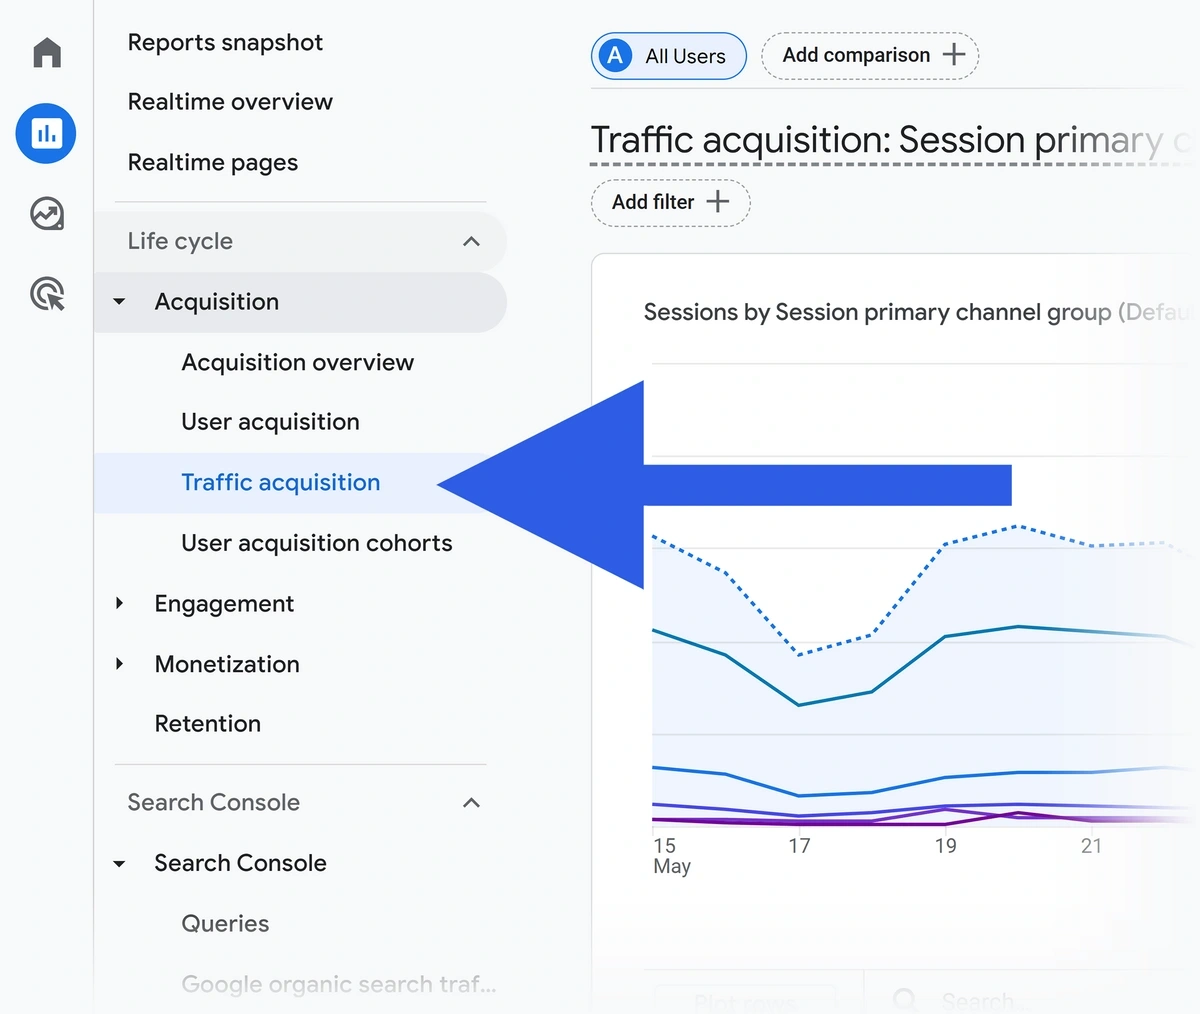
This report will show you a trend chart for your traffic from different sources, including organic. You’ll also get a helpful breakdown in a table.
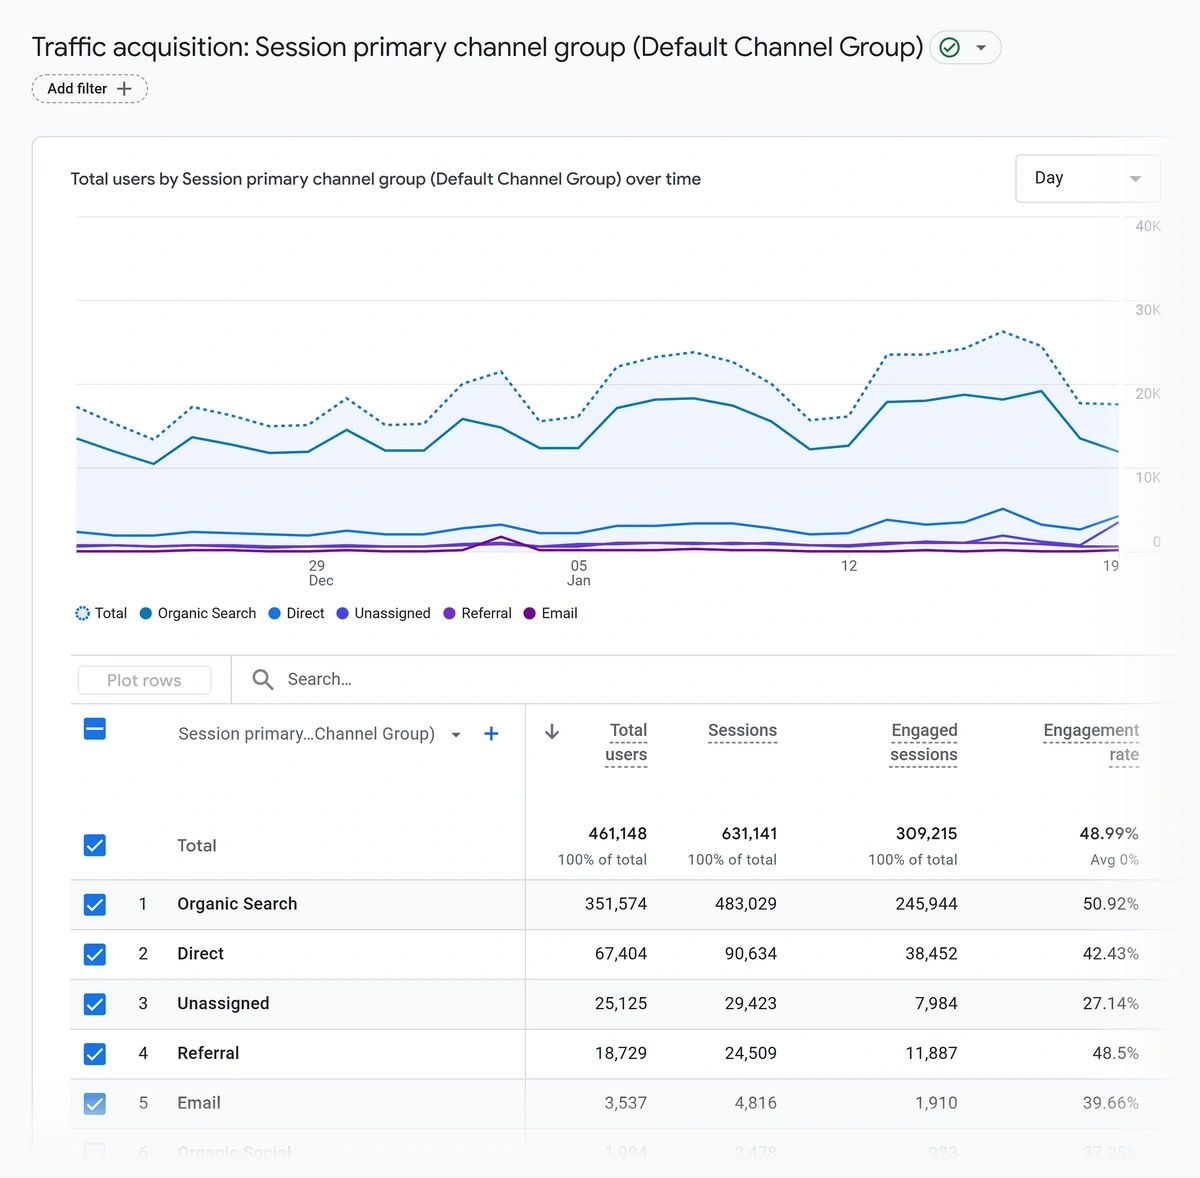
Note that in this report, GA4 uses ‘sessions’ as a measure of traffic.
To be precise, a session is simply a page view. A single session can involve multiple page views, until it times out when a user leaves your site or after 30 minutes of inactivity.
Pro Tip: The Traffic acquisition report is great for tracking your organic trends over time. Additionally, this report shows the percentage contribution of your organic traffic vs other channels. Use these insights to discover how your traffic sources are shifting to stay informed on your most effective discovery platforms.
What should be my organic traffic goal?
Before setting your traffic goals, you should establish a baseline and observe what the benchmarks are within your industry.
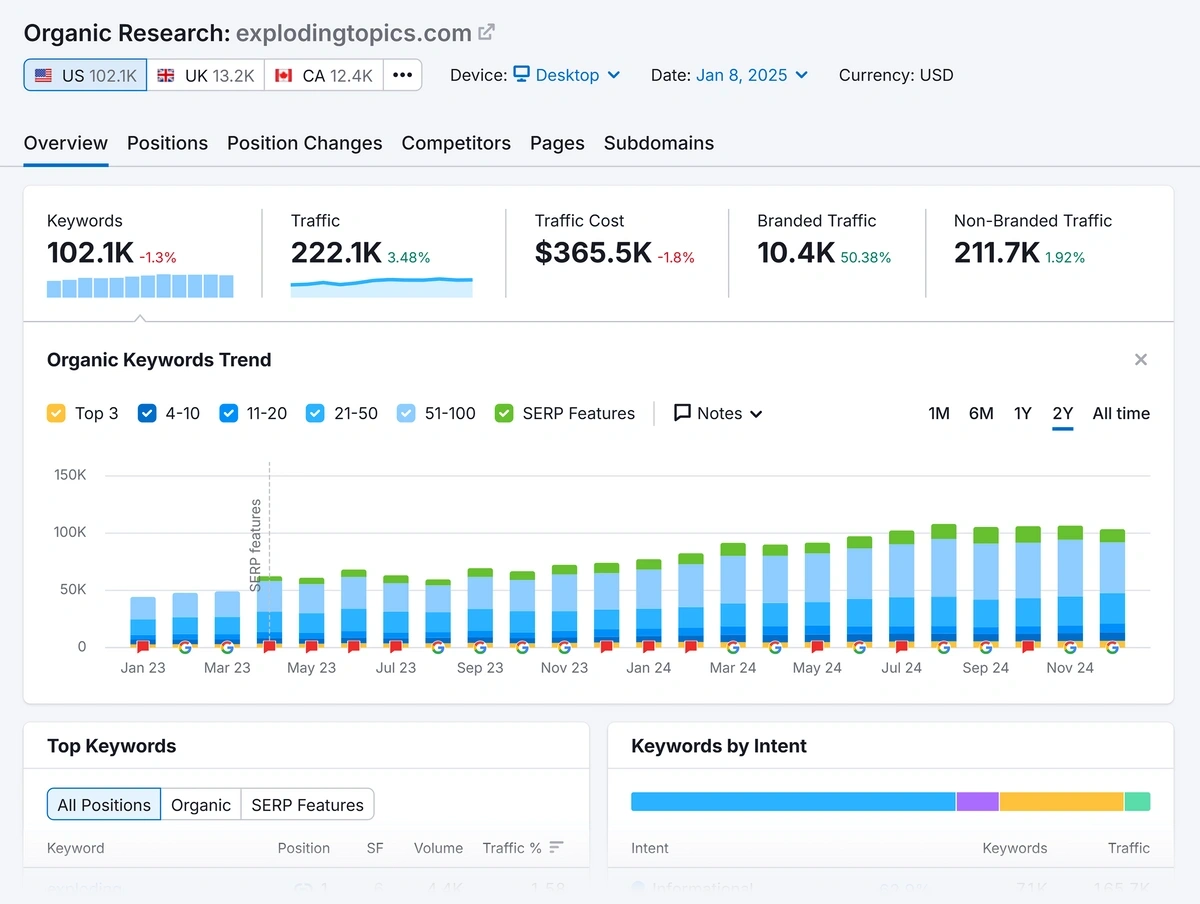
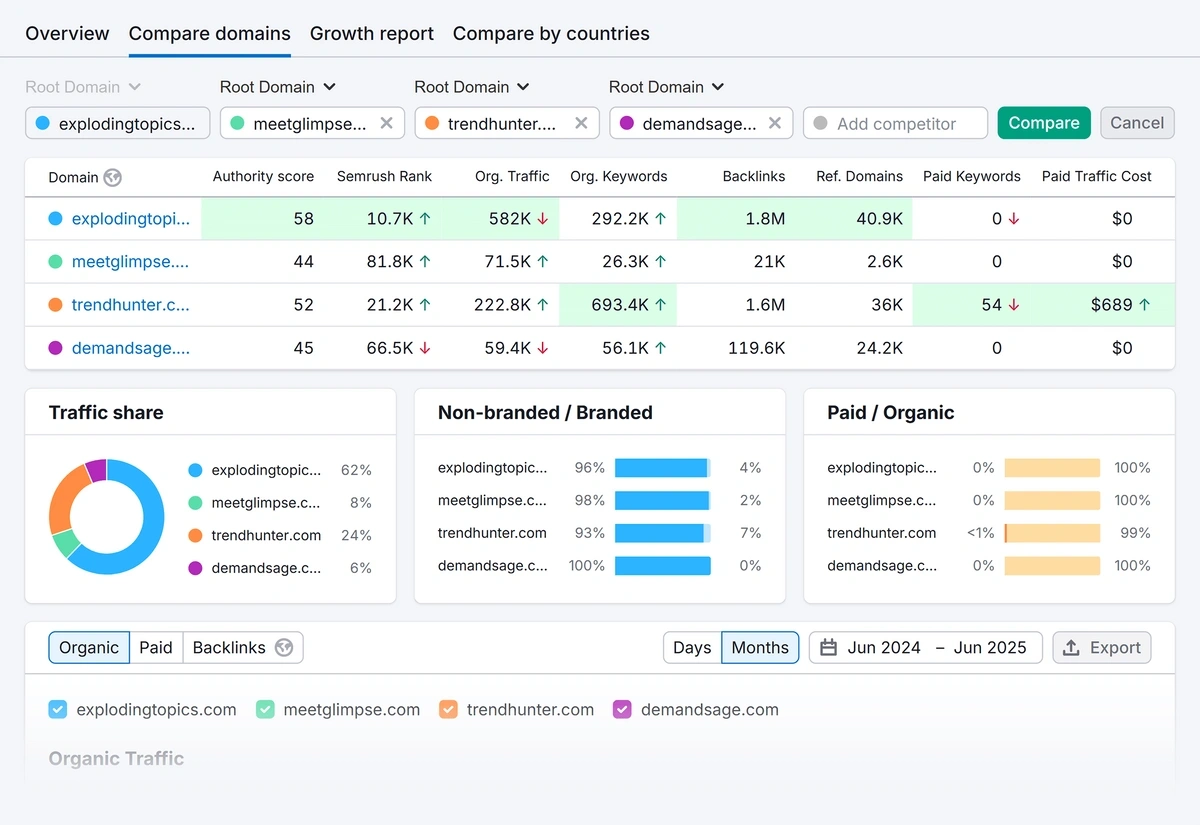
While GA4 can’t help you see competitor traffic, tools like Semrush are great for generating traffic trend lines that show where you stand compared to your competitors.
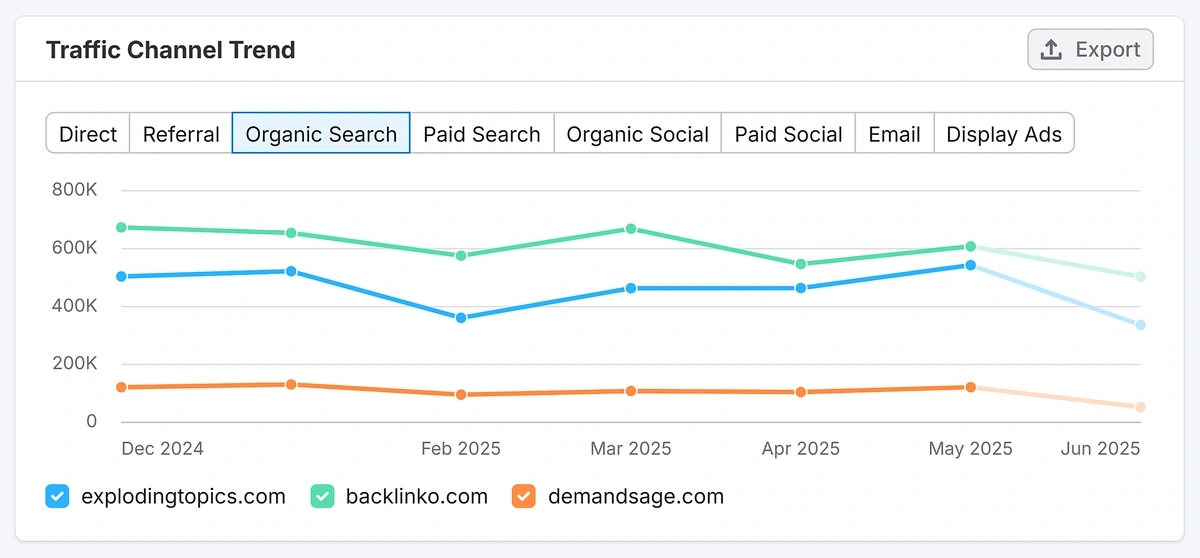
I use the Semrush Traffic & Market toolkit to discover traffic patterns in relation to competitors.
You can compare different traffic channels independently.
Or see the traffic distribution between main channels.
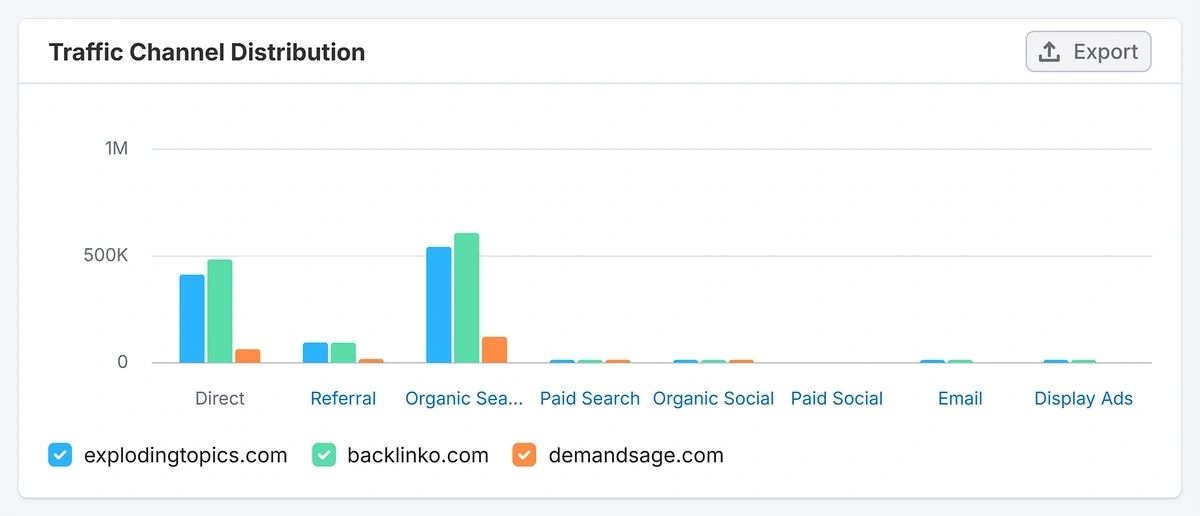
Remember that the Semrush traffic is only an estimate. It likely won’t match GA4 reported traffic values. That’s something Claire discussed in her Semrush review as well.
Regardless, Semrush traffic analytics is powerful for viewing your trends alongside your competitor’s.
Want to Spy on Your Competition?
Explore competitors’ website traffic stats, discover growth points, and expand your market share.
2. Keyword Rankings
Keyword rankings are the positions that a website holds in search engine results for specific search terms.
Higher rankings in Google usually mean more organic traffic.
Why track rankings if you can already see traffic?
Because traffic changes gradually and becomes clear only when measured over weeks or months.
In contrast, ranking shifts are immediately perceivable and reflect your visibility on SERPs right now.
It’s easy to predict the resulting effect on your traffic once you know how your keywords are changing.
This is why you need to track keywords so you can act before traffic has nosedived too far for it to become evident.
Traditionally, keyword tracking is focused on the classic Google SERP environment with the 10 blue links.
But as Google evolves into an AI search engine and LLMs like ChatGPT become more popular as sources of information, you’ll have to start thinking beyond simple position tracking.
What’s the best way to measure SEO rankings?
The best way to measure keyword rankings is to use specialized SEO tools like Semrush.
The Position Tracking tool in Semrush shows a simplified summary of how different keywords are positioned on SERPs.
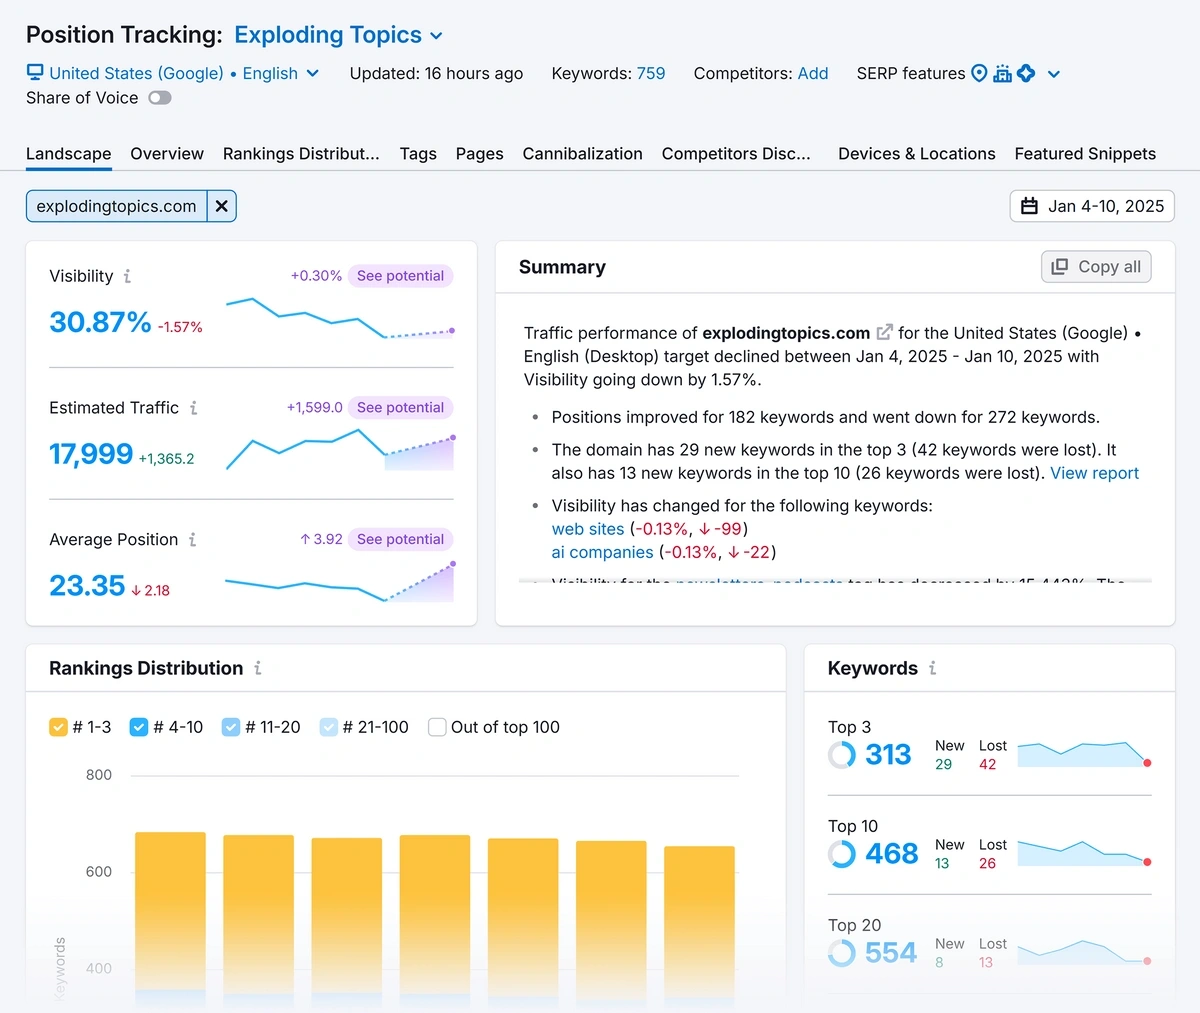
The visual tracking ensures that you won’t miss any important ranking changes. And it’s helpful to have your improving keywords and declining keywords organized into separate cards.
If you want to enhance your visibility in 2025 and beyond, you can use Semrush to extend your position tracking to:
- ChatGPT
- Baidu
- Bing
And you can track positions by desktop, mobile, and tablet in each of these search engines as well.
I strongly recommend tracking and monitoring your rankings on ChatGPT, along with Google at the very least.
This will help you understand which topics are surfacing more on AI search.
You can then discover patterns you can use to optimize your pages for discovery through ChatGPT and LLMs.
Very soon, tracking rankings and citations in Google AI Mode will become an important part of your SEO performance tracking.
While no reliable solutions exist at this moment, I’d expect Semrush and other tools to develop AI Mode ranking and citation tracking in the near future.
Get More Search Traffic
Use trending keywords to create content your audience craves.
3. SERP Features and Visibility
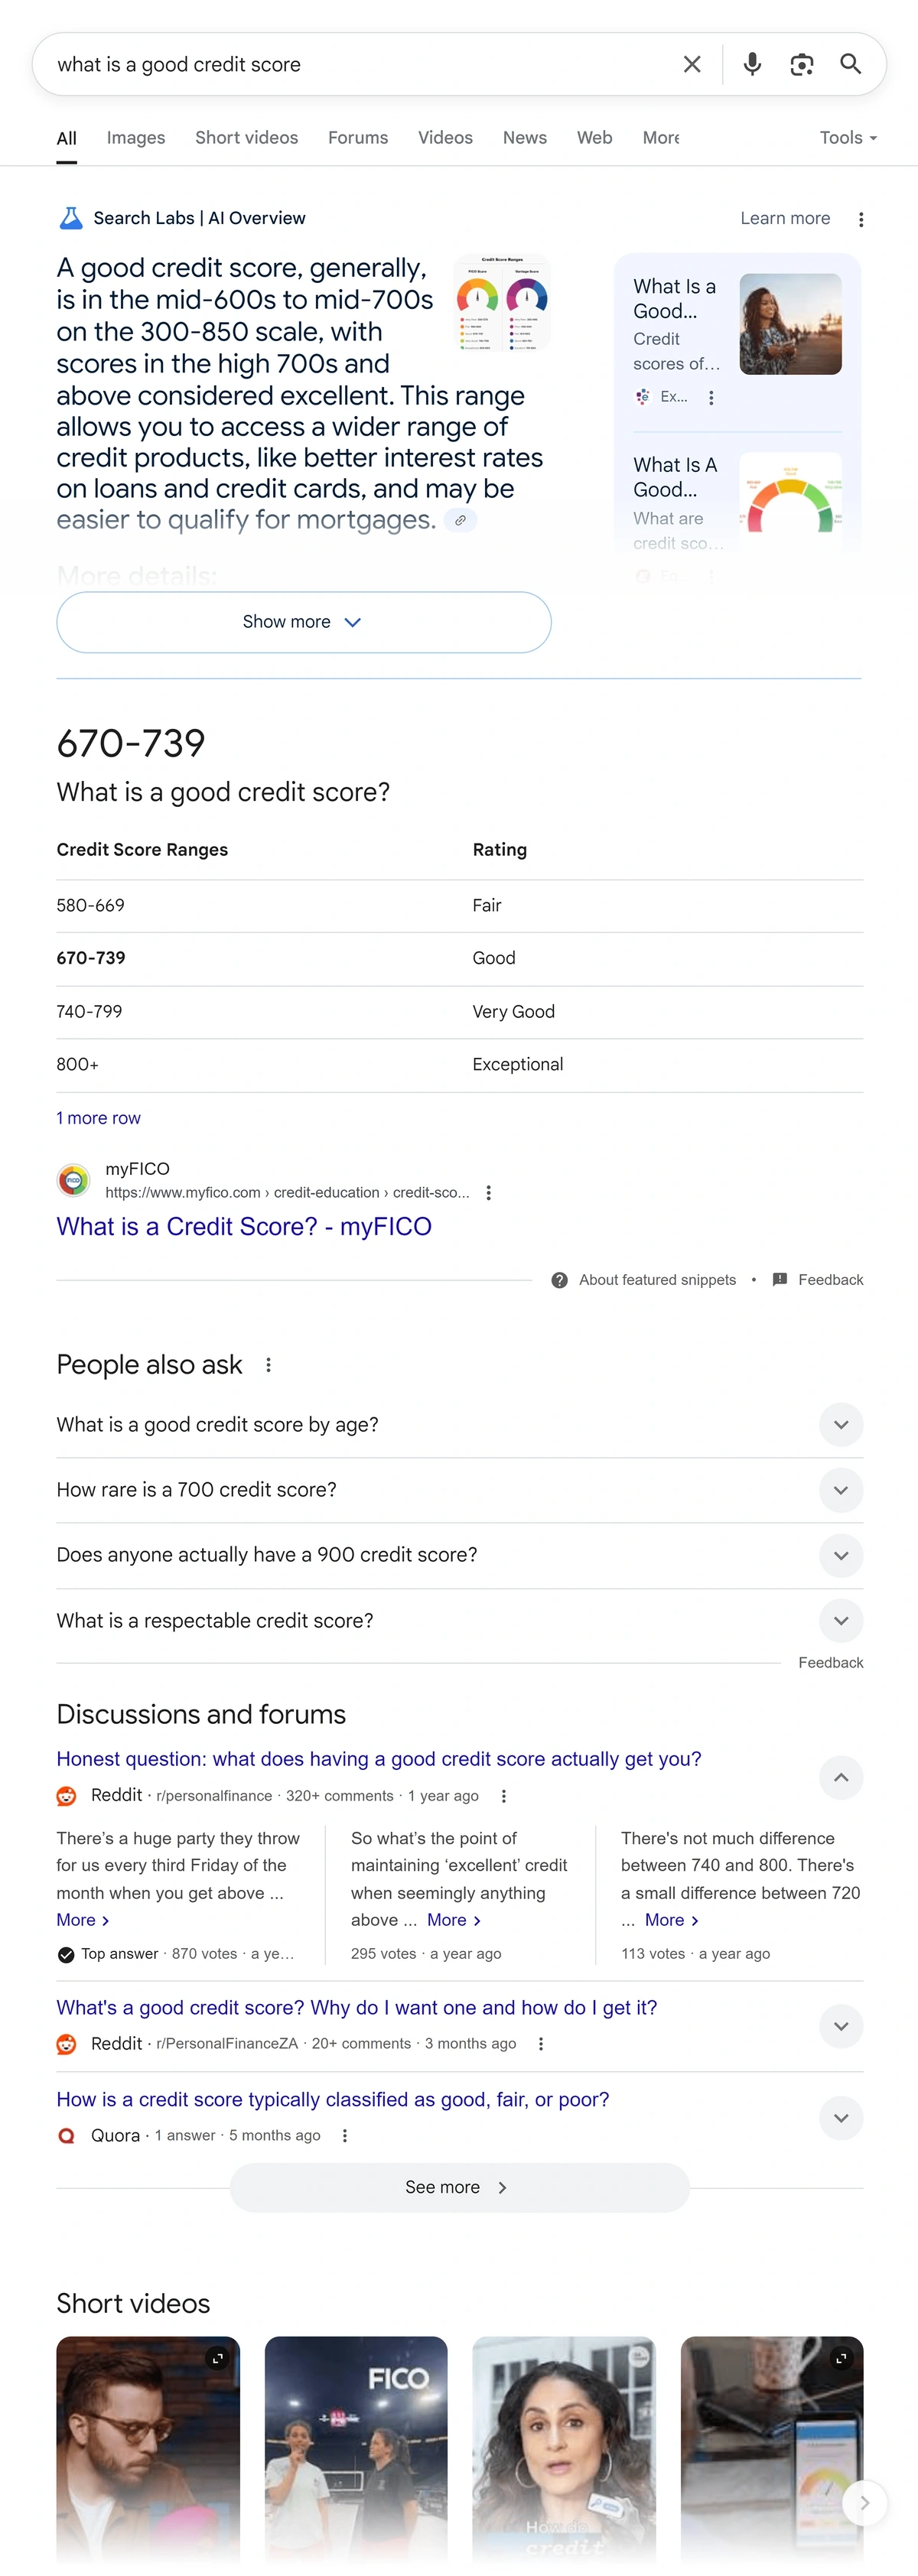
SERP features are special elements that appear in Google to answer a user’s question with more detail than a standard blue link.
Ranking in a SERP feature will give you a massive visibility boost because these stand out more than the top 10 links.
The downside is that some SERP features can reduce the incentives for searchers to click, resulting in the “zero-click search” phenomenon.
Popular SERP features include:
- AI Overviews
- Featured snippets
- Local maps
- People also ask
- Knowledge panel
- Image packs
- Video carousels
How can I track what SERP features I’m ranking in?
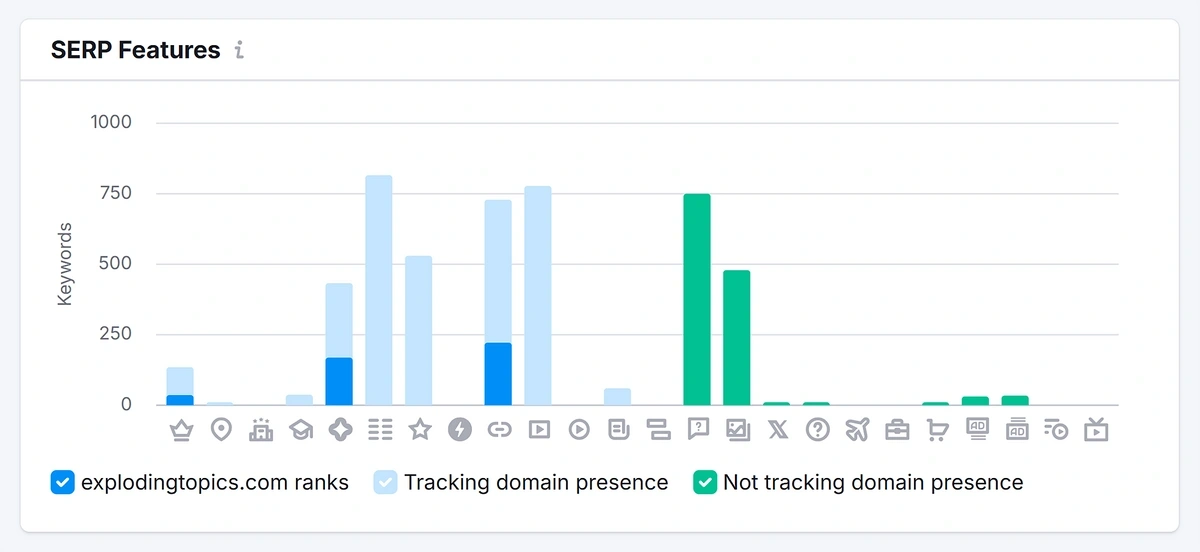
You can track the SERP features you’re ranking in using the Semrush Position Tracking tool.
The SERP Features chart tells you which features you’re frequently ranking in.
It’s an intuitive way to instantly understand how well you’re capitalizing on Google’s real estate with features that can boost your search visibility.
Semrush also calculates your website’s visibility index based on the positions of keywords you’re tracking.
Compared to average positions, the visibility index is a more useful metric when you want to see your overall keyword performance in a single snapshot.
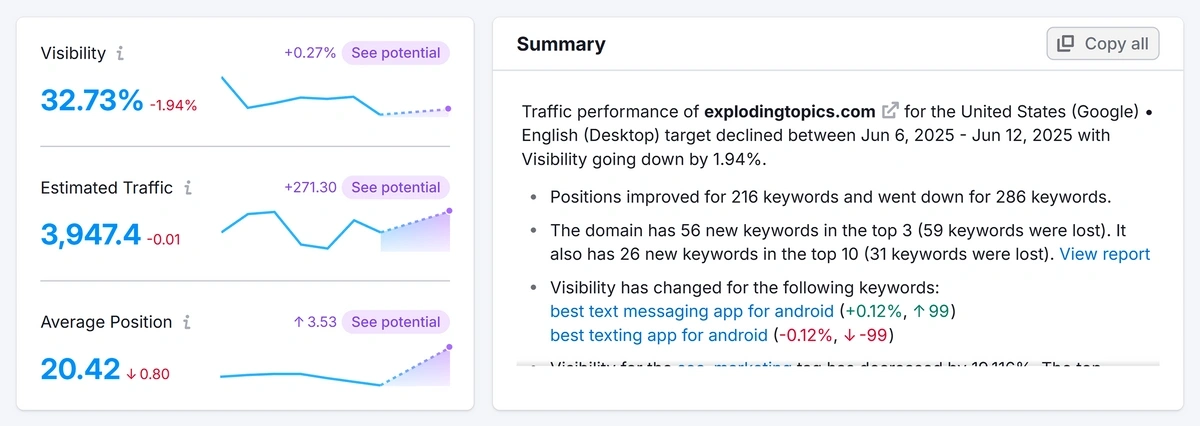
For example, your visibility index will be much higher if you have two keywords, one ranked #1 and the other ranked #20.
In contrast, your visibility is lower if both of your keywords are ranked #10.
Even though the average position is the same in both cases, it’s easy to see that your overall visibility will be higher in the first scenario because of the overpowering effect of the #1 ranking.
So, if you want a single realistic indicator of your overall keyword performance, I recommend using the visibility index.
Note: The visibility index offers a quick-glance metric that’s ideal for regular monitoring, but it’s highly sensitive to ranking fluctuations. Generally, it’s not wise to measure any SEO metric in isolation. Make sure to pair it with frequent, more in-depth performance analyses to get the full picture.
4. AI Referral Traffic
AI referral traffic is the traffic that LLM tools like ChatGPT, Perplexity, Gemini, Claude, and other tools send to your website via citations or direct recommendations.
Measuring AI referral traffic is becoming increasingly important as a part of your SEO performance tracking.
That’s because modern SEO is about optimizing for LLMs as much as it’s about optimizing for traditional search engines.
So if you want to take advantage of AI tools as discovery platforms for your brand, you’ll need to start tracking AI referral traffic now.
How do I measure AI referrals to my site?
You can measure AI referrals by creating a new channel group in your GA4 account.
Start by going to “Admin” in your GA4 account. Then, go to “Channel groups” under the “Data display” dropdown.
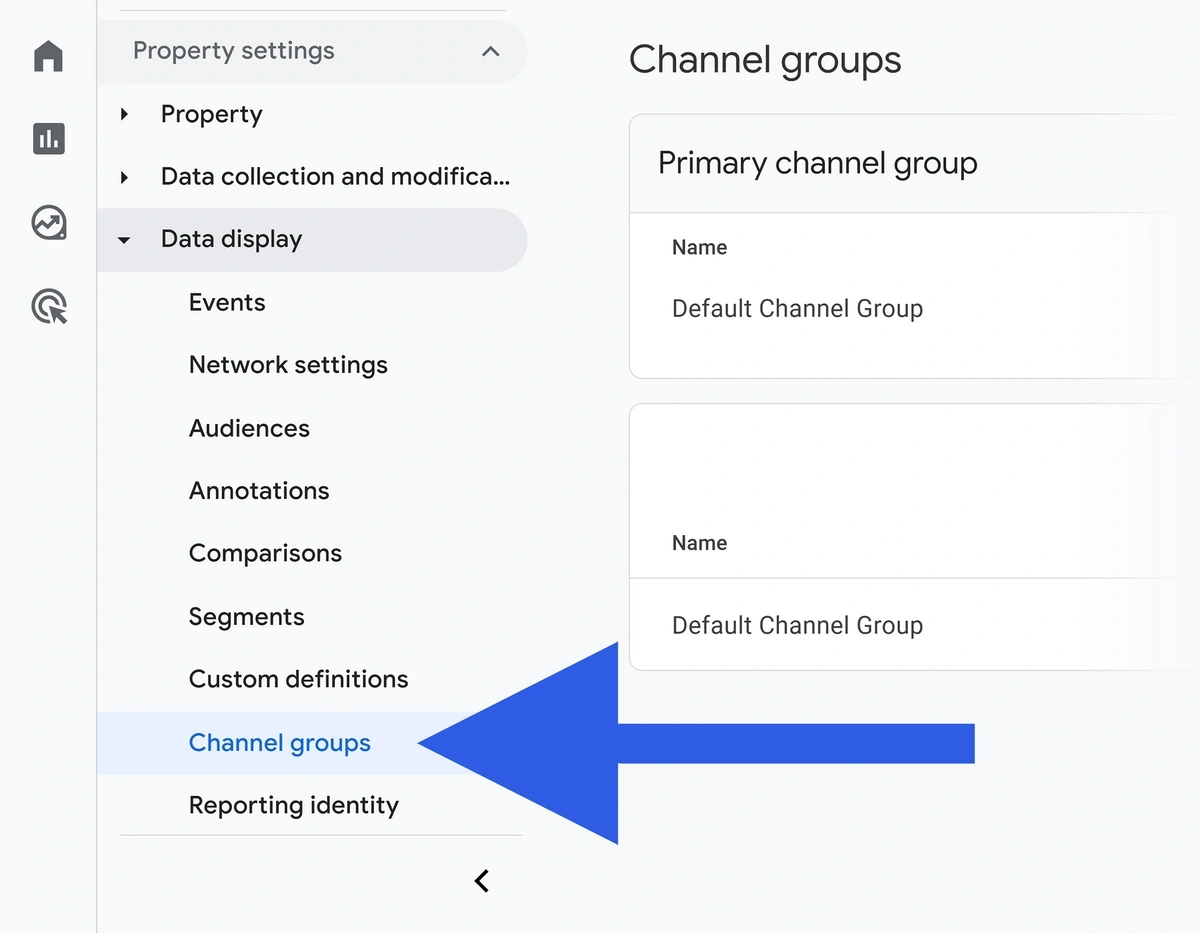
Now, click on the three vertical dots next to your Default channel group and select “Copy to create new”.
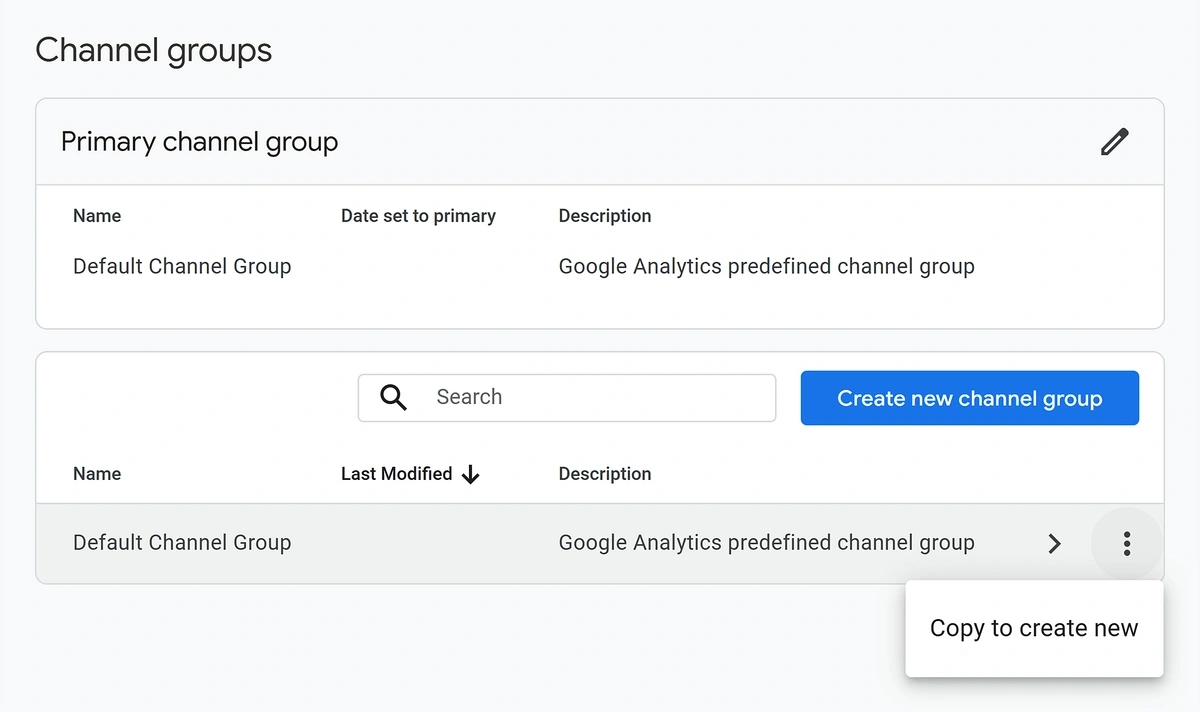
Next, add a suitable group name and click on the blue “Add new channel” button.
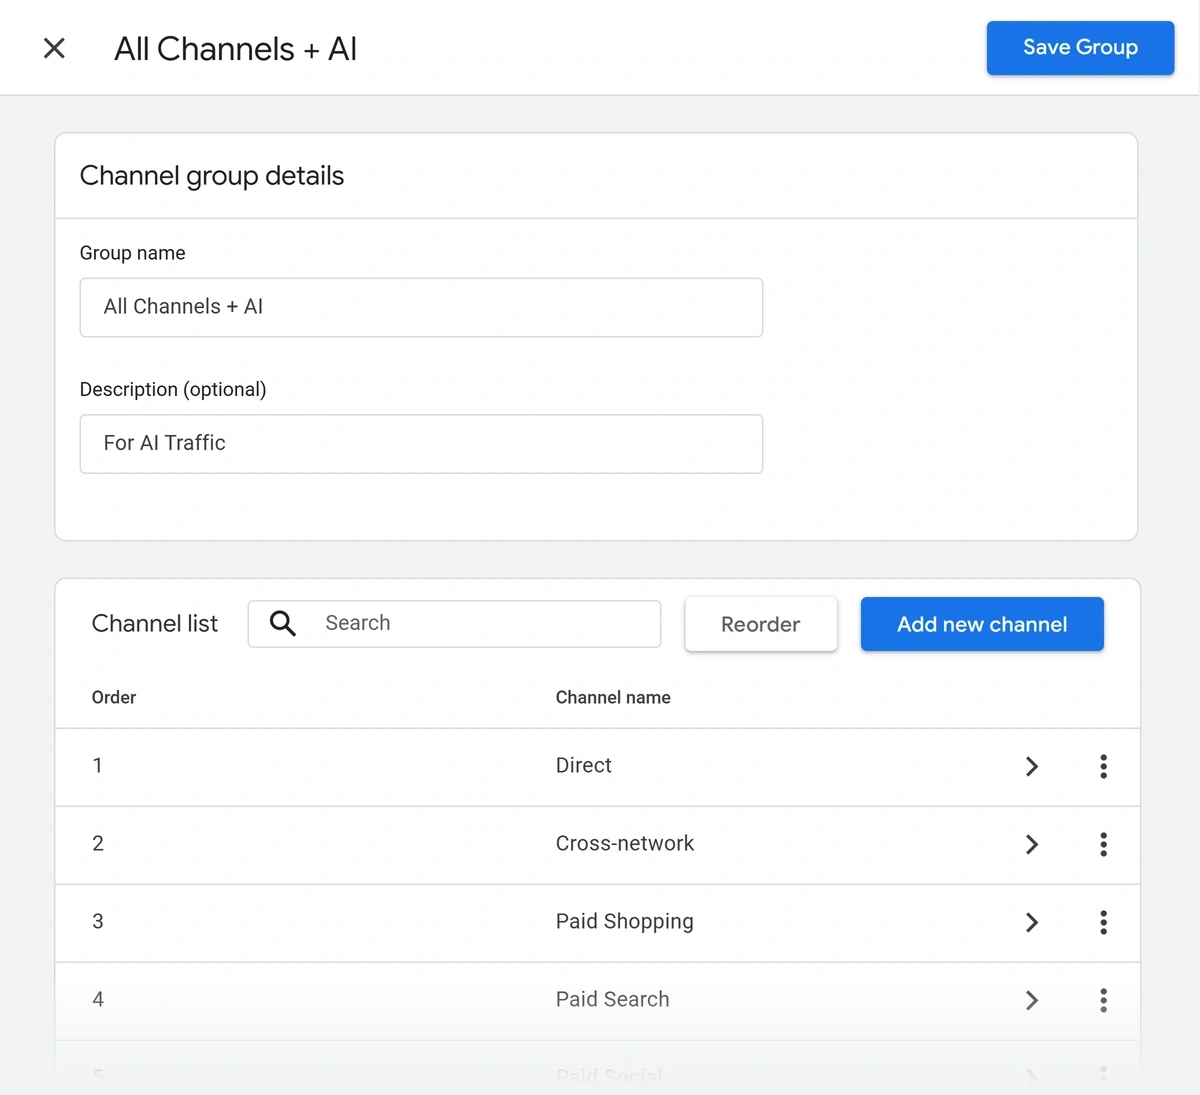
After that, add your channel name. I suggest using “AI Referral Traffic” since it clearly describes what you’re measuring in this channel.
Once you’ve done that, move down to the Channel conditions section. Here, select “Source” on the left-hand field and “matches regex” on the right.
Copy and paste this regular expression (regex):
.*chatgpt\.com.*|.*perplexity.*|.*gemini\.google\.com.*|.*copilot\.microsoft\.com.*|.*openai\.com.*|.*claude\.ai.*
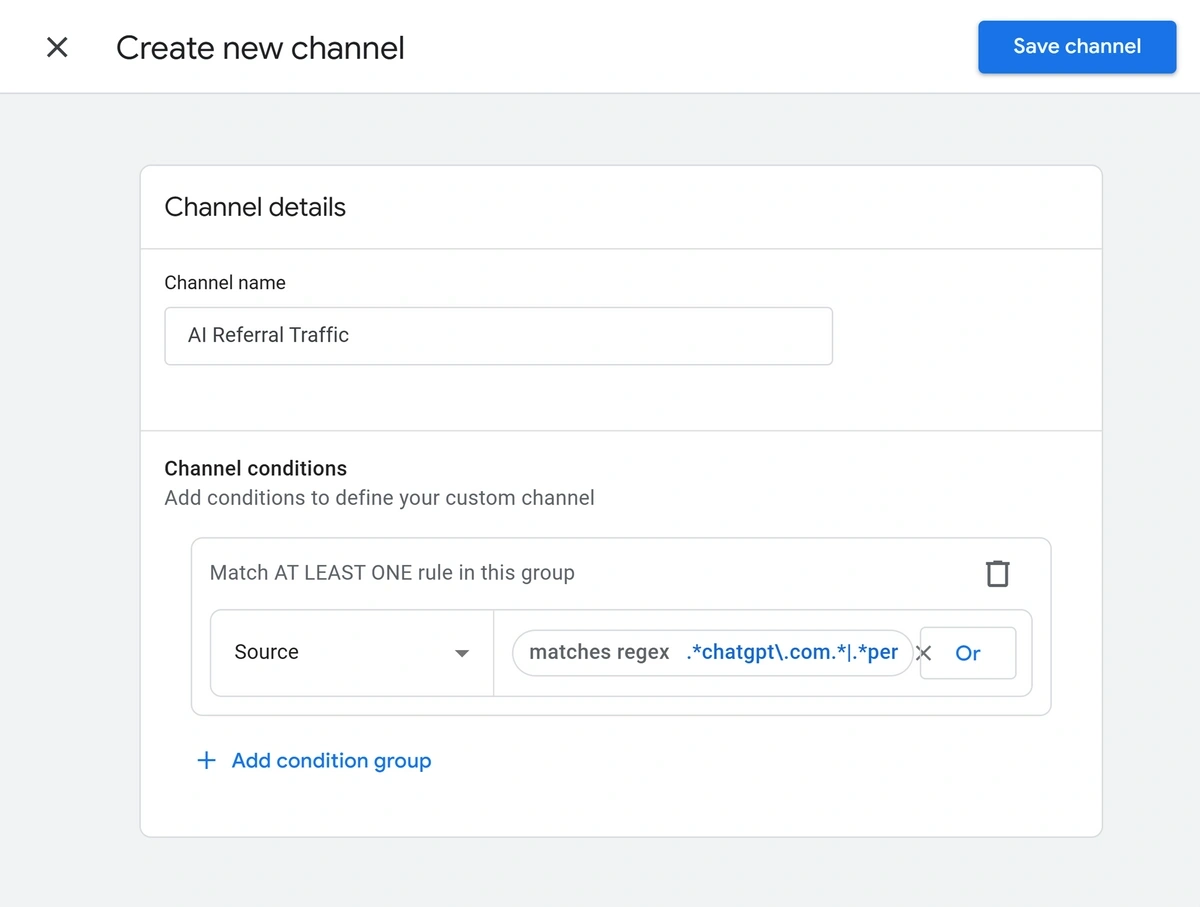
Click on “Save Channel”. You’ll find yourself back on the Channel group overlay screen.
Make sure to click “Save Group” to finish your setup.
You can now start measuring your AI referral traffic in the ‘Traffic acquisition’.
Click the default channel group dropdown at the top of the data table and select your newly created channel with AI.
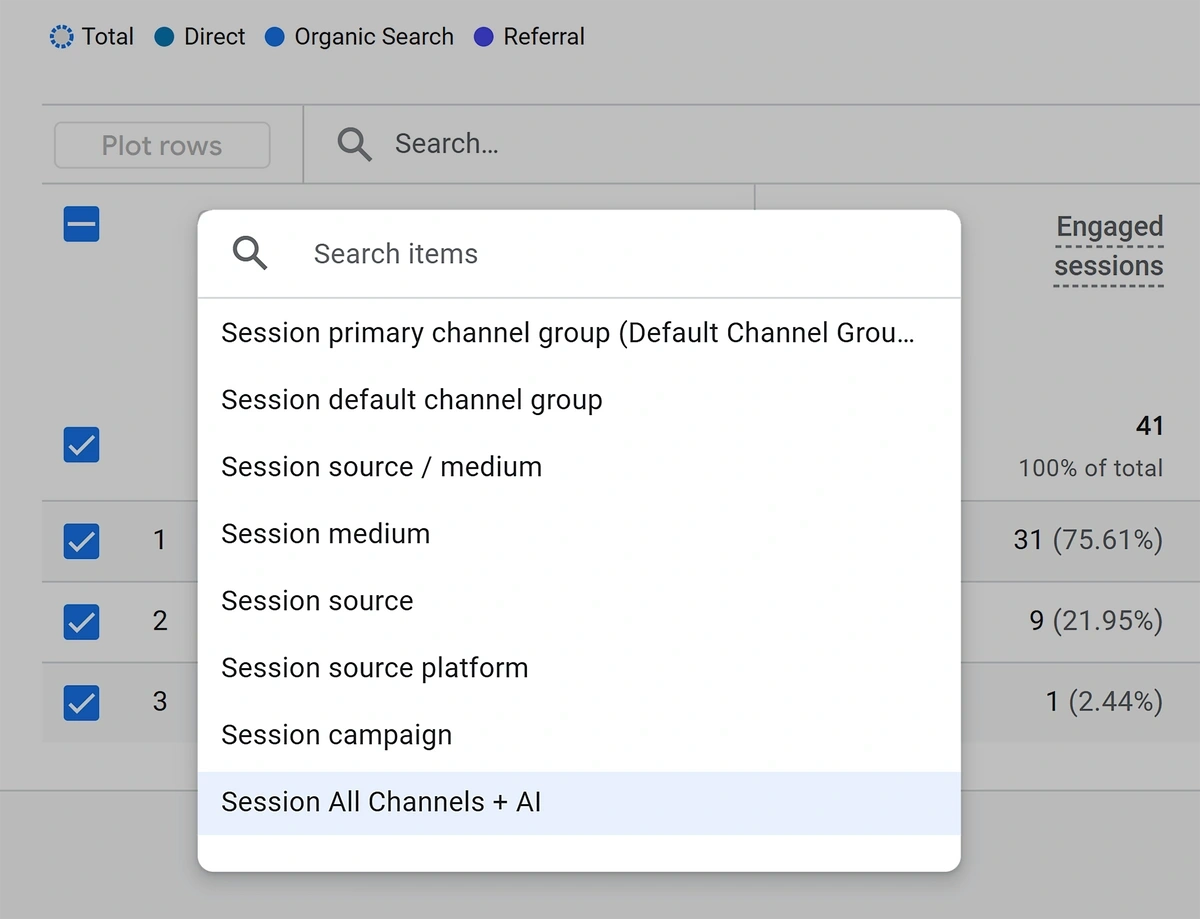
With that, GA4 will now show all of your standard traffic channels along with AI referral traffic.
You can use this data to learn how often people are finding you via AI tools like ChatGPT, Gemini, Claude, and Microsoft Copilot.
5. AI Visibility and Sentiment
Visibility measures how frequently popular AI models reference your brand in conversations with users.
For maximum impact, you need high visibility coupled with positive sentiments.
Because if AI tools frequently present you in a negative light, your visibility will actually work against you rather than for you.
The Semrush Enterprise AIO tool measures your visibility and sentiments driving relevant AI conversations across various models.
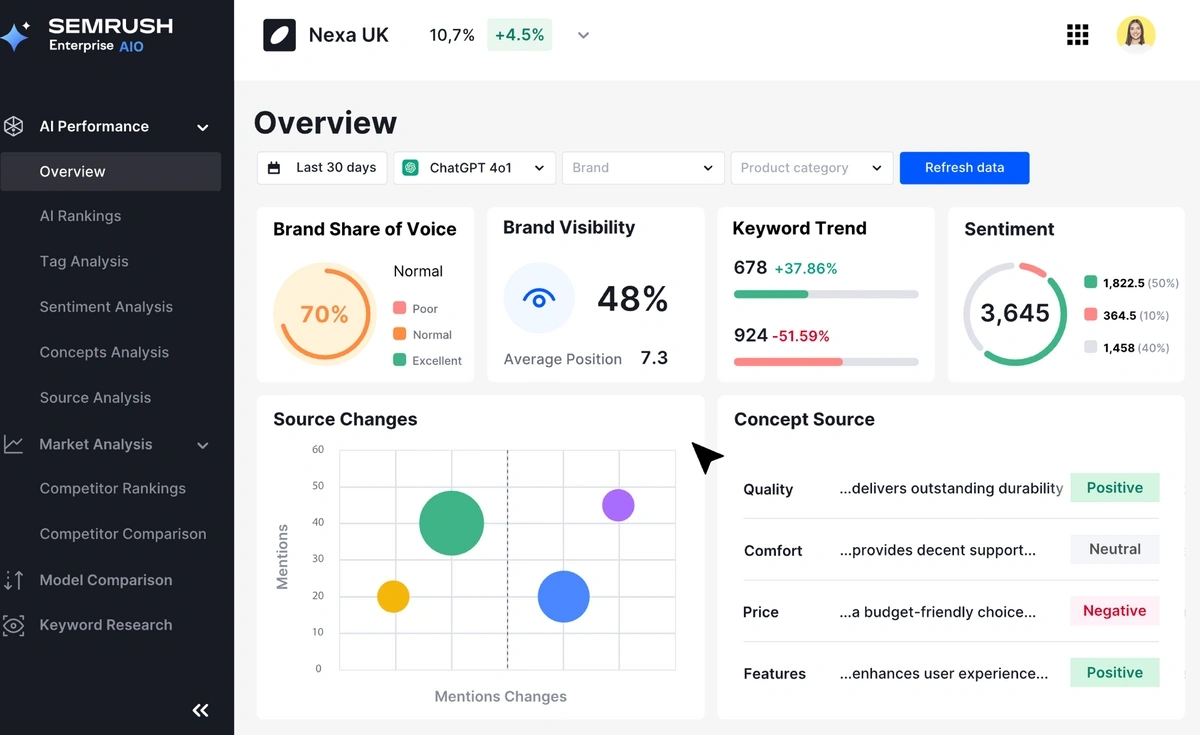
This tool greatly simplifies the data analysis and helps you answer three important questions about your website or brand:
- Your brand's visibility in AI search engines compared to main competitors
- Which aspects of your business are portrayed favorably or negatively by LLMs
- Conversation intents and questions being asked about you that lead to an AI mention or citation for your brand
Considering the growing promise of value LLM search will likely represent in a few years, AI performance tracking will play a key role in your broader search optimization strategy across all AI search engines.
6. Clicks and Impressions
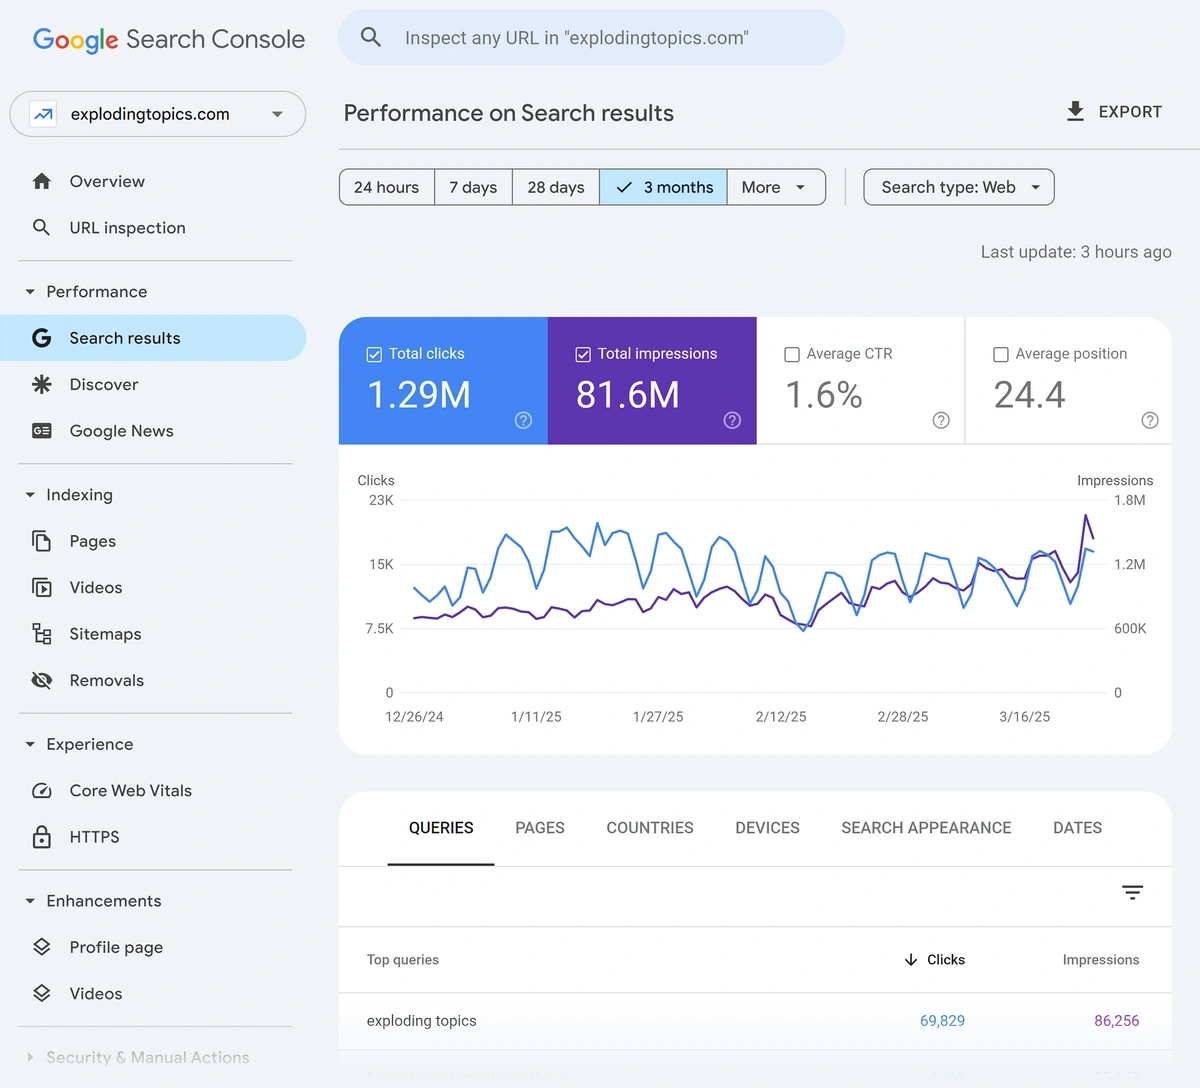
Google Search Console (GSC) tracks all the clicks people have made on your organic search results to visit your website.
GSC also shows your impressions in the same report. Impressions are the number of times a webpage appears in SERPs, whether or not it is clicked.
The ratio of clicks to impressions is the clickthrough rate.
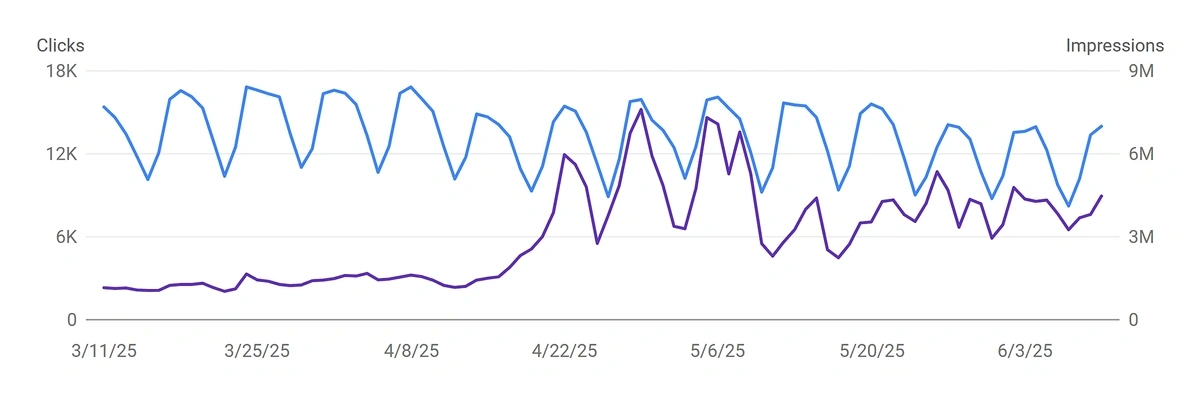
Essentially, clicks are just another way of measuring organic traffic. But looking at clicks with impressions can reveal weaknesses and opportunities.
For example, it’s a common experience to find a page having high impressions but low clicks. The first thing I review in this situation is to check my page title.
If your page title isn’t enticing enough, doesn’t stand out from other links, or isn’t aligned with search intent, it can negatively affect your click-through rates.
Of course, there are situations when the problem is out of your control, such as searchers displaying zero-click behavior.
When users don’t click, impressions can still be high because Google is serving the answer using your content right on SERPs, removing click motivation.
Where to find clicks and impressions data for your site?
You can review your clicks, impressions, click-through rate, and average position data in Google Search Console (GSC).
After logging into GSC, click on “Search results” under “Performance”. You can toggle the exact metrics you’d like to see by clicking on the tiles representing clicks, impressions, and so on.
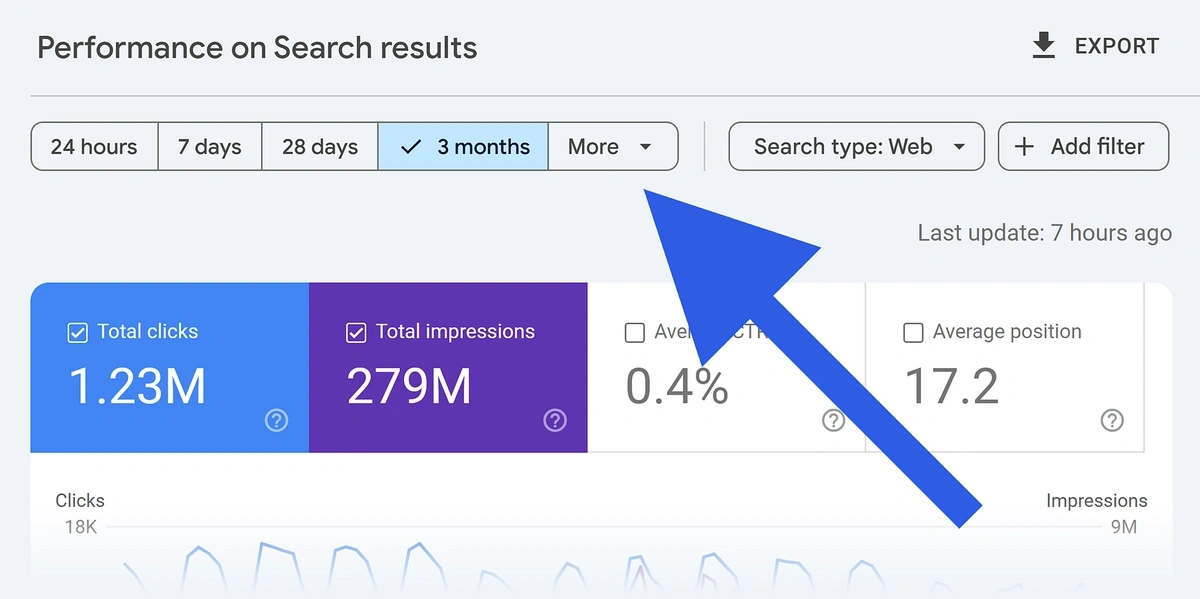
The most effective use of this data is when you compare your clicks and impression changes between different periods.
Click on the “More” menu next to the date presets.
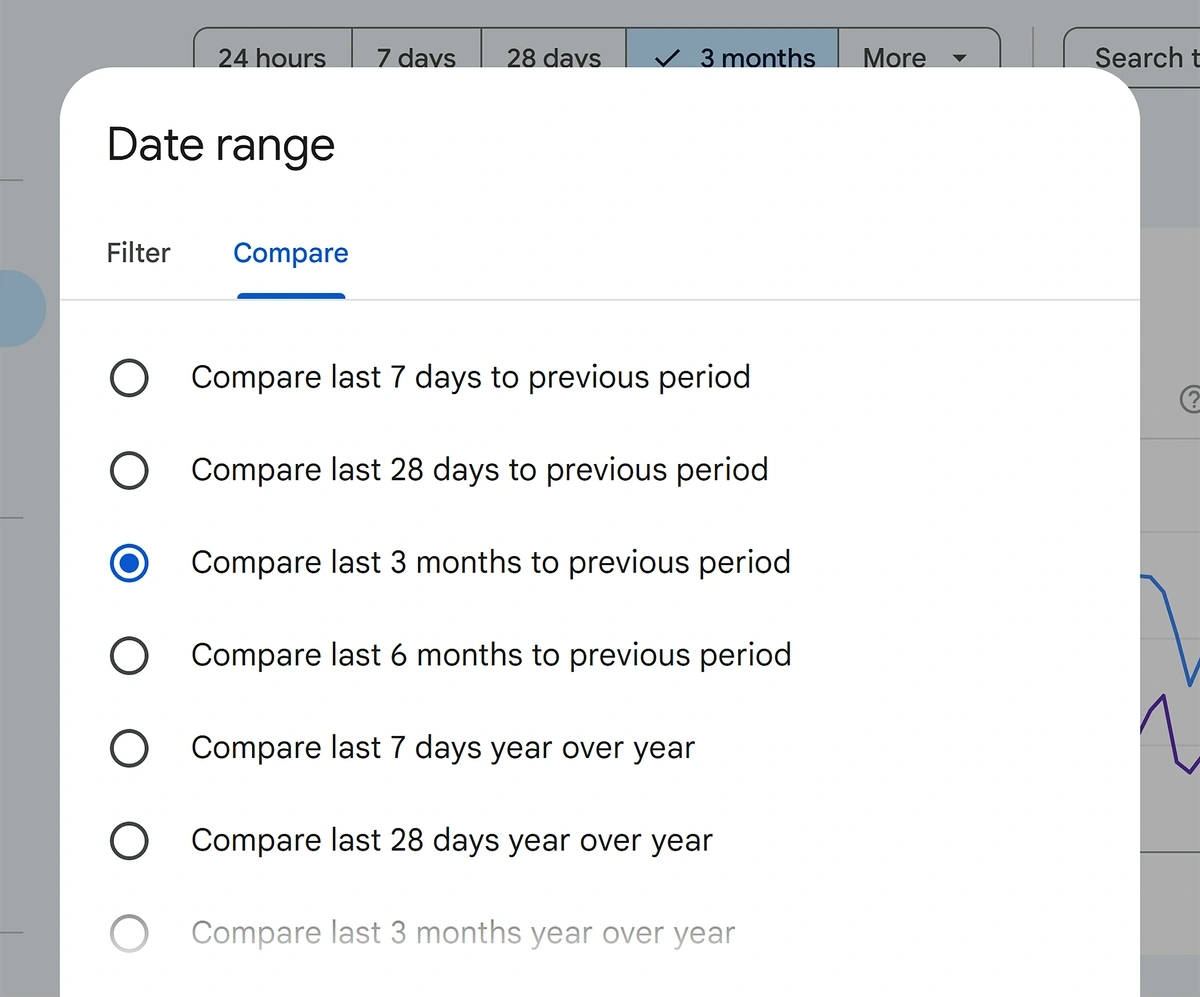
When the date range menu expands, go to the “Compare” tab.
You can select comparison periods from several presets, or use the date picker fields further down below to add your custom comparison points.
This is great for discovering queries you’re losing clicks or impressions from. The comparative data can help you spot underperforming content.
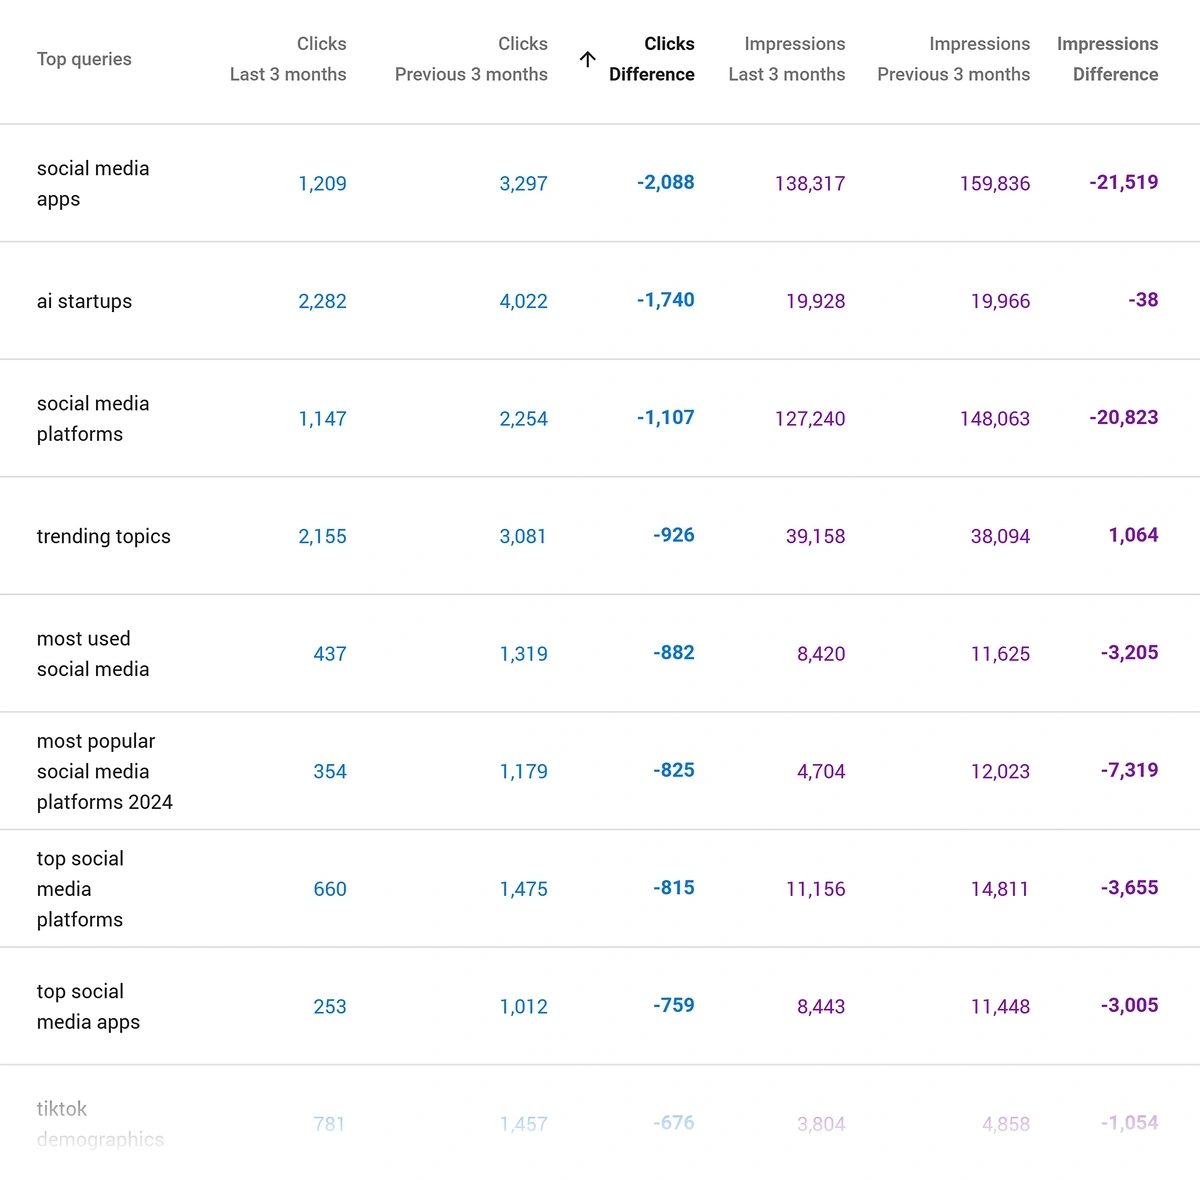
Some potential reasons you could be losing clicks are:
- Uninteresting page title
- Declining keyword positions
- Wrong year in title
- AI summaries and other SERP features reducing click potential.
Many of these problems are fixable. But the last point about AI summaries is something that usually affects clickthroughs for all websites.
This is something you can’t control beyond accepting a new benchmark for clicks for affected queries.
Pro Tip: If your page title doesn’t reflect the content of your page well enough, Google may rewrite it for you. But you shouldn’t leave this to Google. Your competitors will simply outrank if they’re putting in an effort into writing contextually strong titles while you wait for Google to fix them for you.
7. Conversions
Conversions are actions users take on a website that fulfill a specific goal. Websites commonly place a high value on conversion actions like purchases and newsletter signups.
Ultimately, all SEO efforts are meant to boost conversions, so it’s the surest way of measuring your SEO results.
How can I measure SEO conversions?
To measure conversions from SEO, you’ll once again need GA4.
Conversions are labeled as ‘key events’ in GA4.
And since designating any event as a conversion depends on your goals, you’ll first need to set up key events meaningful for your business, as explained in this Google guide.
When you’ve configured your key events, you can find your conversion data in the Traffic acquisition report.
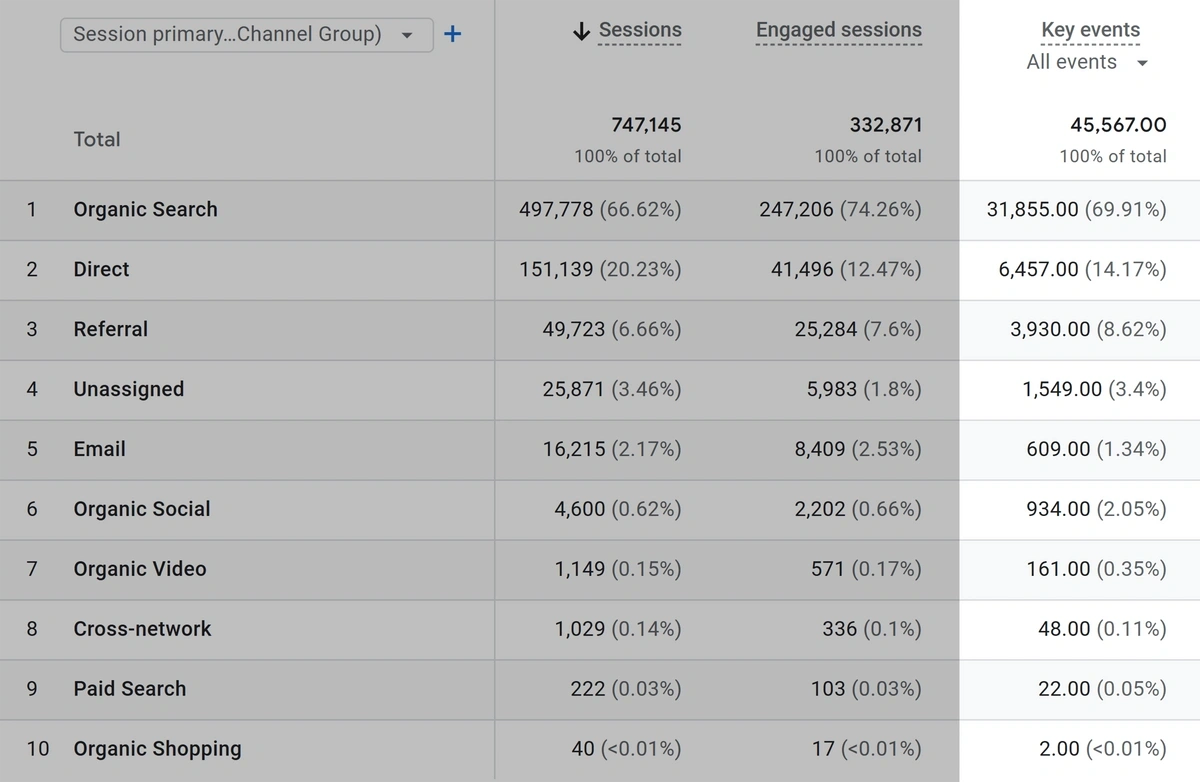
This shows your total key events grouped by each traffic channel.
Focus on the Organic Search row to find your total conversions (labeled key events) and conversion rate (labeled session key event rate) attributable to your SEO efforts.
8. Engagement Metrics
Engagement metrics reveal how visitors interact with your site. They’re good indicators for gauging user experience and how well you’re satisfying their search.
Some engagement factors that are worth keeping an eye on include:
- Engagement rate or bounce rate
- Average session duration (dwell time)
- Scroll depth
How does engagement and user experience fit in SEO?
The goal of SEO isn’t just to rank. Rankings don’t mean anything if your users aren’t enjoying and engaging with your content.
Besides, you can’t sustain rankings if people are bouncing off your page and spending less time than Google expects. This became abundantly clear with Google’s Navbost revelation.
In fact, with AI Mode and Google’s increased focus on satisfying search intent (evidenced by Helpful Content Update and EEAT), optimizing your content for high engagement is vital for SEO success.
What’s the best way to measure engagement levels for SEO?
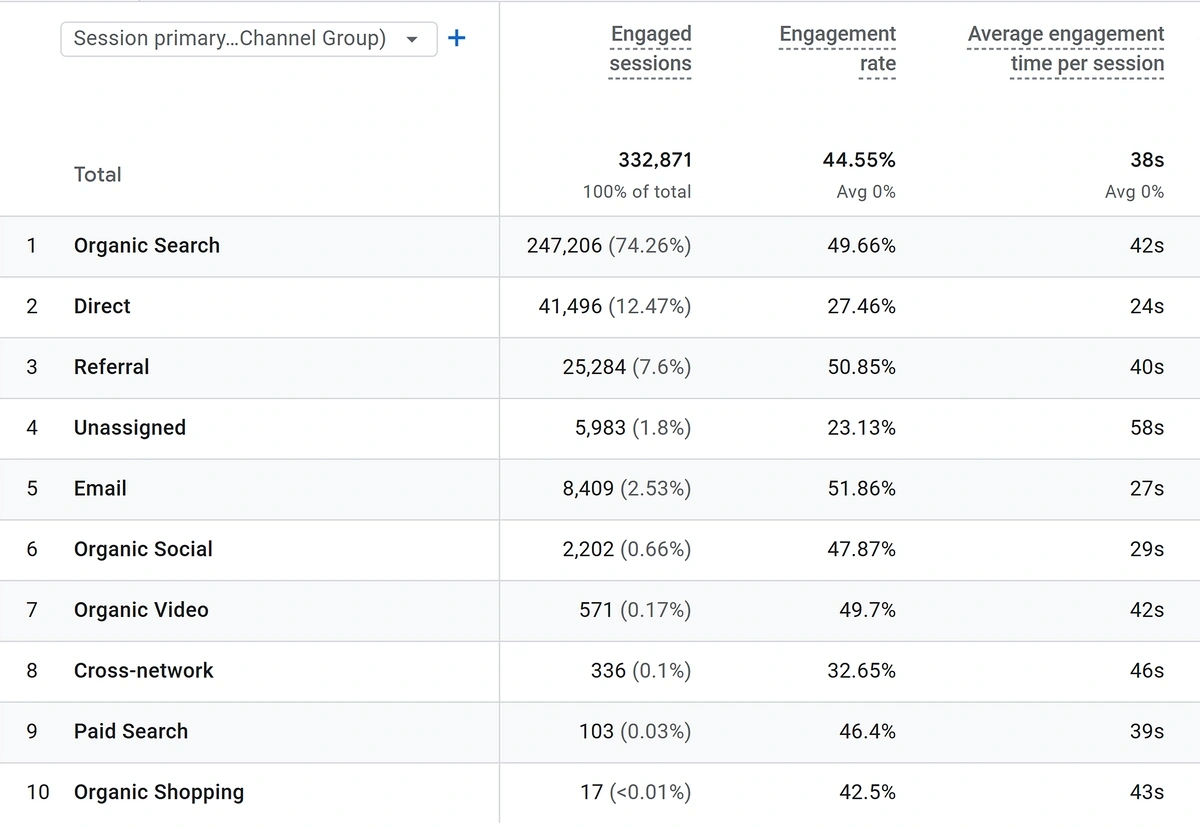
You can measure engagement levels using several metrics available in the standard GA4 Traffic acquisition report.
Particularly, you’ll want to pay attention to the following metrics associated with Organic Search:
- Engaged sessions (measured by time spent on page, conversions, and page views)
- Engagement rate (the fraction of engaged sessions compared to total sessions)
- Average engagement time per session (how long a user stays in each session)
If you’re tracking AI referral traffic, keep an eye on the engagement you’re receiving from AI channels as well.
Engagement rates vary for every traffic channel. Use your knowledge of how engagement patterns are distributed across channels to guide SEO as well as your overall marketing strategy.
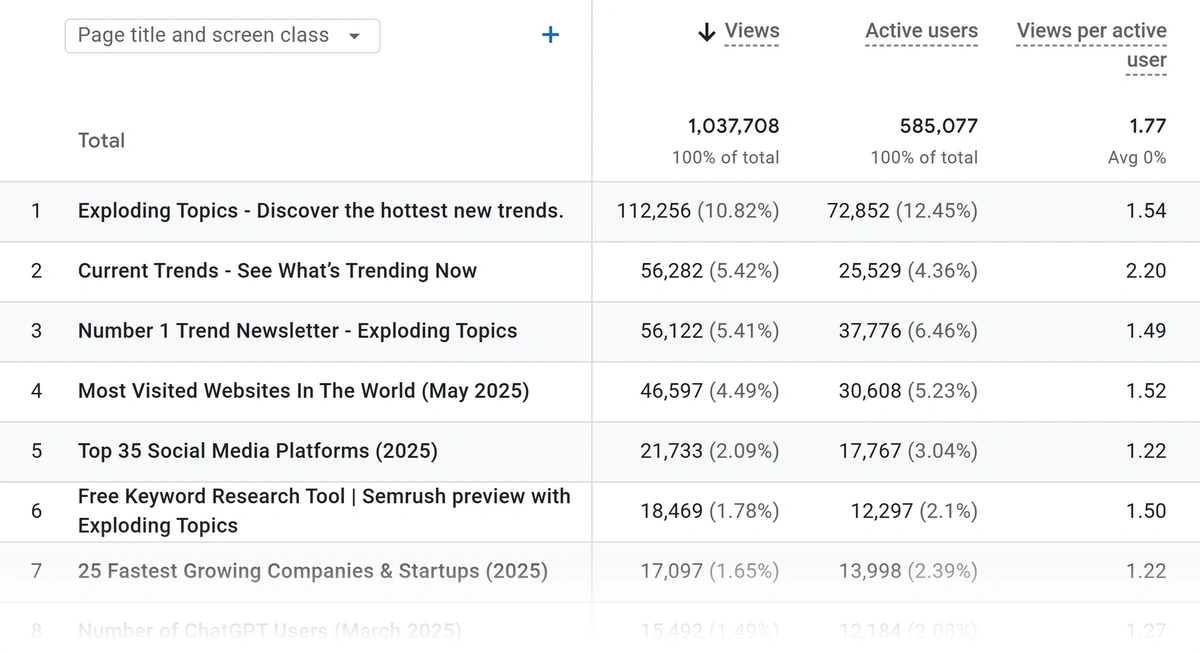
In addition to tracking engagement metrics broadly for traffic channels, you should also look at your individual pages.
The “Pages and Screens” report. By default, this report uses a bunch of engagement metrics, but not all of these are ideal.
You can customize this report to add specific metrics that can make your engagement analysis simple. To do that, click on the pencil icon in the top-right of the screen.
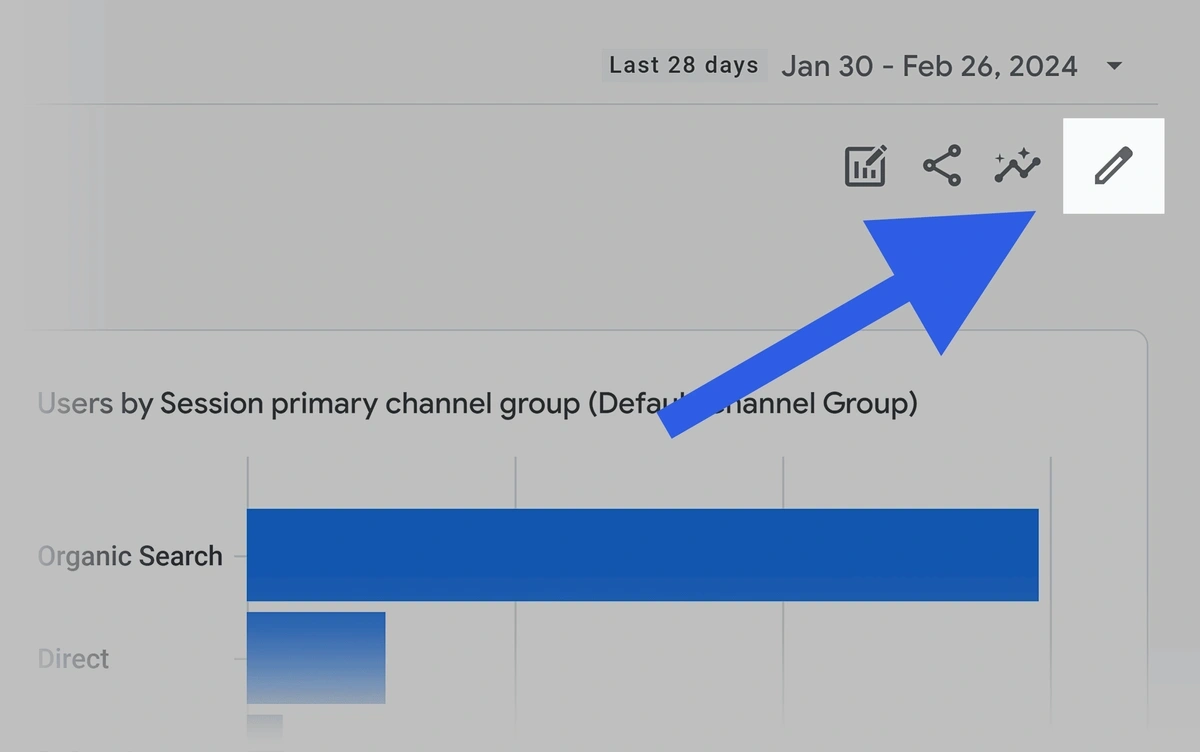
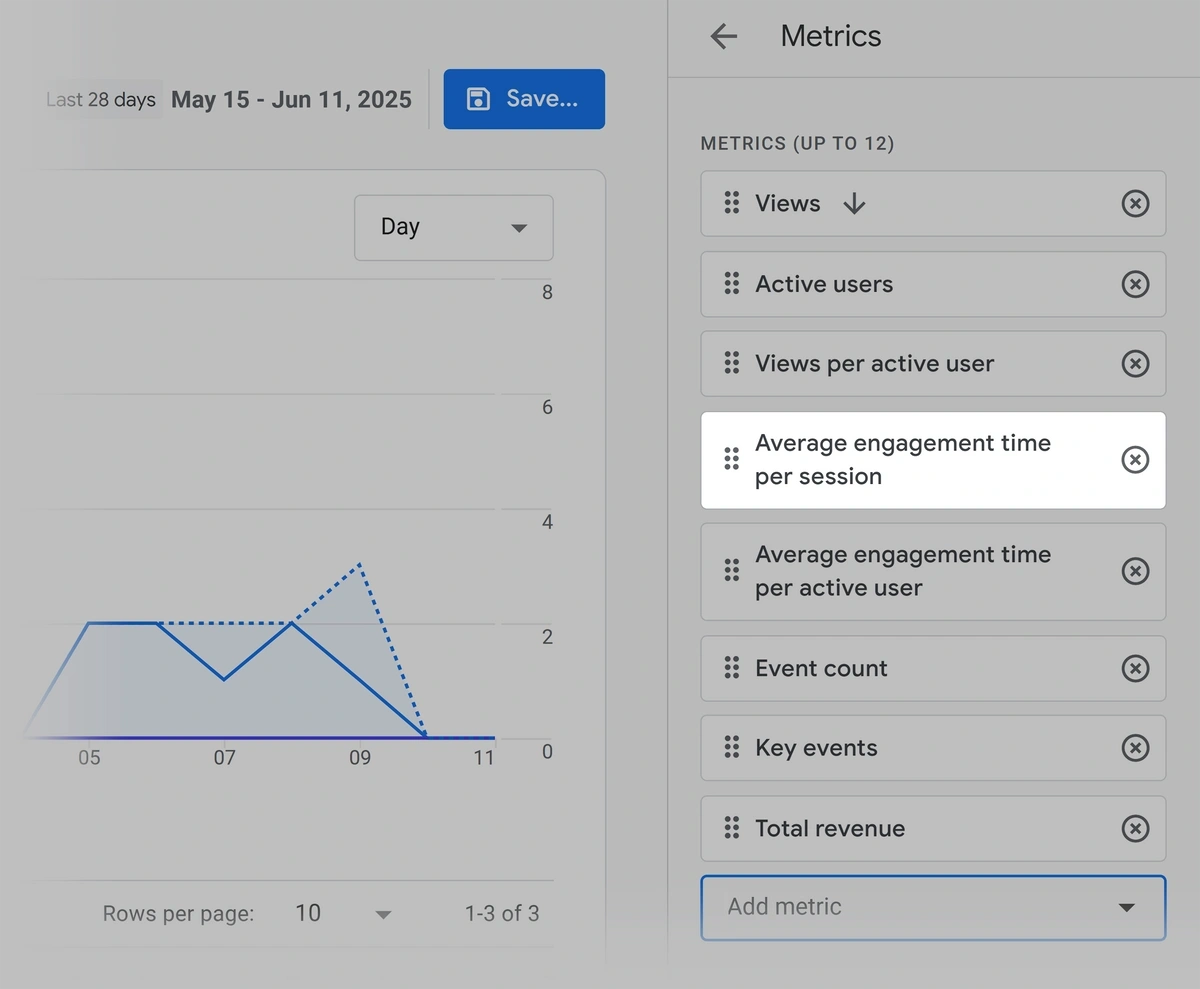
This will open a report customization menu.
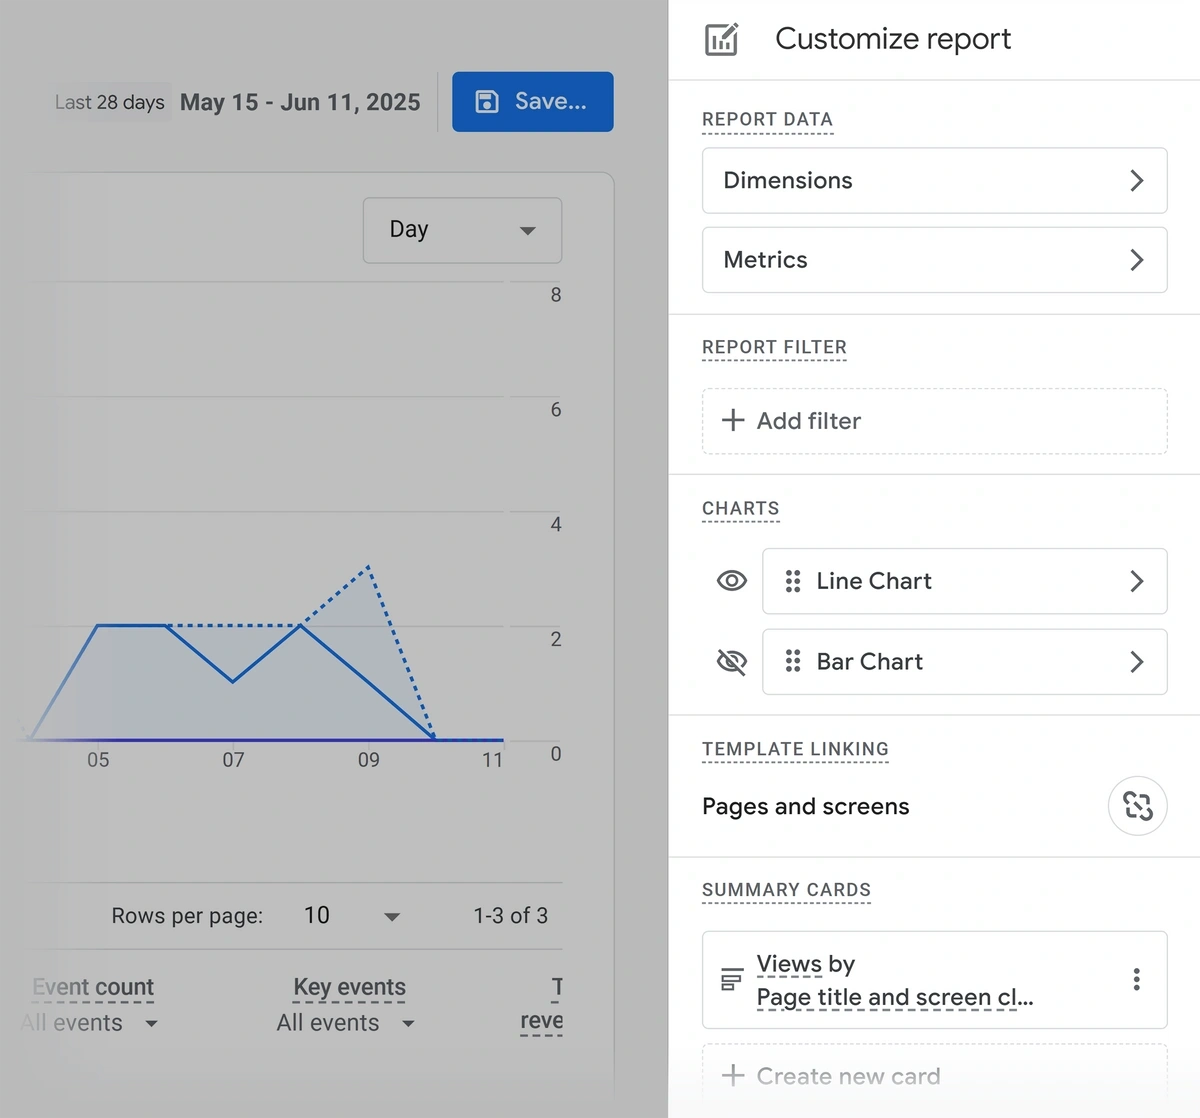
Select “Metrics” and then use the “Add metric” dropdown to find and choose “Average engagement time per session”.
In my experience, Average engagement time per session reveals a truer picture of how engaged your audience is when viewing specific pages.
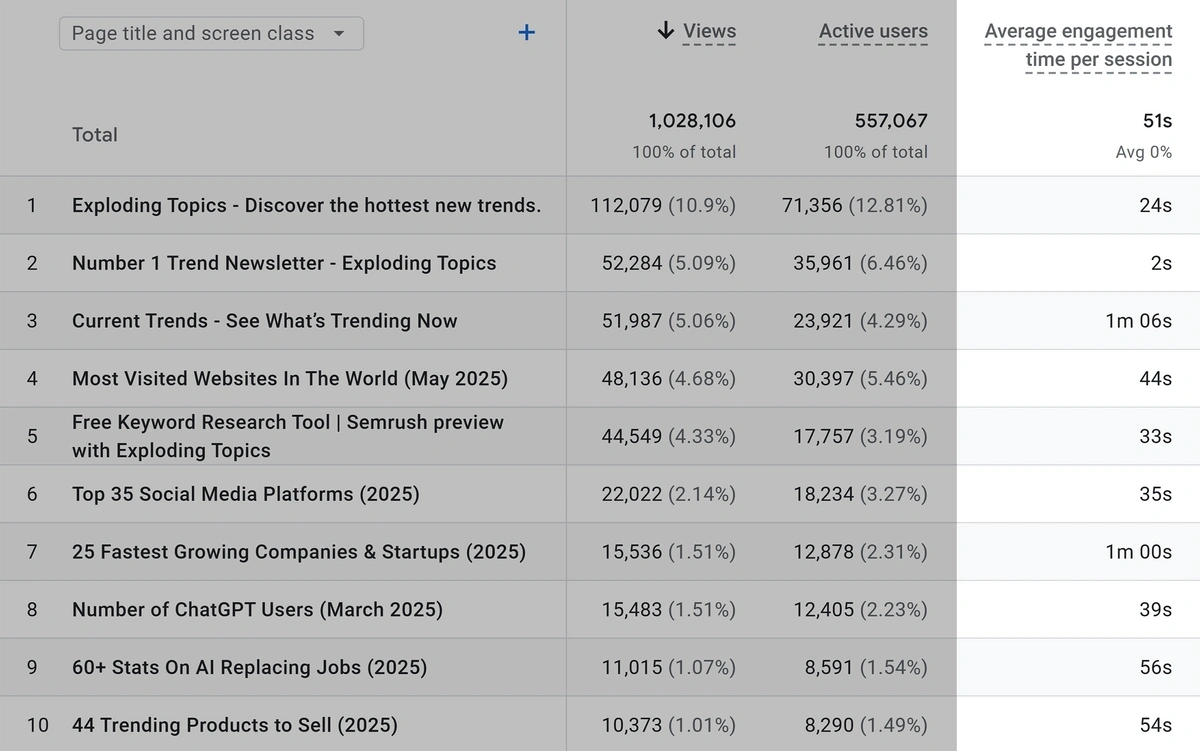
That’s because it only measures the dwell time of users actively engaging with your website, compared to metrics that track time spent by all kinds of users, including disengaged ones (average session duration).
Look at your pages with the best average engagement time and pages with the lowest average engagement time.
This comparison can reveal what’s making certain pages more engaging than others. Once you know that, you can apply impactful changes to boost engagement for underperforming pages.
9. User Journey
User journey reports show you the pathways people take through your website, from a starting point to an end point.
Ever wondered how people move from one page to the next on your site? Or how people end up on a part of your website that’s valuable to you?
This is where user journeys are an underappreciated aspect of SEO analysis.
In the context of SEO, knowing the paths that visitors take through your website helps you optimize and link your pages for maximum discoverability.
How to track user journeys across your website?
You can track user journeys using the GA4 path exploration reports. This is an exploration report that you can find by clicking “Explore” in the sidebar.
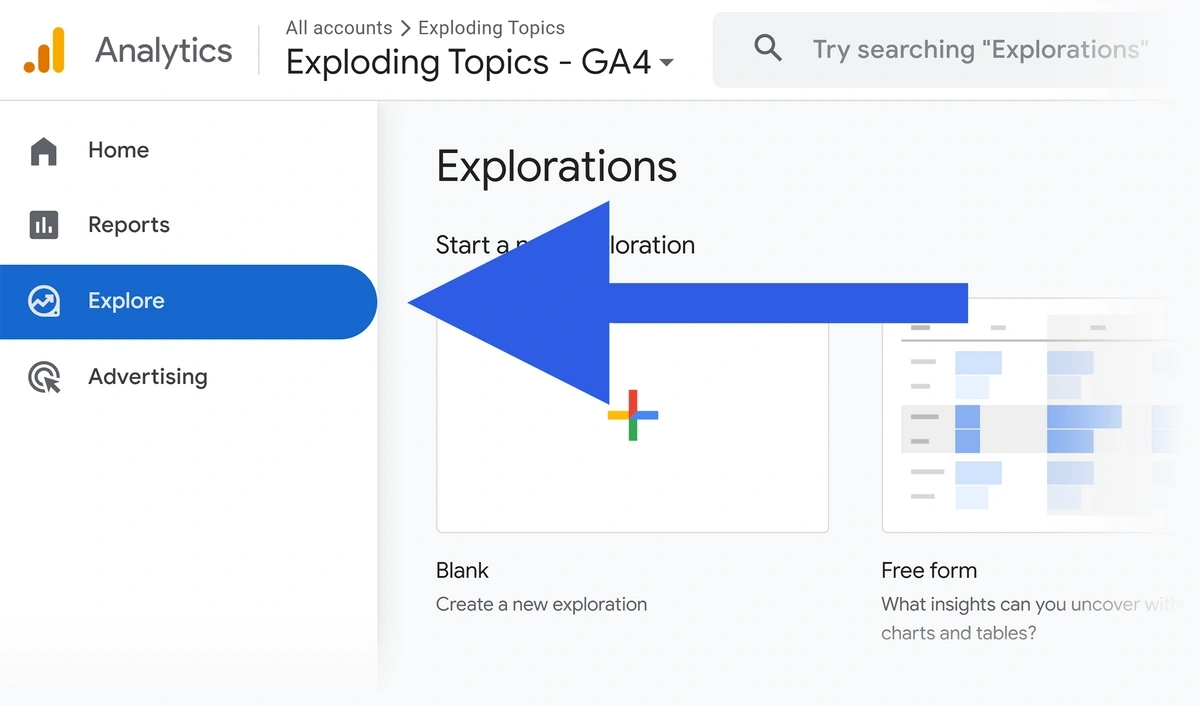
Select “Path exploration” from the template carousel to open the report.
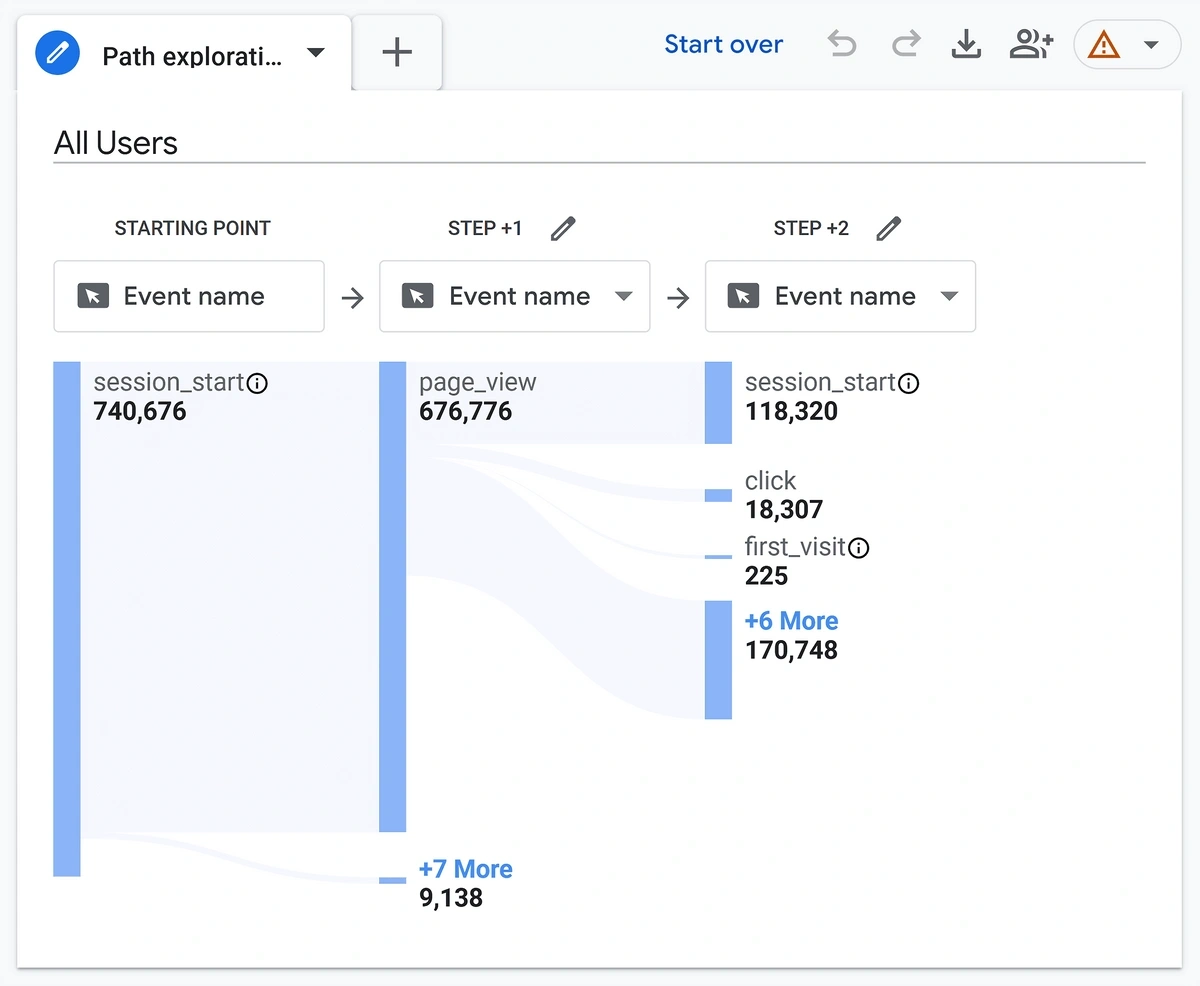
By default, the report shows you the pages or events starting a user’s journey, and the steps they take subsequently.
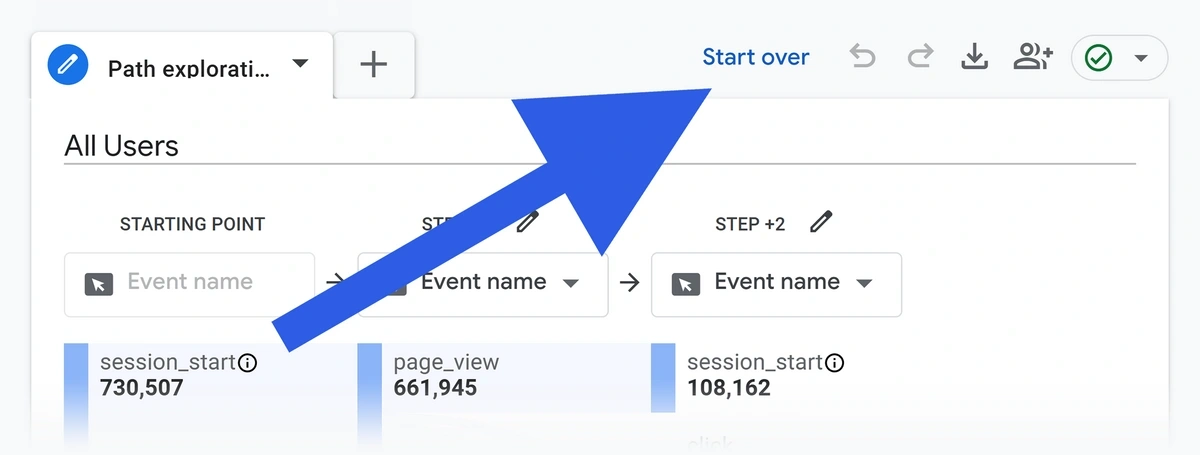
In my opinion, a more useful way of using this report is to start from an ending point. GA4 will then automatically find the common paths people are taking through your website to reach your ending point or goal.
You can do this by clicking on the “Start over” button to first remove the default data.
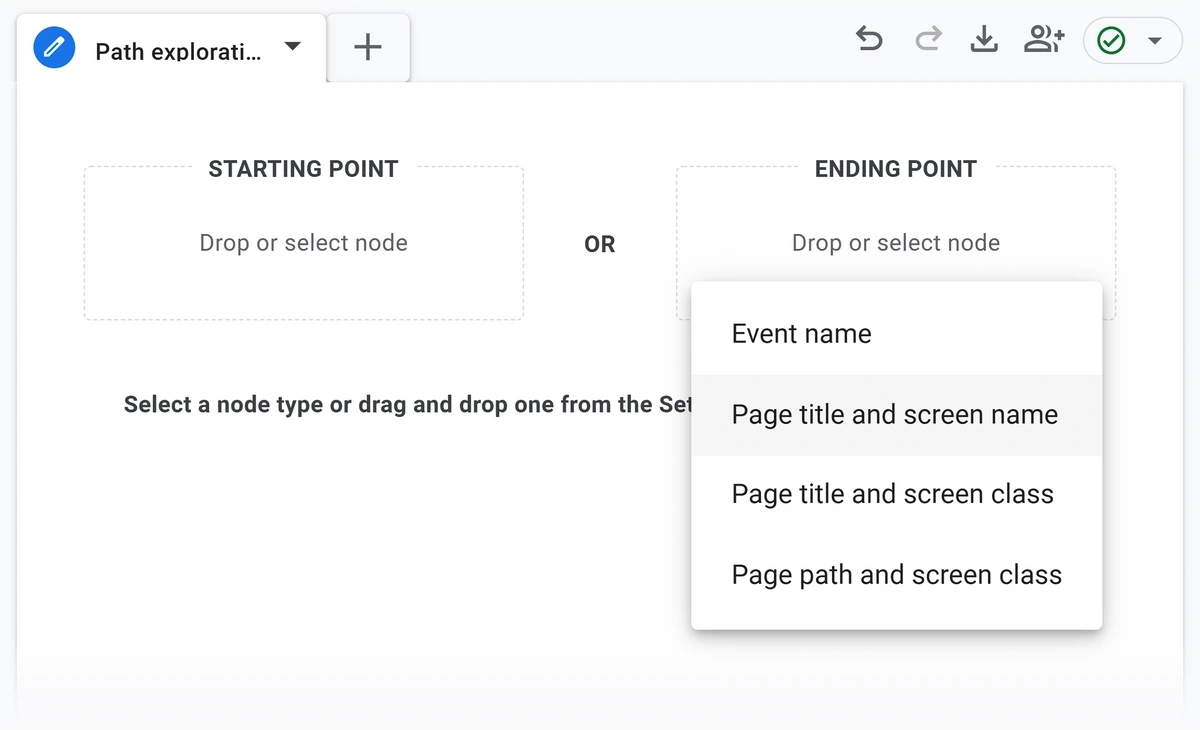
Once the report is reset to blank, click on the rectangular area under “ENDING POINT” and choose “Page title and screen name” from the menu.
This will open a menu listing all pages of your site by their titles. To take our example, newsletter signups are an important goal for the Exploding Topics website.
Let me select our newsletter signup page as the Ending Point I’m interested in.
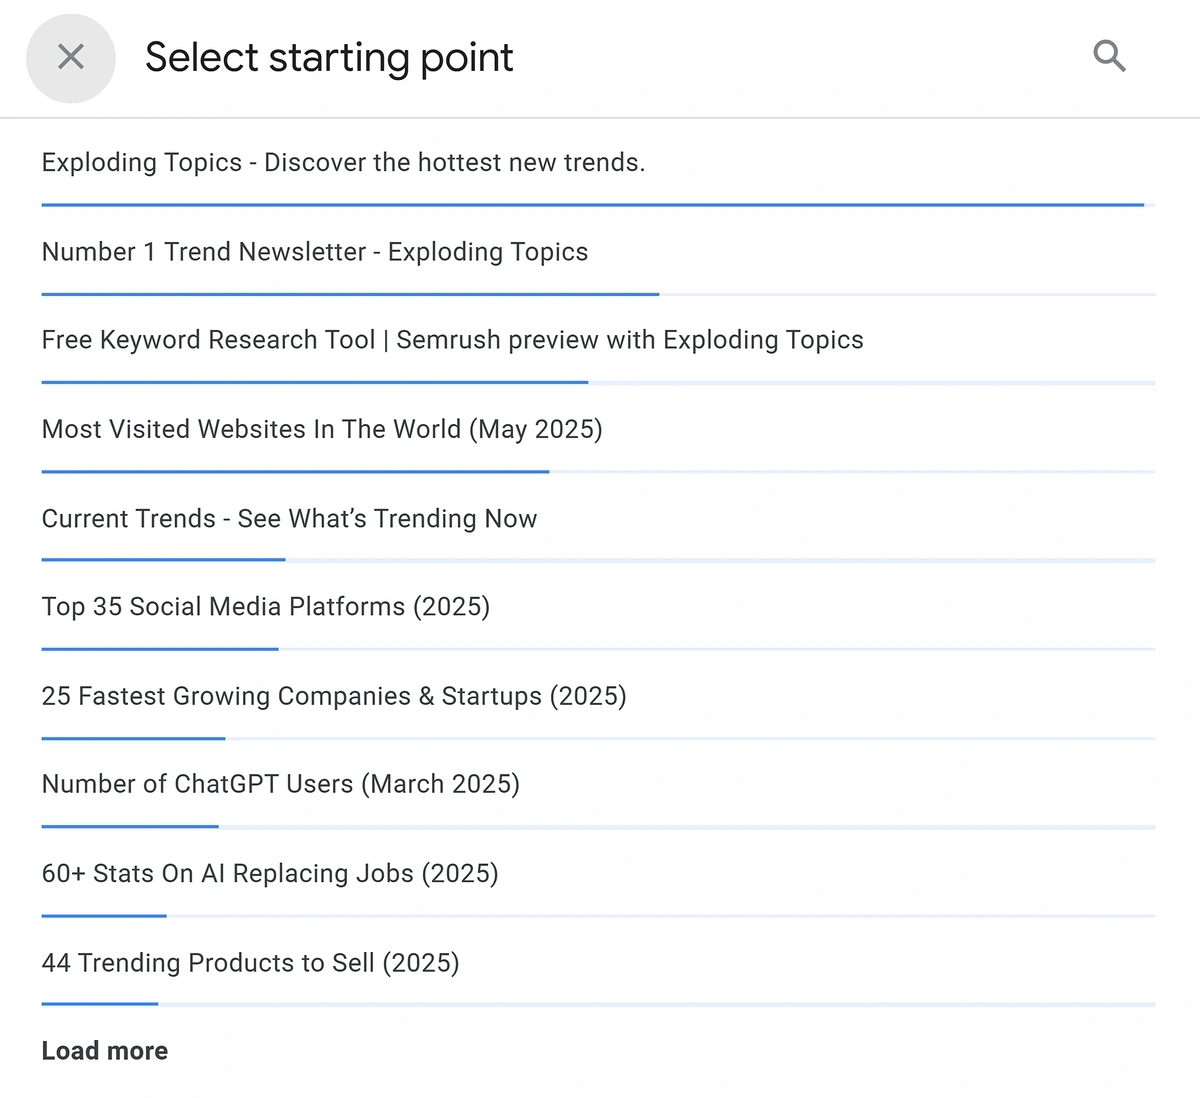
This will allow me to see which pages are serving as gateways to discover our newsletter signup page.
We would’ve expected our homepage to be responsible for sending the most number of people to our newsletter signup.
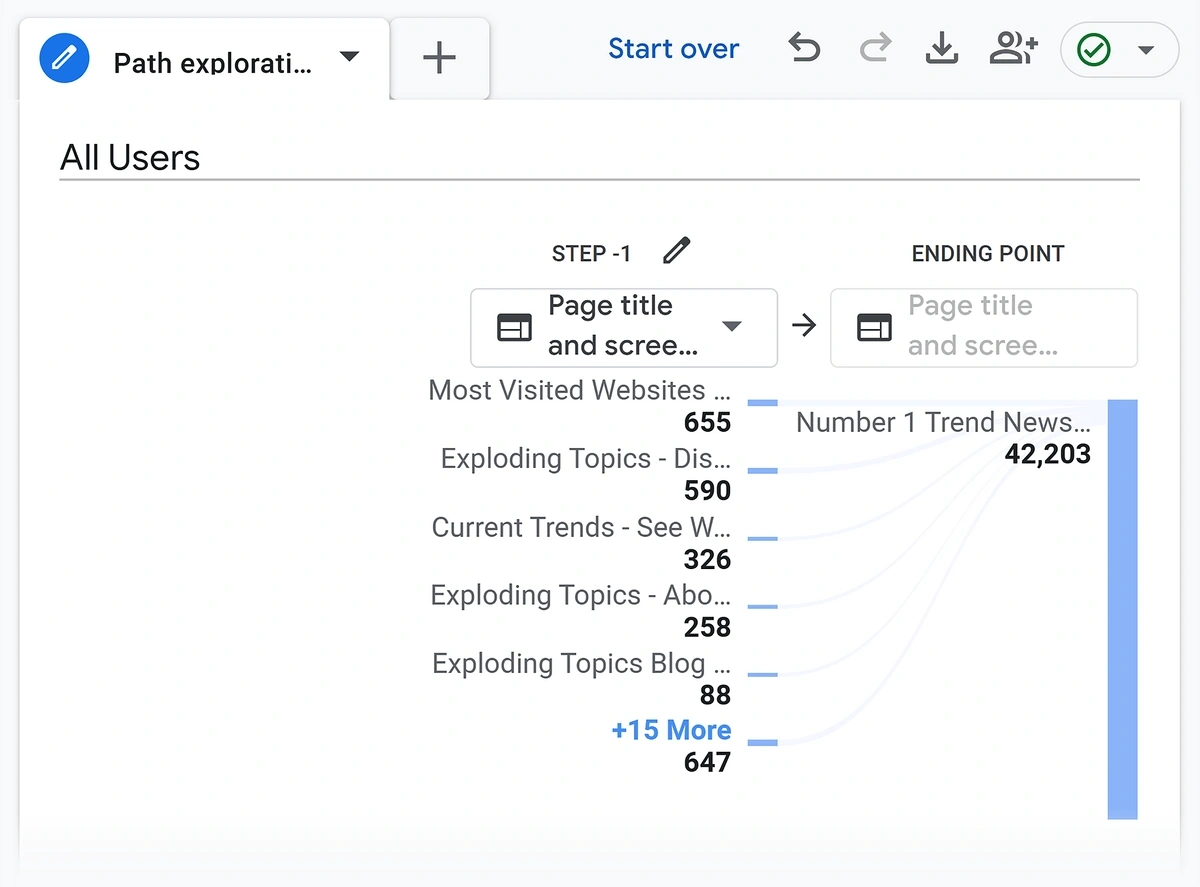
But path exploration shows it’s actually our blog post on most visited websites contributing the biggest share in email signups.
Simple logic makes it plain that we need to maintain this page’s SEO rankings if we want to keep growing our newsletter subscribers.
This example showcases the value of measuring SEO goal contribution by exploring common visitor pathways.
Start looking for pages pushing people to your goals, and focus your SEO efforts on those pages for continued success.
You can extend the same idea to discover external sources and destinations connected with your website using Semrush Traffic Analytics.
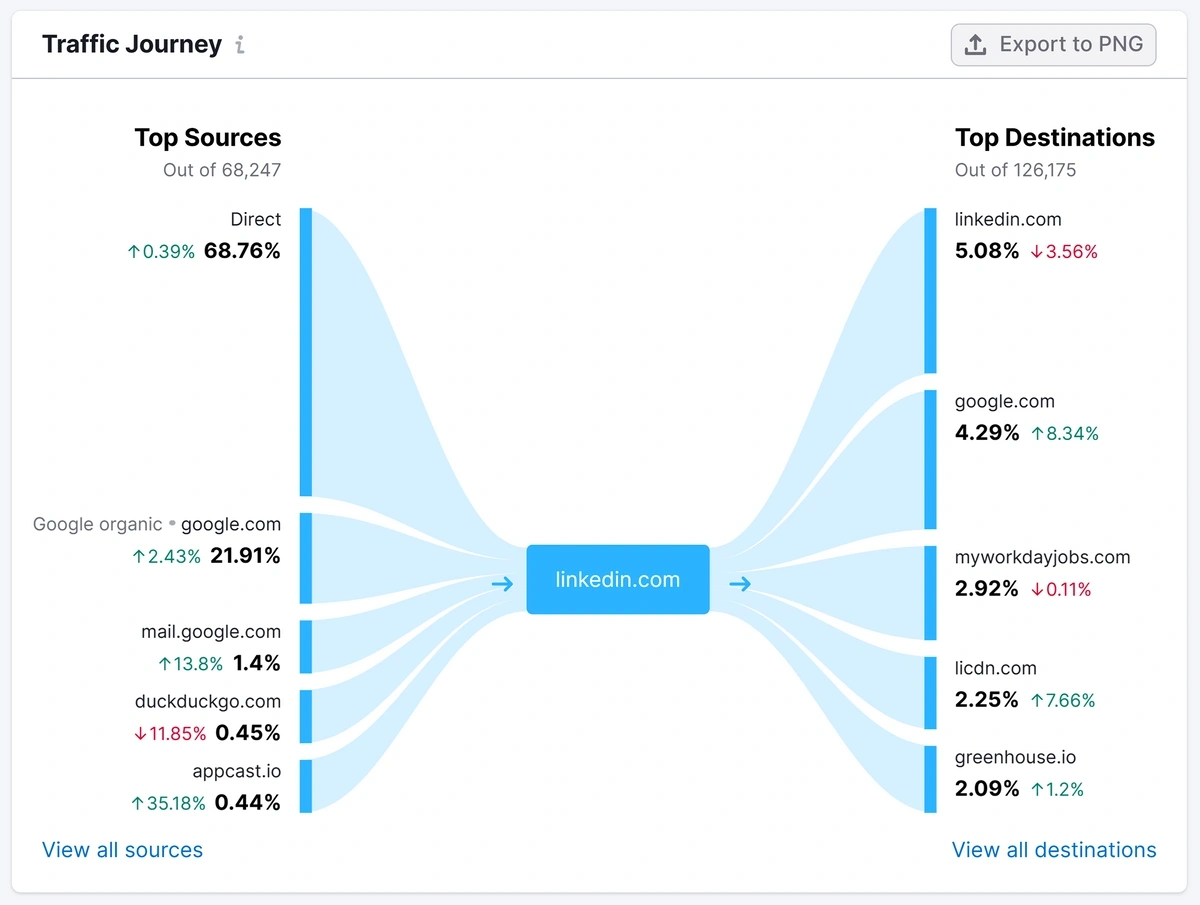
You can uncover this information for your competitors too. Identify traffic sources they’re using that you haven’t tapped into yet.
This often reveals new platforms you can use to drive more users to your site. Tracking the growth of these traffic sources is a valuable way to measure SEO performance that’s often overlooked.
10. Website Authority
Website authority is a measure of a website’s credibility and trustworthiness based on factors like quality of backlinks, organic traffic, and overall SEO performance.
Even though there’s no universally agreed-upon method of measuring website authority, many studies show that high authority websites have a ranking advantage in SERPs.
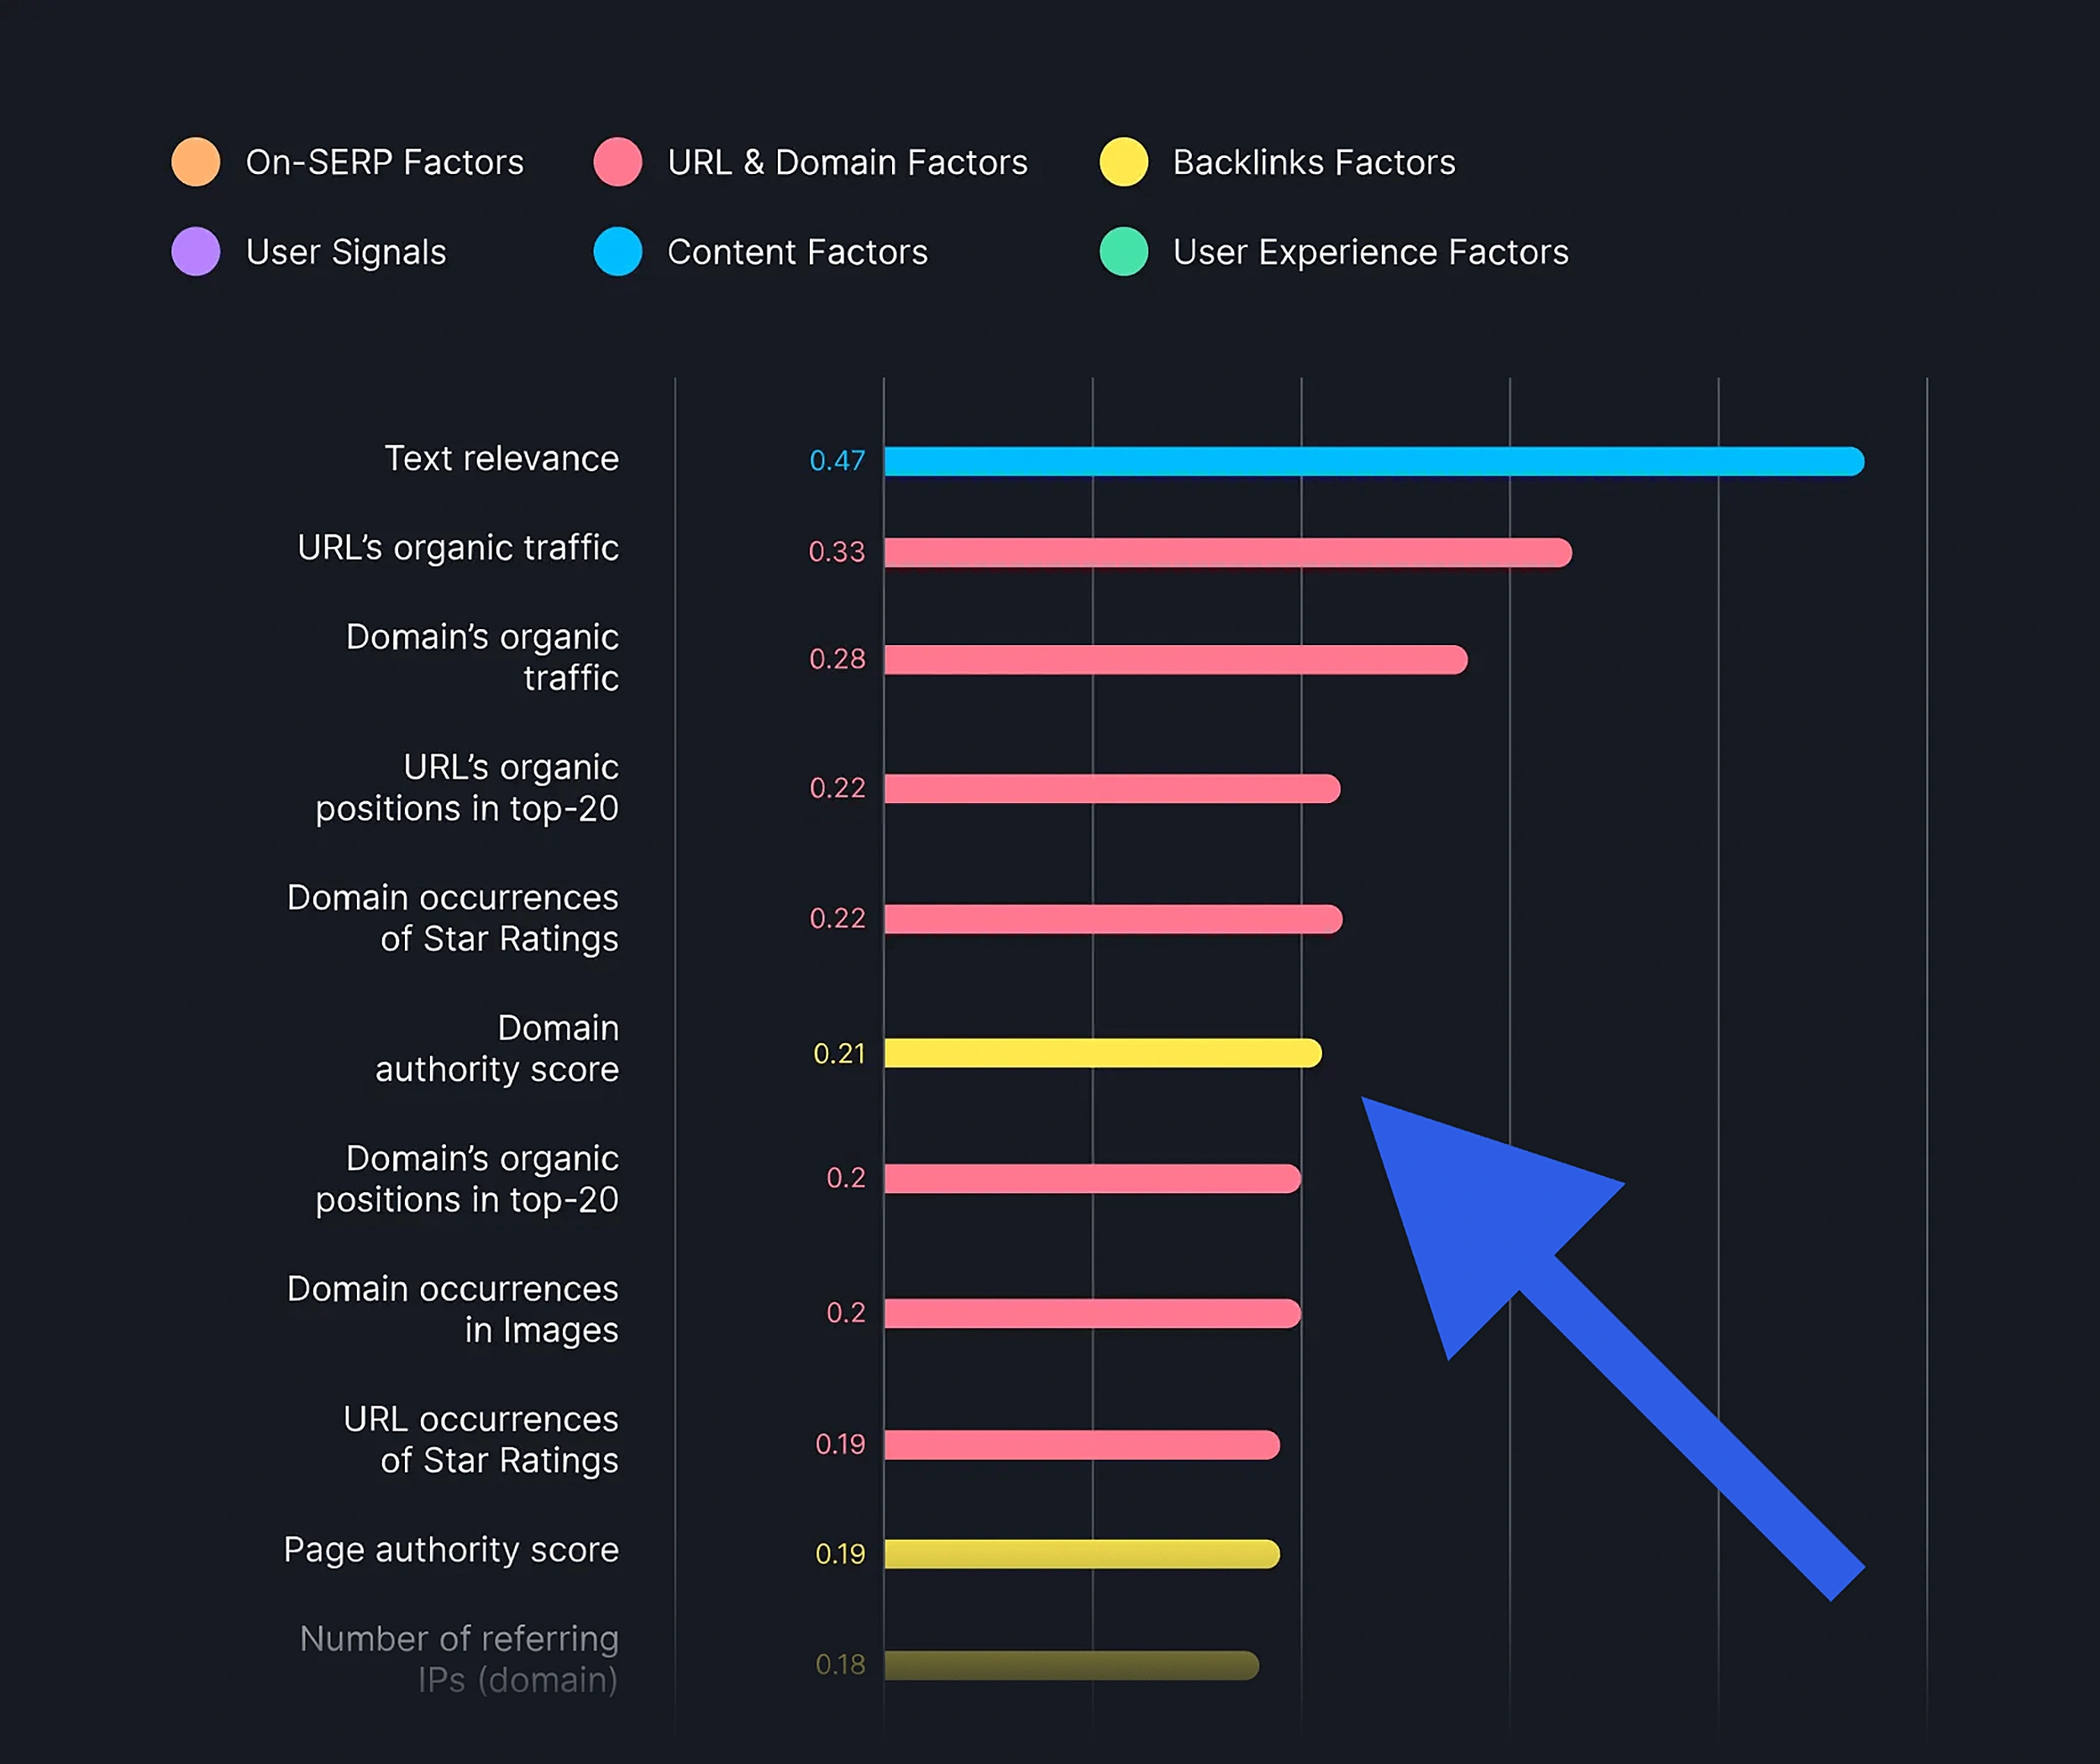
Different SEO tools measure authority differently. Your domain’s exact authority score won’t usually match between different tools, but a strong domain will have a higher score than weaker competitors in any top SEO tool like Semrush.
In addition to authority score being a ranking factor, it’s also an indirect indicator of how strong your brand is.
A strong domain authority means you’re more likely to get AI citations in ChatGPT, Perplexity, and Google’s AI Mode.
How to measure my website’s authority score?
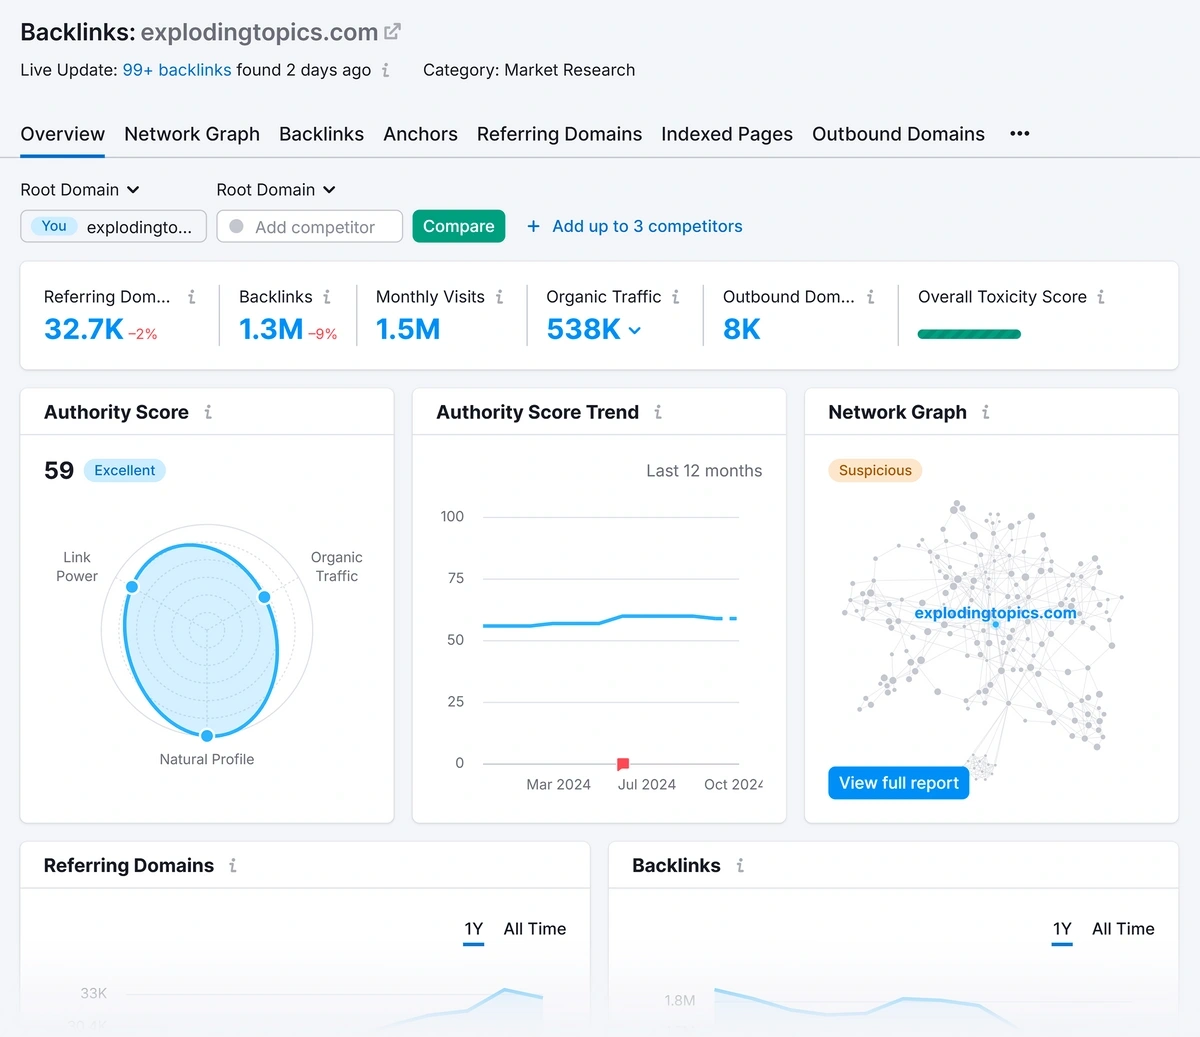
You can measure your site’s authority score (AS) easily using the Semrush Domain Overview tool.
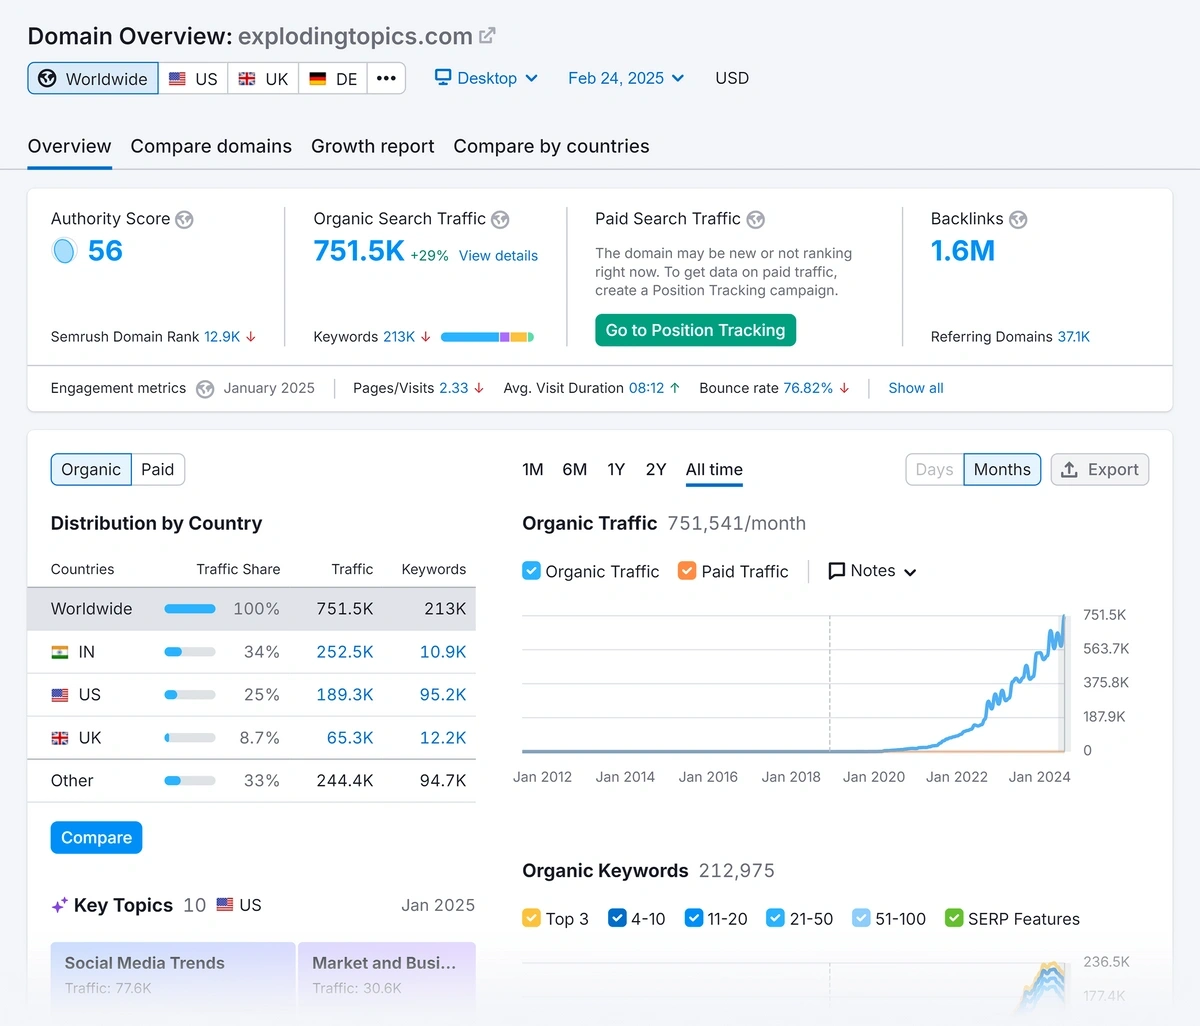
For a more grounded analysis, you can go to the “Compare domains” tab to get a concise snapshot of your and your competitor’s Authority score, keywords, and backlink data.
In fact, you can get a limited but free website authority analysis with our tool as well.
The name of this metric might be different in your SEO tool. For instance, Semrush calls it Authority Score. Moz calls it Domain Authority. And Ahrefs calls it Domain Rating.
Remember, there’s no universal ideal Authority Score. Your goal is to evaluate your competitors and reach at least the same or higher level of authority as your competitors.
One of the most effective ways to grow your website authority is by building backlinks from powerful and relevant domains.
Pro Tip: Website authority changes quite slowly compared to other SEO metrics. You don’t have to track it as frequently as other SEO indicators when measuring your progress.
11. Referring Domains
Referring domains are the number of unique websites linking back to your site.
Link building is a core component of off-page SEO, and it should be a part of your progress tracking.
The more referring domains you have, the stronger your domain’s Authority Score.
In fact, even if you don’t see a measurable difference in your Authority Score after acquiring links, it can still make an impact on your rankings.
So, you’ll need referring domains to grow your website authority. And you’ll also need referring domains to improve your ranking potential for specific pages.
That’s why tracking your referring domains is important.
How to discover referring domains linking to you?
Semrush has one of the largest backlink databases, which allows you to scan your referring domains and links with accuracy.
With the Semrush Backlink Analytics, you get a simple overview of your total referring domains and backlink count, along with other details.
Click the “Referring Domains” tab to reveal all domains linking to you. This report also shows a visual trend of your new referring domains as well as the ones you’ve lost.
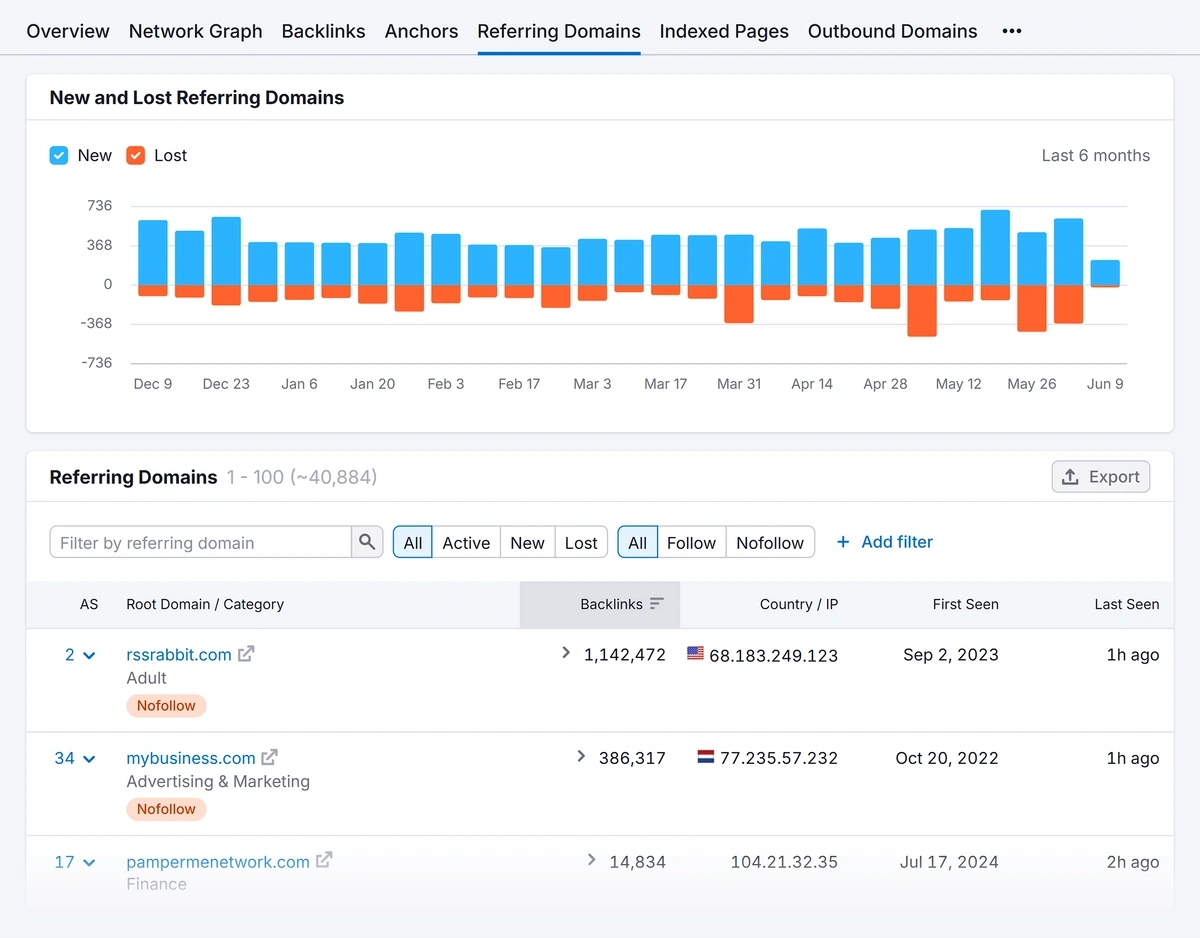
You also have great filters that make it easy to gather actionable intel on your next step. For example, clicking the “Lost” filter will display all the domains that once linked to you but no longer do.
This information allows you to understand why your link might be lost and reach out to the same domains for linking back again.
Remember that the total backlink count doesn’t hold the same weight as creating new links from unique domains.
The greater the variety of websites linking to you, the easier it is for Google to see you as a website with credibility that deserves high visibility.
This is why I recommend focusing on referring domains more than just your raw backlink count when tracking your SEO progress.
Want to Beat Your Competition?
Find out who’s linking to them and build a better backlink strategy.
12. Brand Mentions
Brand mentions are the total count of instances where a brand is referenced online (with or without a direct link to its website).
SEO is no longer just a game of pulling levers to influence the algorithm in your favor.
The broader principles of marketing, like brand presence and perception, are now deeply embedded into SEO strategies.
This is true for both standard search engines and AI answer engines. Answer engines and AI search tools use brand signals as a factor for citing you or ranking on SERPs.
All signs point to branding taking an increasingly crucial role in the new era of SEO. That makes tracking your brand mentions an important part of your SEO performance tracking.
What’s the simplest way to track brand mentions?
The easiest way to track brand mentions is to use the Semrush app called Brand Monitoring.
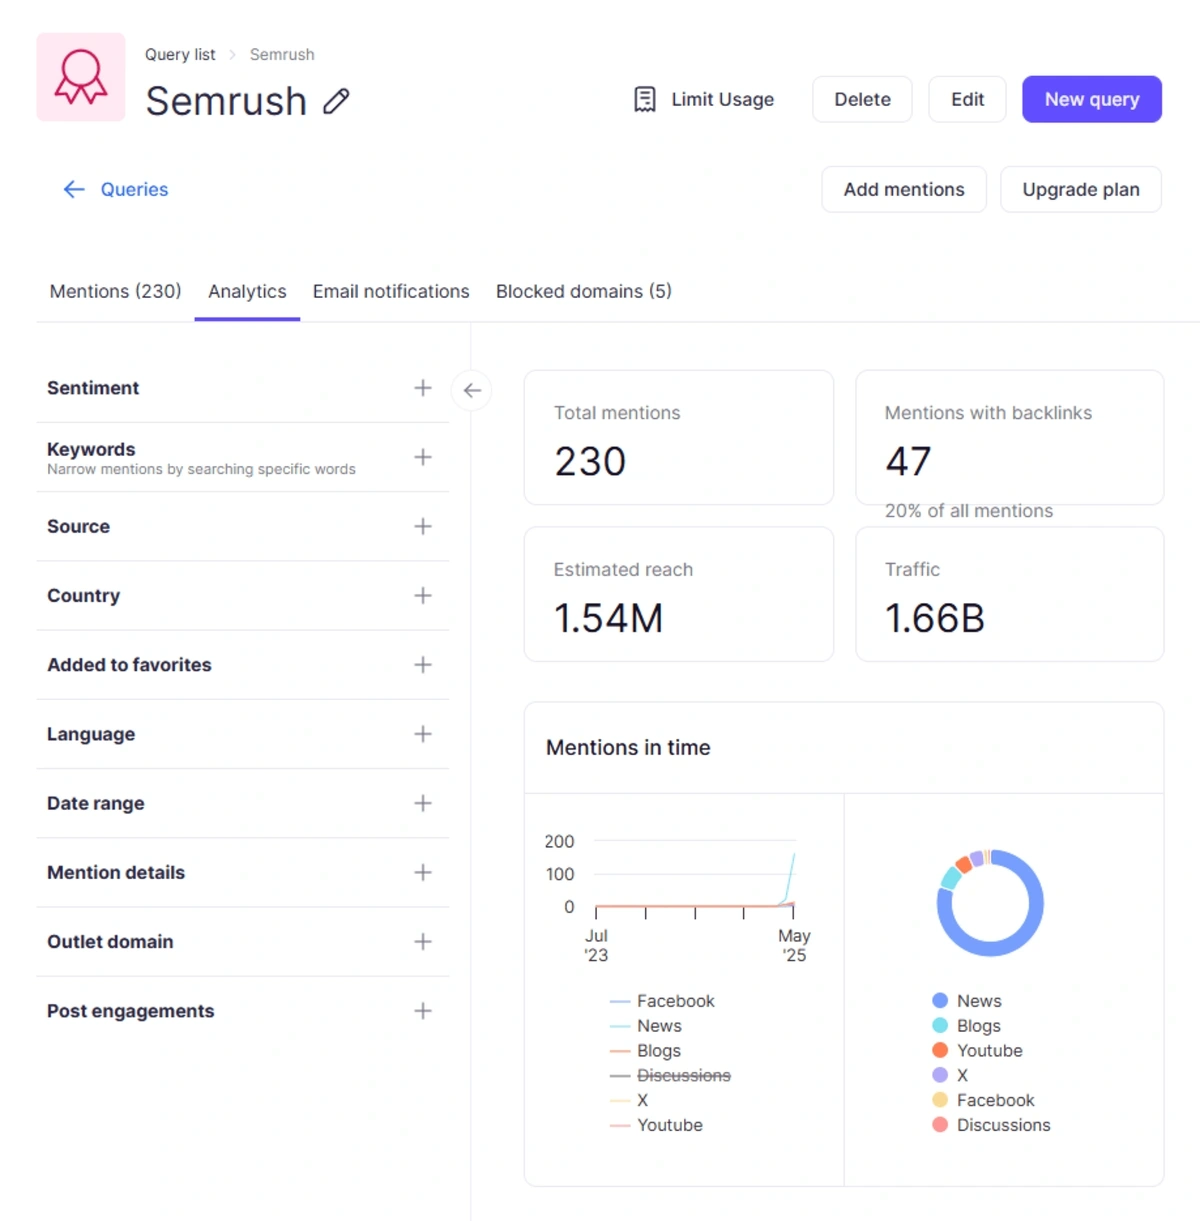
This app automates the process of scanning the web to find references to your brand. It’s not limited to just your branded business name.
You can track any branded features, keywords, and even people.
Besides, this app analyzes sentiments around your mentions. The Brand Monitoring app gives you an effective way to check if the sentiment around each brand reference to you is in a negative or positive light.
You can even use Semrush tools to track your AI brand mentions.
These insights will empower you to extend your brand presence and secure your edge over competitors in the brand-driven future of SEO.
What are the most common SEO performance measurement mistakes?
The most costly SEO measurement mistakes are:
- Tracking vanity metrics instead of metrics that drive brand recognition and revenue
- Failing to consider search intent when interpreting metrics
- Forgetting to account for seasonal fluctuations
As more searchers turn to answer engines and chatbots, knowing what to measure is vital so you understand the value of the visitors you get.
How much should I budget for SEO performance tracking tools?
To measure SEO performance properly, budget $100-500 monthly for enterprise tools like Semrush or Ahrefs.
Measure Your Progress and Take Action
SEO isn’t a space where you can afford to swing blindly and without direction anymore. Measuring your performance gives you that direction.
And tracking SEO metrics doesn’t have to be complicated.
As I showed in this guide, all you need is your GA4, GSC, and a comprehensive SEO tool like Semrush to gather all the insights you’ll need to keep progressing.
You can start by getting your Semrush free trial and using its simple analytical reports to establish your SEO advantage in your niche.
Stop Guessing, Start Growing 🚀
Use real-time topic data to create content that resonates and brings results.

Exploding Topics is owned by Semrush. Our mission is to provide accurate data and expert insights on emerging trends. Unless otherwise noted, this page’s content was written by either an employee or a paid contractor of Semrush Inc.
Share
Newsletter Signup
By clicking “Subscribe” you agree to Semrush Privacy Policy and consent to Semrush using your contact data for newsletter purposes
Written By


Osama is an experienced writer and SEO strategist at Exploding Topics. He brings over 8 years of digital marketing experience, spe... Read more