


Get Advanced Insights on Any Topic
Discover Trends 12+ Months Before Everyone Else
How We Find Trends Before They Take Off
Exploding Topics’ advanced algorithm monitors millions of unstructured data points to spot trends early on.

Keyword Research
Performance Tracking
Competitor Intelligence
Fix Your Site’s SEO Issues in 30 Seconds
Find technical issues blocking search visibility. Get prioritized, actionable fixes in seconds.
Powered by data from
Latest Blog Posts
Featured Case Studies
See what's trending before everyone else
Each week, we'll send you our best Exploding Topics. Plus, expert insight and analysis.
Number of IoT Devices (2024)

The terms “Internet of Things” or “IoT” may not be common in everyday parlance, but these devices certainly are.
In the space of a few years, the IoT space has expanded rapidly.
In fact, IoT devices now comfortably outnumber non-IoT. But just how many active devices are there in 2024? That’s exactly what we will cover in this regularly updated guide.
Contents
- Top IoT Stats
- How Many IoT Devices Are There?
- IoT Devices by Region
- What Proportion of Devices are IoT?
- IoT Adoption Use Cases
Top Stats (Editor’s Choice)
Here are 5 standout IoT stats for 2024:
- There are over 15 billion connected IoT devices worldwide
- The number of active IoT devices is expected to double by 2030
- Greater China has more than 5 billion IoT devices
- Approximately 2 in 3 devices use IoT
- Remote asset monitoring is the most popular use case for IoT
How Many IoT Devices Are There?
According to the latest available data, there are approximately 17.08 billion connected IoT devices.

This figure is expected to almost double to 29.42 billion by 2030.
Source: Transforma Insights
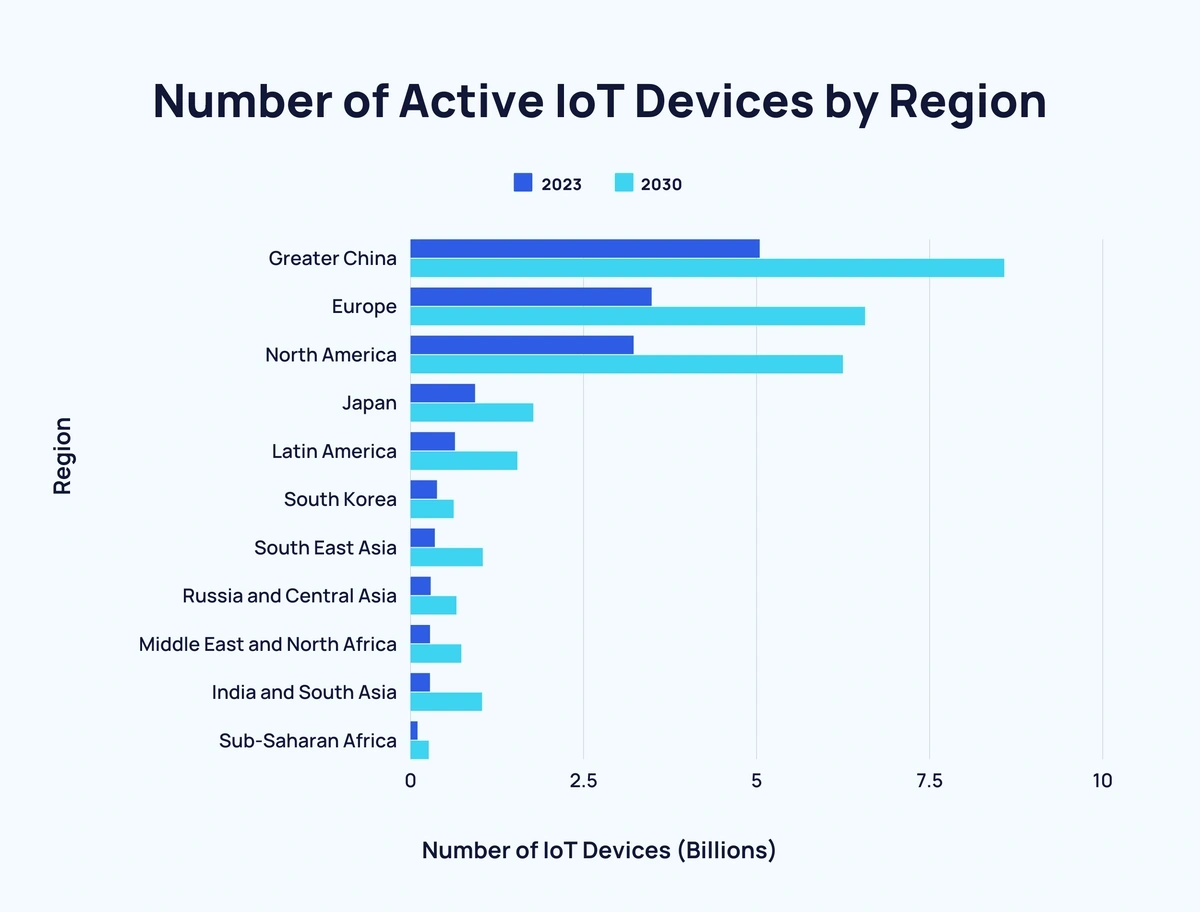
IoT Devices by Region
The number of active IoT devices is expected to grow year-over-year until 2030.
Greater China is the biggest contributor with over 5 billion IoT devices. While North America and Europe each add another 3 billion+ IoT devices to the total.
Here’s a full breakdown of IoT-connected devices by region between 2020 and 2030:
Greater China
|
Year |
Connected IoT Devices |
|
2020 |
3.4 billion |
|
2021 |
3.93 billion |
|
2022 |
4.49 billion |
|
2023 |
5.04 billion |
|
2024 |
5.55 billion |
|
2025 |
6.06 billion |
|
2026 |
6.55 billion |
|
2027 |
7.05 billion |
|
2028 |
7.55 billion |
|
2029 |
8.05 billion |
|
2030 |
8.57 billion |
Europe
|
Year |
Connected IoT Devices |
|
2020 |
2.26 billion |
|
2021 |
2.57 billion |
|
2022 |
3 billion |
|
2023 |
3.48 billion |
|
2024 |
3.92 billion |
|
2025 |
4.36 billion |
|
2026 |
4.8 billion |
|
2027 |
5.24 billion |
|
2028 |
5.68 billion |
|
2029 |
6.12 billion |
|
2030 |
6.56 billion |
North America
|
Year |
Connected IoT Devices |
|
2020 |
2.06 billion |
|
2021 |
2.39 billion |
|
2022 |
2.79 billion |
|
2023 |
3.22 billion |
|
2024 |
3.63 billion |
|
2025 |
4.05 billion |
|
2026 |
4.47 billion |
|
2027 |
4.9 billion |
|
2028 |
5.34 billion |
|
2029 |
5.79 billion |
|
2030 |
6.24 billion |
All Regions
|
Region |
2023 |
2030 |
Change |
Change (%) |
|
Greater China |
5.04 billion |
8.57 billion |
↑ 3.53 billion |
↑ 70.04% |
|
Europe |
3.48 billion |
6.56 billion |
↑ 3.08 billion |
↑ 88.51% |
|
North America |
3.22 billion |
6.24 billion |
↑ 3.02 billion |
↑ 93.79% |
|
Japan |
0.93 billion |
1.77 billion |
↑ 0.84 billion |
↑ 90.32% |
|
Latin America |
0.64 billion |
1.54 billion |
↑ 0.9 billion |
↑ 140.63% |
|
South Korea |
0.38 billion |
0.62 billion |
↑ 0.24 billion |
↑ 63.16% |
|
South East Asia |
0.35 billion |
1.04 billion |
↑ 0.69 billion |
↑ 197.14% |
|
Russia and Central Asia |
0.29 billion |
0.66 billion |
↑ 0.37 billion |
↑ 127.58% |
|
Middle East and North Africa |
0.28 billion |
0.73 billion |
↑ 0.45 billion |
↑ 160.71% |
|
India and South Asia |
0.28 billion |
1.03 billion |
↑ 0.75 billion |
↑ 267.86% |
|
Sub-Saharan Africa |
0.1 billion |
0.26 billion |
↑ 0.16 billion |
↑ 160% |
Source: Transforma Insights
What Proportion of Devices are IoT?
As of 2020, IoT devices outnumbered non-IoT devices globally.
By 2025, IoT devices are expected to outnumber non-IoT by 3:1.
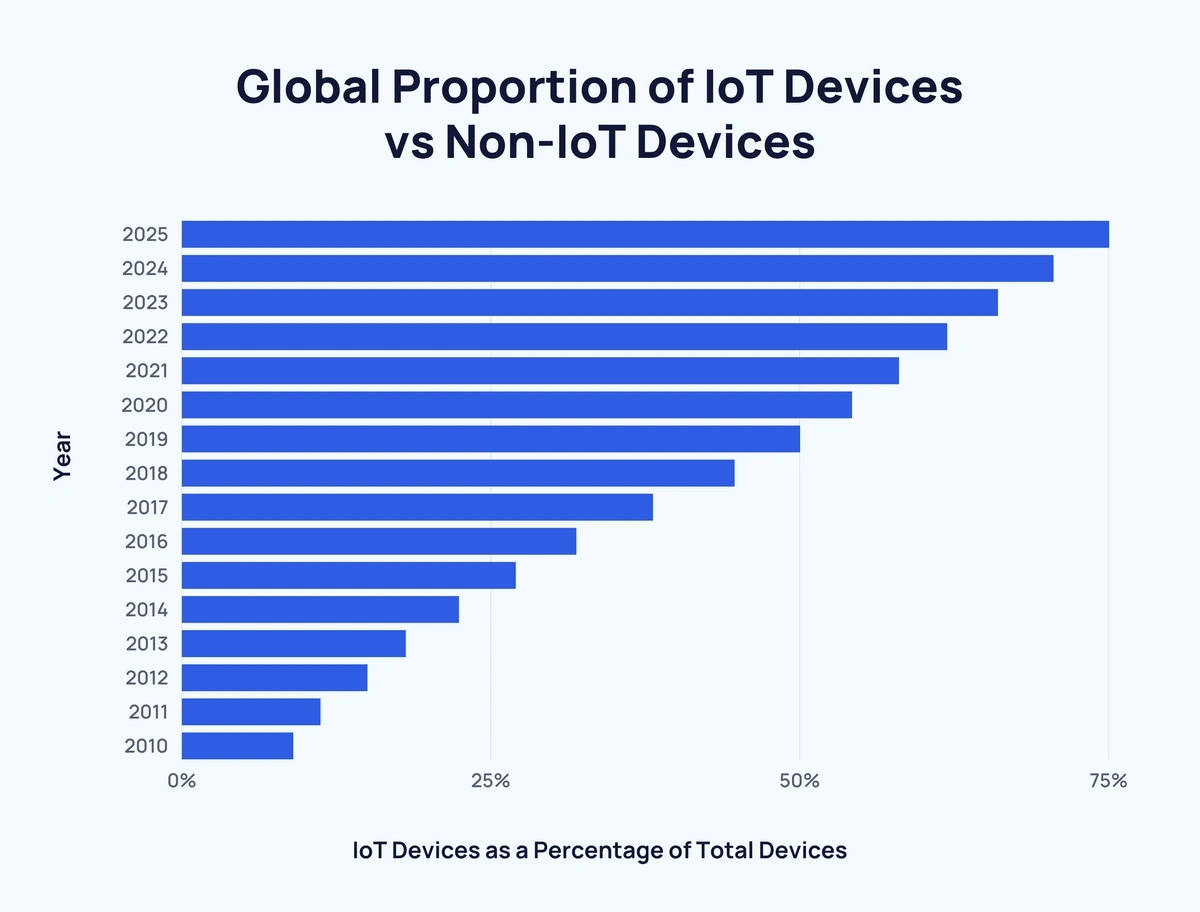
Here’s how the two types of devices compare:
|
Year |
Non-IoT Devices (billions) |
IoT Devices (billions) |
IoT Devices as a Percentage of Total Devices |
|
2010 |
8 |
0.8 |
9% |
|
2011 |
8.7 |
1.1 |
11.2% |
|
2012 |
9.1 |
1.6 |
15% |
|
2013 |
9.5 |
2.1 |
18.1% |
|
2014 |
9.7 |
2.8 |
22.4% |
|
2015 |
9.7 |
3.6 |
27% |
|
2016 |
9.8 |
4.6 |
31.9% |
|
2017 |
9.9 |
6.1 |
38.1% |
|
2018 |
9.9 |
8 |
44.7% |
|
2019 |
10 |
10 |
50% |
|
2020 |
9.9* |
11.7* |
54.2%* |
|
2021 |
10* |
13.8* |
58%* |
|
2022 |
10.1* |
16.4* |
61.9%* |
|
2023 |
10.2* |
19.8* |
66%* |
|
2024 |
10.2* |
24.4* |
70.5%* |
|
2025 |
10.3* |
30.9* |
75%* |
Source: IoT Analytics
IoT Adoption Use Cases
The vast majority (74%) of IoT devices are short-range. While public networks (16%) and private networks (10%) make up the rest of IoT devices.
Here’s a breakdown of IoT devices by tech:
|
IoT Technology | |||
|
Year |
Short Range |
Public Network |
Private Network |
|
2019 |
5.7 billion (74%) |
1.2 billion (16%) |
0.8 billion (10%) |
|
2030 |
17.4 billion (72.5%) |
4.7 billion (19.5%) |
1.9 billion (8%) |
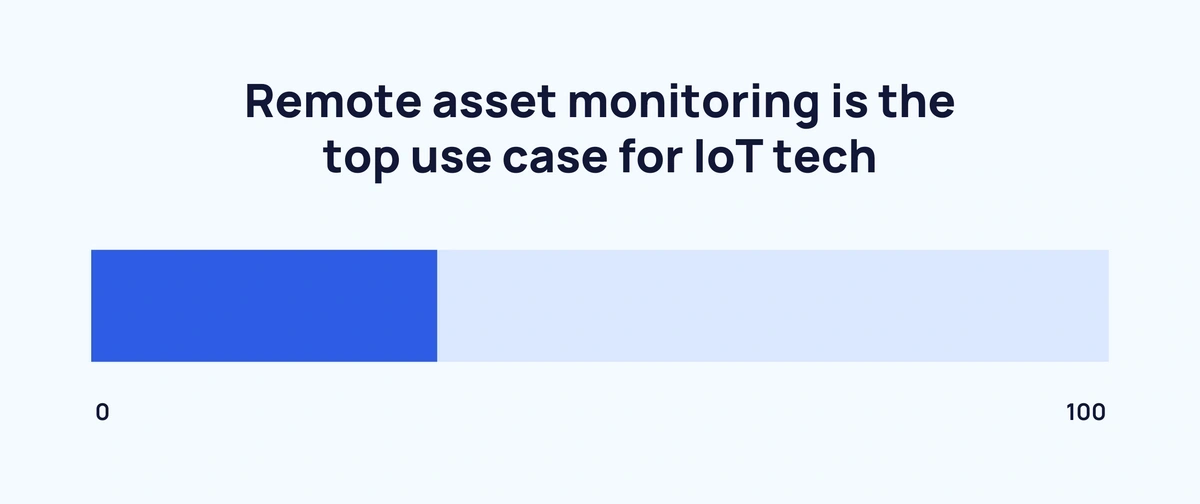
There are several varied use cases for IoT.
A 2021 survey found that 10 IoT use cases have an adoption rate of 29%-34%.
With a 34% adoption rate, remote asset monitoring is the top use case for IoT tech.
Here are the top 10 use cases for IoT devices:
|
Use Case |
IoT Adoption Rate |
|
Remote asset monitoring (read-only) |
34% |
|
Process automation |
33% |
|
Remote asset monitoring and control (read/wire) |
32% |
|
Vehicle fleet management (track/trace) |
31% |
|
Location tracking (eg. GPS) |
31% |
|
Asset/plant performance optimization |
31% |
|
Quality control and management |
30% |
|
Goods condition monitoring in transit |
29% |
|
Predictive maintenance |
29% |
|
On-site track and trace |
29% |
Sources: Transforma Insights, IoT Analytics
Conclusion
That concludes our look at the IoT space in 2024.
Across the board, IoT is expanding at an increasing rate. The only question is just how fast?
For more related content on this topic, take a look at these guides from our site: 80+ Amazing IoT Statistics, 6 Important IoT Trends, 45 Rising IoT Startups.
Stop Guessing, Start Growing 🚀
Use real-time topic data to create content that resonates and brings results.

Exploding Topics is owned by Semrush. Our mission is to provide accurate data and expert insights on emerging trends. Unless otherwise noted, this page’s content was written by either an employee or a paid contractor of Semrush Inc.
Share
Newsletter Signup
By clicking “Subscribe” you agree to Semrush Privacy Policy and consent to Semrush using your contact data for newsletter purposes
Written By


Fabio is a research associate at Exploding Topics. Since 2021, Fabio has researched, written, and edited articles for the Explo... Read more