


Get Advanced Insights on Any Topic
Discover Trends 12+ Months Before Everyone Else
How We Find Trends Before They Take Off
Exploding Topics’ advanced algorithm monitors millions of unstructured data points to spot trends early on.

Keyword Research
Performance Tracking
Competitor Intelligence
Fix Your Site’s SEO Issues in 30 Seconds
Find technical issues blocking search visibility. Get prioritized, actionable fixes in seconds.
Powered by data from
Latest Blog Posts
Featured Case Studies
See what's trending before everyone else
Each week, we'll send you our best Exploding Topics. Plus, expert insight and analysis.
X (Formerly Twitter) User Age, Gender, & Demographic Stats (2026)

Since launching in 2006, Twitter (now X) has become a social media giant.
Elon Musk’s acquisition and the subsequent rebrand brought renewed attention to the platform.
Below, we’ll dive into key data related to X’s user base.
X User Data (Top Stats)
- X gets around 3.8 billion visits per month.
- X is the 15th-largest social platform by user count.
- Only 16% of US teens used X in 2025, down from 33% in 2015.
- X has a male-to-female split of roughly 2:1.
- More than 1 in 5 X users are American.
- The average user spends 11 minutes on X daily, down considerably from 30+ minutes.
- 59.7% of users go to X for news, according to a 2024 study.
- Elon Musk is the most-followed person on X (over 230 million followers in early 2026).
X User Traffic
In December 2025, X received 3.8 billion visits, and 759.7 million unique visitors.
This represents a 2.7% increase in visits, but a 6.5% decrease in unique visitors as compared to the same numbers from December 2024.
Interestingly, "Twitter" remains the top organic keyword for driving traffic to the platform, contributing 8.39% of all traffic as of January 2026. "X" is second (5.59%), followed by "fc barcelona" (1.12%).
Access the above data and much more using Semrush’s 14-day free trial.
It's hard to be 100% confident with any traffic figures, given that X has been battling a major bots problem. In October 2025, Head of Product Nikita Bier announced that 1.7 million bots had been purged from the platform.
However, search volume does indicate genuinely growing interest in X. According to data from Semrush, from January 2025 to January 2026, search volume for "x" has grown by 30.7% among US-based users..
Exploding Topics Pro lets you track search data for anything you like using the Trend Analysis tool. You can also keep an eye on topics by bundling them into groups with Trend Tracking.
And to help you find the next big thing, you'll get a weekly email containing 4 exploding startups, and 4 growing products.
Sources: Semrush, Nikita Bier (X), Exploding Topics Pro
X User Statistics
According to Data Reportal's October 2025 report, there are approximately 557 million active users on X.
That makes it the 15th most popular social media platform.
Not all platforms report users in the same way, so this table is a mix of monthly active users (MAUs) and total potential ad reach (ADV).
|
Rank |
Social Media Platform |
Users |
|
1 |
Facebook (MAUs) |
3.07 billion |
|
2= |
Instagram (MAUs) |
3 billion |
|
2= |
WhatsApp (MAUs) |
3 billion |
|
4 |
YouTube (ADV) |
2.58 billion |
|
5 |
TikTok (ADV) |
1.99 billion |
|
6 |
WeChat (MAUs) |
1.41 billion |
|
7 |
Telegram (MAUs) |
1 billion |
|
8 |
Messenger (ADV) |
942 million |
|
9 |
Snapchat (MAUs) |
932 million |
|
10 |
Reddit (ADV) |
765 million |
|
11 |
Douyin (MAUs) |
728 million |
|
12 |
Kuaishou (MAUs) |
715 million |
|
13 |
Weibo (MAUs) |
588 million |
|
14 |
Pinterest (MAUs) |
578 million |
|
15 |
X (ADV) |
557 million |
|
16 |
QQ (MAUs) |
532 million |
29.2% of internet users aged 16+ self-reported using X within the past month. It is the eighth-largest platform by this metric, behind Telegram and ahead of Pinterest.
According to product head Nikita Bier, X set a record for the number of app downloads in August 2025, beating the previous record by 30%. It then broke the record again in September, also setting a record for new user downloads.
Source: Data Reportal, Nikita Bier (X)
X Users by Age
The majority (around 71.6%) of X users are under 35 years old, according to February 2025 numbers from Statista.
Here’s a breakdown of X users by age:
|
Age Distribution |
Proportion of X Users |
|
13-17 years |
2% |
|
18-24 years |
32.1% |
|
25-34 years |
37.5% |
|
35-49 years |
21.1% |
|
50+ years |
7.3% |
However, despite still skewing young, X is rapidly losing ground among younger users.
Only 16% of US teens used X in 2025, down from 23% in 2022, and 33% in 2015.
WhatsApp and Reddit have overtaken X among teens within the past two years.
Here’s how X compares to other social media in terms of teenage interest over time:
|
Social Media Platform |
Percentage of US Teenagers Using the Platform | ||
|
2025 |
2022 |
2014/15 | |
|
YouTube |
92% |
95% |
- |
|
TikTok |
68% |
67% |
- |
|
|
63% |
62% |
52% |
|
Snapchat |
55% |
59% |
41% |
|
|
31% |
32% |
71% |
|
|
24% |
17% |
- |
|
|
17% |
14% |
- |
|
X (Twitter) |
16% |
23% |
33% |
Sources: SimilarWeb, Pew Research
X Users by Gender
X users are split at a roughly 2:1 ratio among males (63%) and females (37%).
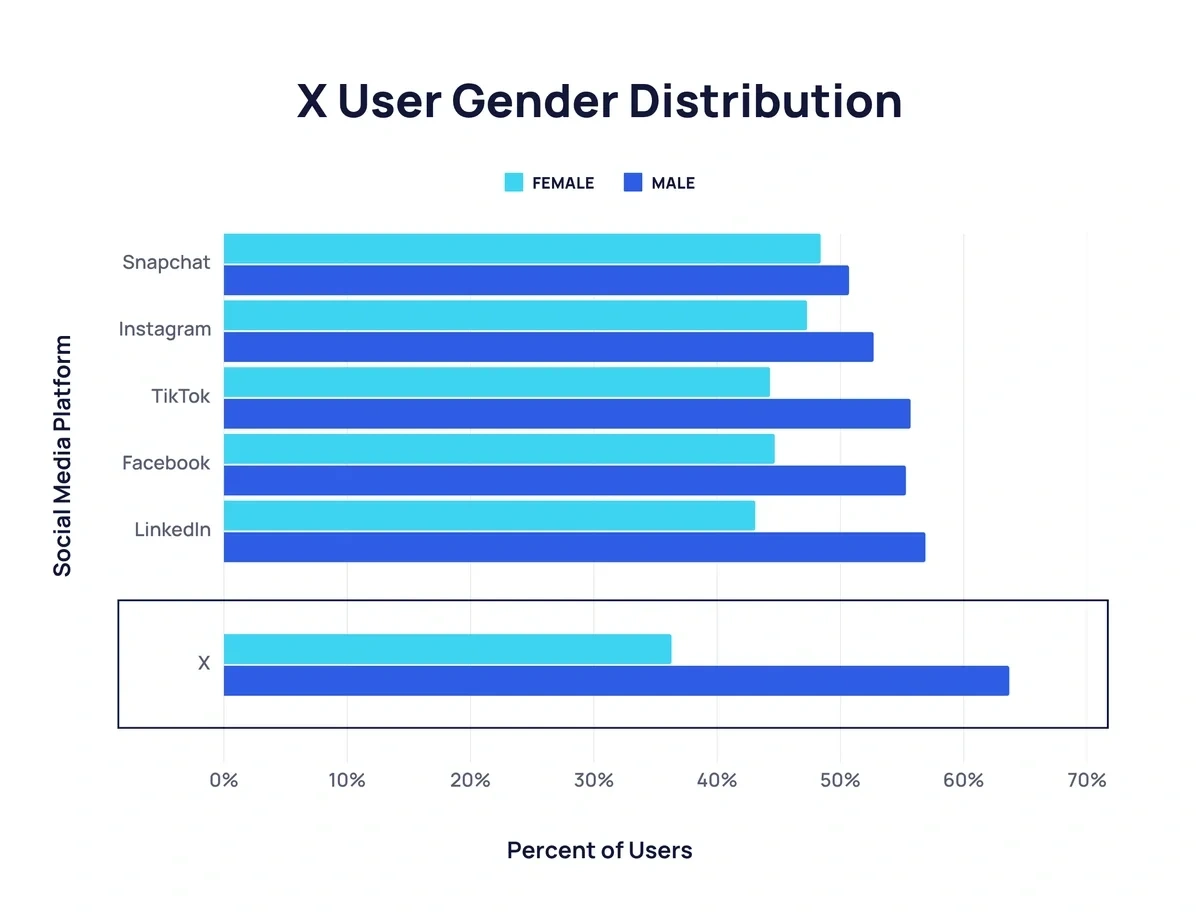
Here’s what the distribution of gender on social media looks like, according to 2025 Statista reports:
|
Social Media Platform |
Female |
Male |
|
Snapchat |
48.4% |
50.7% |
|
|
47.3% |
52.7% |
|
TikTok |
44.3% |
55.7% |
|
|
43.3% |
56.7% |
|
|
43.1% |
56.9% |
|
X |
36.3% |
63.7% |
Source: Statista
X Users by Region
As of January 2026, the US has the largest proportion of unique visitors to the X platform at 22.67%.
Combined, the US and Japan account for more than a third of all X visits.
Want to Spy on Your Competition?
Explore competitors’ website traffic stats, discover growth points, and expand your market share.
Here are the top countries by X traffic, according to Semrush data:
|
Rank |
Country |
Proportion of X Users |
Desktop |
Mobile |
|
1 |
United States |
22.67% |
43.52% |
56.48% |
|
2 |
Japan |
15.84% |
40.67% |
59.33% |
|
3 |
Brazil |
5.2% |
40.16% |
59.84% |
|
4 |
Türkiye |
5.02% |
28.84% |
71.16% |
|
5 |
India |
4.16% |
33.47% |
66.53% |
No country has more X users than the US, with around 100 million.
Per Data Reportal numbers, here are the top 20 countries by X users:
|
Rank |
Country |
X Users (Total Ad Reach) |
|
1 |
United States |
99.04 million |
|
2 |
Japan |
71.19 million |
|
3 |
Indonesia |
22.92 million |
|
4 |
India |
22.17 million |
|
5 |
United Kingdom |
18.96 million |
|
6 |
Germany |
18.95 million |
|
7 |
Turkey |
18.54 million |
|
8 |
Brazil |
17.14 million |
|
9 |
Mexico |
16.37 million |
|
10 |
Saudi Arabia |
14.98 million |
|
11 |
Thailand |
13.31 million |
|
12 |
Hong Kong |
12.42 million |
|
13 |
France |
12.36 million |
|
14 |
South Korea |
10.37 million |
|
15 |
Spain |
9.75 million |
|
16 |
Canada |
9.74 million |
|
17 |
Netherlands |
8.95 million |
|
18 |
Philippines |
7.99 million |
|
19 |
Singapore |
7.78 million |
|
20 |
Finland |
7.58 million |
X User Habits
In December 2025, there were 759.7 million unique X visitors.
Below is a breakdown of their habits on X.
Time Spent on X
According to Semrush data from December 2025, each average X visit lasts 16 minutes and 5 seconds.
However, the total average time spent on X each day is 28 minutes.
Here’s how the average daily time spent on X per user compares to other social media platforms:
|
Platform |
Average Time Spent Per Day |
|
TikTok |
1 hour, 37 minutes |
|
YouTube |
1 hour, 25 minutes |
|
|
1 hour, 13 minutes |
|
|
1 hour, 7 minutes |
|
|
59 minutes |
|
IMO |
53 minutes |
|
Telegram |
30 minutes |
|
X |
28 minutes |
|
|
19 minutes |
|
Messenger |
19 minutes |
|
Snapchat |
17 minutes |
|
Discord |
15 minutes |
|
|
10 minutes |
|
|
6 minutes |
|
Threads |
4 minutes |
And here’s how average daily open rates compare:
|
Social Media Platform |
Average Daily Open Rate |
|
|
85.1% |
|
|
67.4% |
|
|
65.4% |
|
YouTube |
62.6% |
|
TikTok |
61.2% |
|
IMO |
52% |
|
Messenger |
47.2% |
|
Snapchat |
45.4% |
|
X |
42.6% |
|
Telegram |
42.4% |
|
|
40.7% |
|
Discord |
37.3% |
|
Threads |
28.3% |
|
|
28.1% |
|
|
25.5% |
Sources: Semrush, Data Reportal
User Posts on X
10% of X users are responsible for 92% of all posts.
These active users also post 157 times per month – this is compared to just one post per month for the average US adult on X.
Source: Pew Research
Reasons to Use X
Keeping up with news (59.7%) and following or researching brands (38.1%) are the most popular reasons for using X.
Here’s a list of reasons people use X:
|
Reason for Using X |
Proportion of X Users Who Agree |
|
News |
59.7% |
|
Follow brands/companies |
38.1% |
|
Entertaining content |
35.7% |
|
Photo/video sharing |
28.3% |
|
Message friends and family |
19.4% |
The high score for news actually makes X the top platform for keeping up to date with current events.
Source: Data Reportal
X Preferences
According to DataReportal’s October 2025 data, 99.9% of X users also use another social media platform.
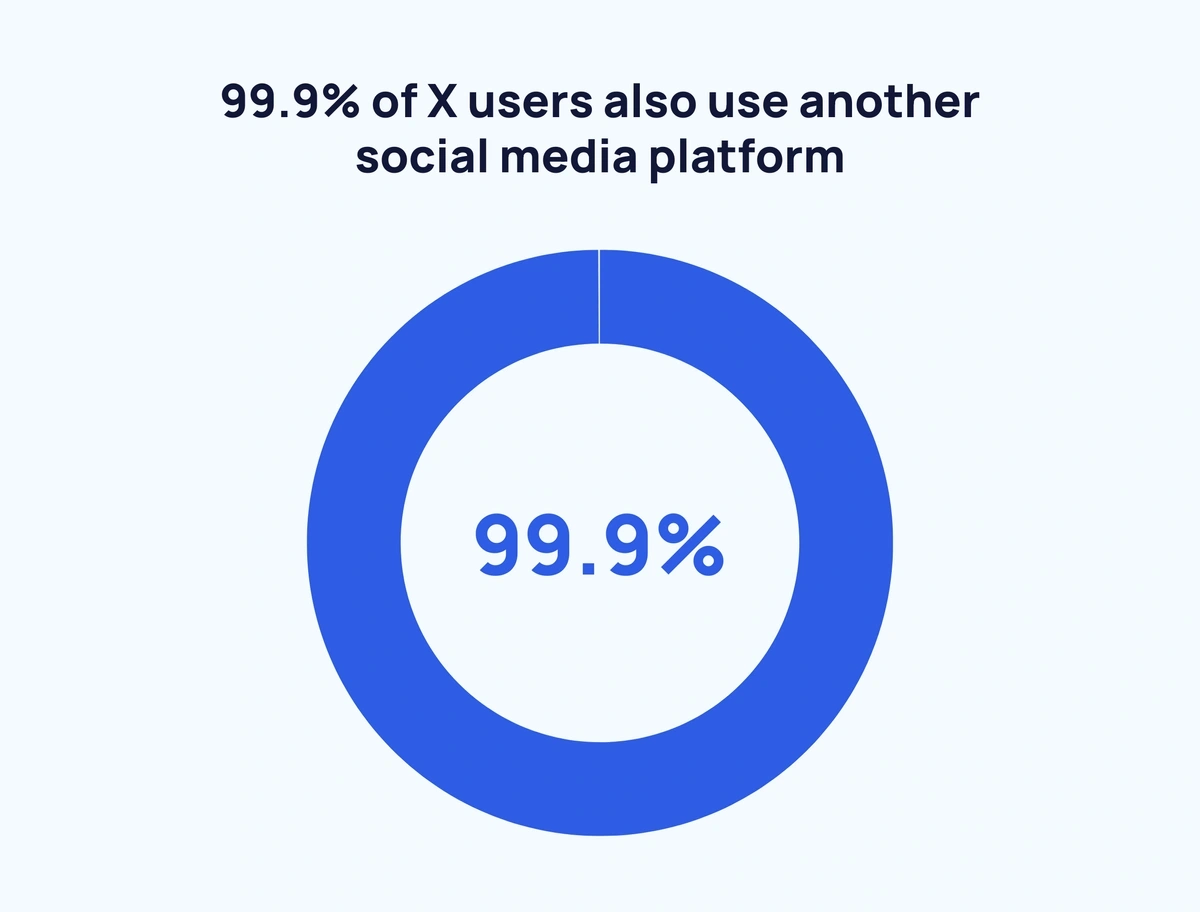
The biggest overlap comes from Instagram, where 88.1% of X users also have an account – this is closely followed by Youtube (81%) and Facebook (80.5%).
Here are the most popular social media platforms for X users:
|
Social Media Platform |
Proportion of X Users Also Using |
|
|
88.1% |
|
YouTube |
81% |
|
Facbook |
80.5% |
|
|
77.5% |
|
TikTok |
64.3% |
|
Telegram |
60.4% |
|
|
43.1% |
|
|
41.7% |
|
Snapchat |
39.4% |
|
|
25.7% |
|
Discord |
22.3% |
|
Line |
14.1% |
Source: Data Reportal
Most Popular Accounts on X
Elon Musk has the most-followed account on X with over 230 million followers.
As of August 2025, 7 accounts have over 100 million followers.
|
Rank |
Account |
Posts |
Followers |
|
1 |
elonmusk |
86,000+ |
230 million+ |
|
2 |
BarackObama |
17,000+ |
130.1 million+ |
|
3 |
Cristiano |
4,000+ |
115.2 million+ |
|
4 |
realDonaldTrump |
59,000+ |
109.8 million+ |
|
5 |
narendramodi |
47,000+ |
108.9 million+ |
|
6 |
justinbieber |
31,000+ |
107.8 million+ |
|
7 |
rihanna |
10,000+ |
106.9 million+ |
|
8 |
katyperry |
12,000+ |
103.3 million+ |
|
9 |
taylorswift13 |
800+ |
93 million+ |
|
10 |
NASA |
73,000+ |
88 million+ |
Sources: Creators Jet
Key Takeaways
Whether you choose to call it Twitter or X, it remains a hugely influential player in the social media space.
And X looks firmly here to stay. But it faces a battle to engage younger audiences and women.
For more related statistics, take a look at:
Stop Guessing, Start Growing 🚀
Use real-time topic data to create content that resonates and brings results.

Exploding Topics is owned by Semrush. Our mission is to provide accurate data and expert insights on emerging trends. Unless otherwise noted, this page’s content was written by either an employee or a paid contractor of Semrush Inc.
Share
Newsletter Signup
By clicking “Subscribe” you agree to Semrush Privacy Policy and consent to Semrush using your contact data for newsletter purposes
Written By


Fabio is a research associate at Exploding Topics. Since 2021, Fabio has researched, written, and edited articles for the Explo... Read more