


Get Advanced Insights on Any Topic
Discover Trends 12+ Months Before Everyone Else
How We Find Trends Before They Take Off
Exploding Topics’ advanced algorithm monitors millions of unstructured data points to spot trends early on.

Keyword Research
Performance Tracking
Competitor Intelligence
Fix Your Site’s SEO Issues in 30 Seconds
Find technical issues blocking search visibility. Get prioritized, actionable fixes in seconds.
Powered by data from
Latest Blog Posts
Featured Case Studies
See what's trending before everyone else
Each week, we'll send you our best Exploding Topics. Plus, expert insight and analysis.
How to Master E-commerce Demand Forecasting + Find More Profitable Products

Have you ever ordered too much of a product that quickly stops selling? Or ordered too little of something that takes off? Or maybe you've spotted the next big trending product just a touch too late—after a competitor already pretty much owns it.
Consumer trends now move at breakneck speed thanks to viral sharing platforms like TikTok and Instagram, making e-commerce demand forecasting much more difficult than it used to be.
If you’re only using historical data, you’re missing a big part of a product’s potential. Instead, you need to combine that historical sales data (what's actually sold, when, and at what velocity) with forward-looking signals that predict where demand is heading.
When you combine the two, you get smarter inventory decisions, fewer stockouts, less dead stock, and a better shot at catching the next big product trend before it peaks.
In this guide, I’ll walk you through a step-by-step process to master e-commerce demand forecasting and predict which new products you should stock next.
Before jumping into the tutorial, here are a few things you should know.
What is E-commerce Demand Forecasting?
E-commerce demand forecasting is the process of predicting how much of a product customers will want to buy over a future time period. Brands use those predictions to make decisions about inventory, purchasing, production, pricing, and marketing spend.
Done well, forecasting keeps your inventory aligned with actual demand, reduces dead stock, and ultimately helps you grow your business faster.
Why Spend Your Valuable Time on E-commerce Demand Forecasting?
You’re a busy e-commerce business owner, and you’ve gotten inventory decisions mostly right in the past. So why spend time and resources on forecasting?
Well, a significant portion of your working capital is usually tied up in inventory, right? Buy too much and you tie up capital in excess inventory; buy too little and you lose revenue to stockouts.
That’s where demand forecasting comes in.
Accurate demand forecasting protects you on both ends. When you know what to expect, you order the right quantities at the right time, which keeps carrying costs down and fulfillment rates up. You also reduce the need for last-minute purchase orders, which often come with raised prices from suppliers and expedited shipping fees that eat into your margins.
E-commerce forecasting:
- Improves how you allocate marketing spend
- Improves inventory accuracy and minimizes excess inventory/stockouts (inventory de-risking)
- Reduces emergency and expedited purchase costs
- Aligns inventory with planned promotions and product launches
- Lowers carrying costs and warehouse storage expenses
- Reduces markdowns, write-offs, and end-of-season discounting
- Reduces manual spreadsheet work and planning guesswork
- Creates a scalable foundation for growth into new markets or channels
And for trend-driven categories like eco-friendly products, wellness, or seasonal goods, forecasting also gives you a timing advantage. Brands that identify rising demand early can build inventory and launch content while competitors are still catching up.
Master E-commerce Demand Forecasting in 6 Steps
Follow these six steps to start or improve your forecasting process and grow your store faster.
Step 1: Define Your Forecasting Window and Goals
Before you pull any data, get clear on what you're actually trying to forecast and over what time period. A short-term forecast covering the next 4–12 weeks will drive different decisions than a long-term forecast looking out 6–12 months.
The differences:
- Short-term forecasts are mostly operational. You're answering questions like: when do I need to reorder this SKU, how much safety stock do I need heading into the holiday season, and which products need a promotional push to move excess inventory?
- Long-term forecasts are strategic. You're deciding whether to expand into a new product category, how to structure your next supplier contract, or whether a rising trend has enough staying power to justify a large inventory commitment.
You’ll most likely need both running at the same time. The key is keeping them separate so one doesn't distort the other. For example, a viral sales spike in week three shouldn't skew your 12-month category forecast.
Step 2: Pull and Clean Your Historical Sales Data
Your historical sales data is the foundation of any reliable forecast. Start by pulling at least 12–24 months of sales data (if you’ve got it), broken down by SKU.
Your primary data sources will be:
- Your e-commerce platform (Shopify, WooCommerce, Amazon Seller Central)
- Your inventory management system if you use one
- Any 3PL reporting dashboards
Pull unit sales, revenue, return rates, and dates. But don't stop at sales data alone! Your site analytics contain demand signals that your transaction history misses entirely.
Cart abandonment rates, for example, show you products customers wanted but didn't buy, which can reveal unfulfilled demand that never shows up in your revenue numbers. If you run promotions regularly, note those dates as well.
Once you have the data, clean it before you do anything else. Look for three things in particular to clean:
- First, identify stockout periods—days or weeks when you had zero sales not because demand dropped, but because you had no inventory to sell. Those zeroes could suppress your demand estimate and cause you to under-order. Replace them with an estimated demand figure based on your sales in surrounding weeks.
- Second, flag one-time anomalies like a viral social media moment or a press feature that drove an unusual spike. Those events are real, but they're not repeatable baselines.
- Third, check for duplicate entries, unit-of-measure errors, or data gaps from platform migrations.
After cleaning, look for seasonal patterns. Plot your weekly or monthly sales by SKU over the full data period and look for recurring peaks and troughs. Seasonality is one of the most predictable demand variables you have, so make sure to use it for seasonal inventory management.
Step 3: Identify Emerging Product Trends
Historical data tells you what customers wanted. It can't tell you what they're starting to want right now, especially for product categories that didn't exist in your catalog last year.
For a peek into future trends and an opportunity to stock up-and-coming products before your competitors, check out Exploding Topics.
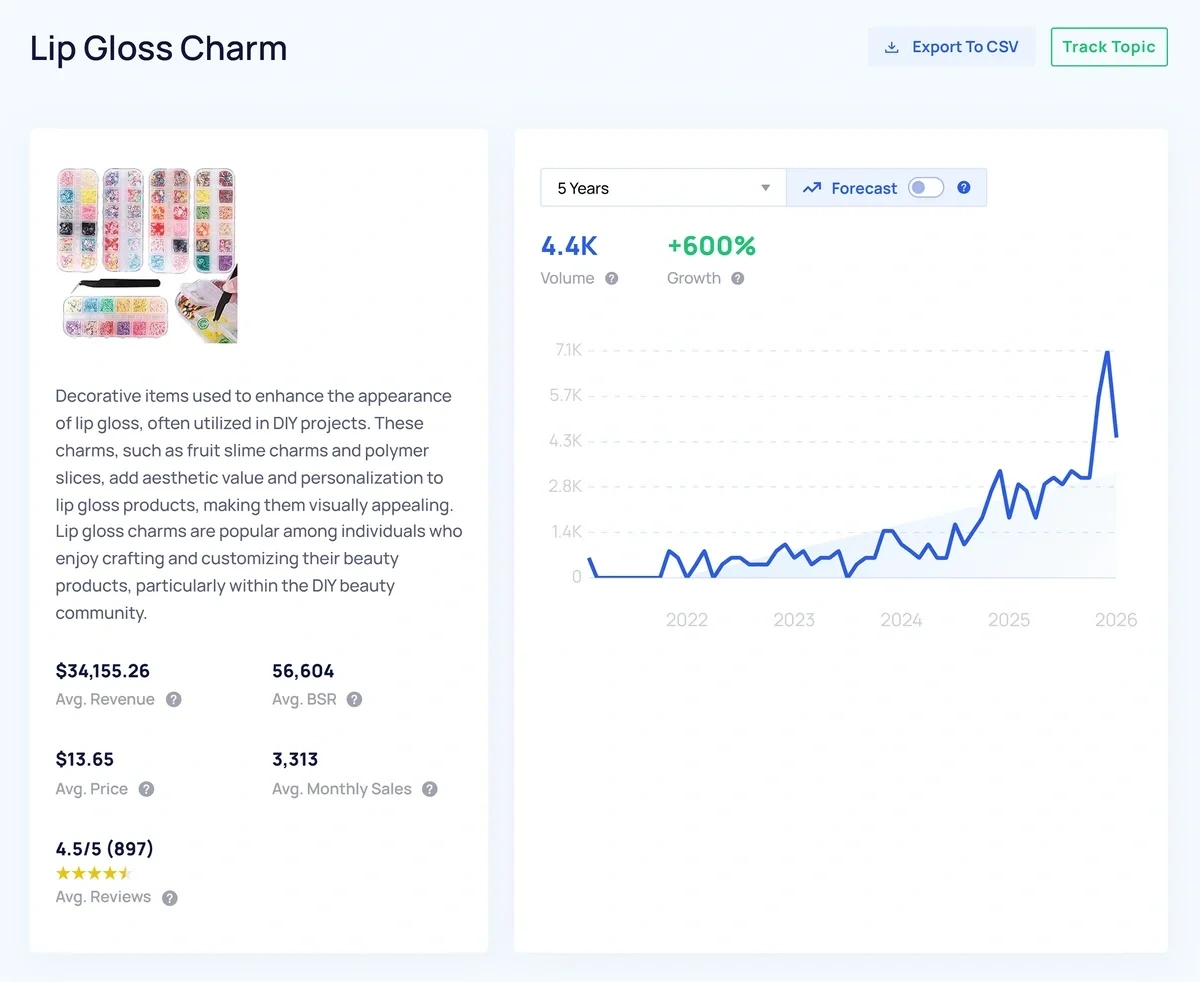
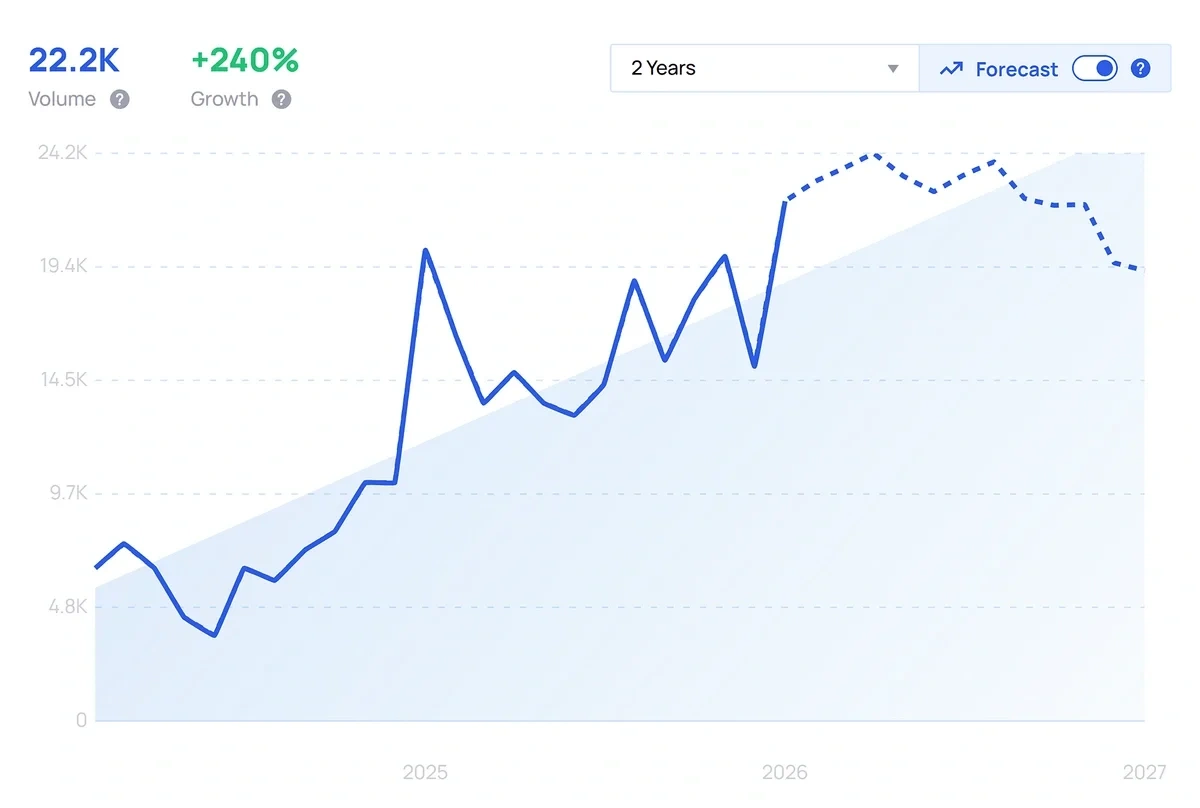
Exploding Topics tracks search and interest trends across thousands of products and topics and surfaces ones with a history of steady, compounding Google search volume growth over months or years. It also provides a forecast for the next year so you can find the best growing-yet-not-peaked products for your store.
Start by opening the “Trending Products” dashboard:
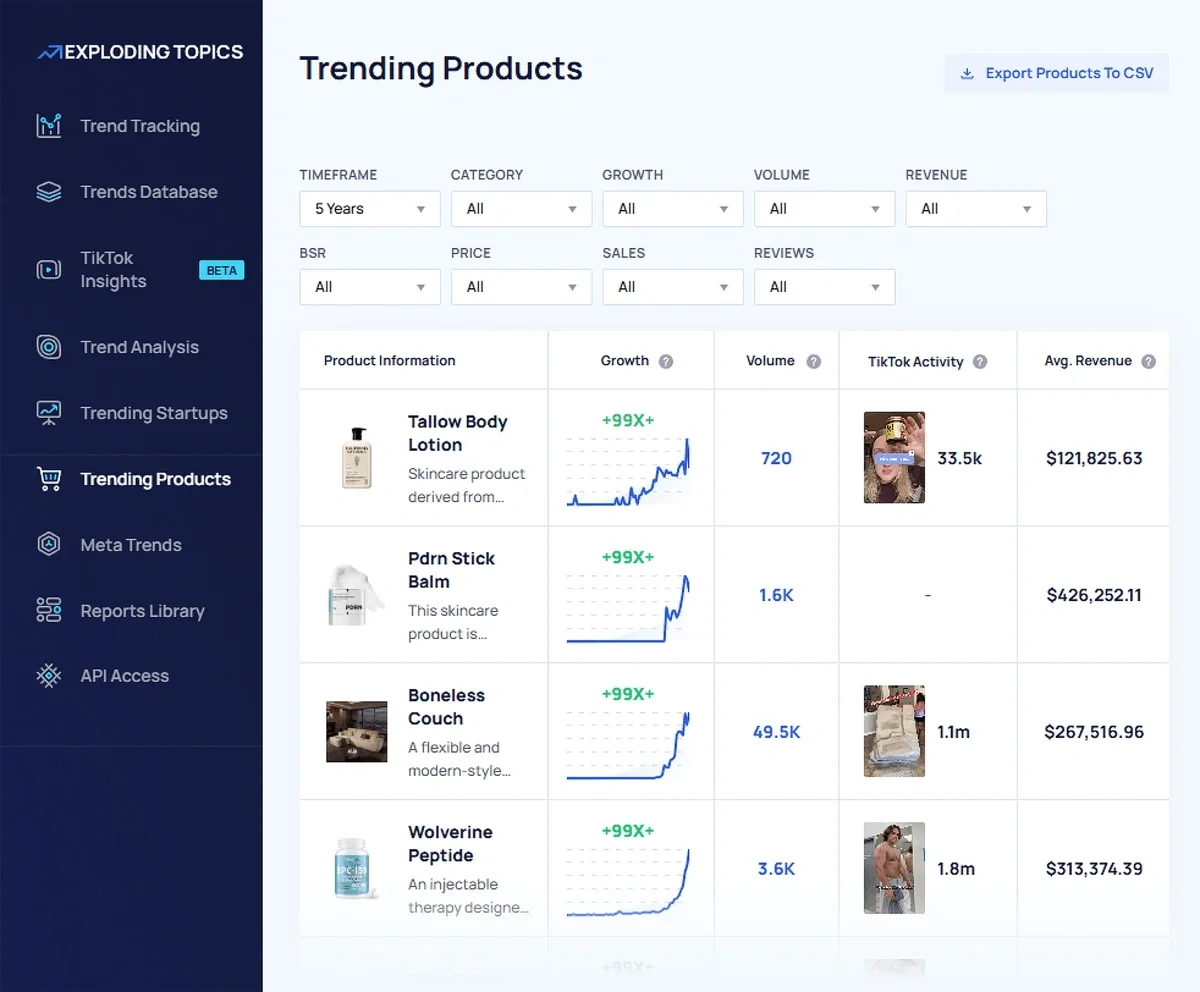
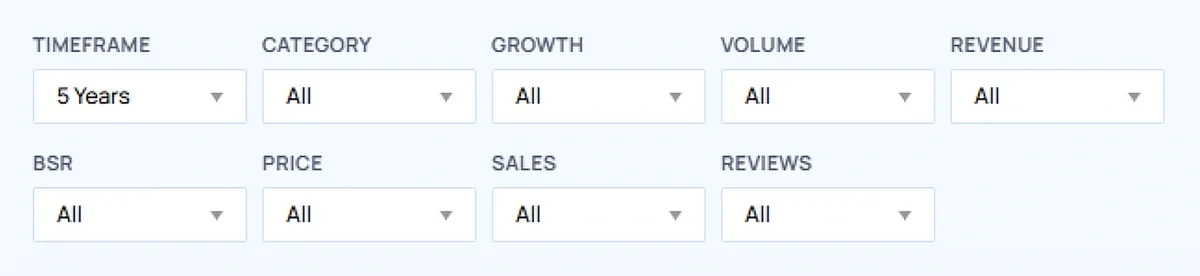
Here, you can use the 9 different filters to find the most relevant trending products:
Once you see a promising product you’d like to explore a bit deeper, click into it. On the product detail page, you’ll find:
- A channel breakdown indicating which channels the product is being mentioned on
- Key indicators like growth, speed, seasonality, and forecast
- Product categories
- Top-selling products/brands on Amazon
- Related products
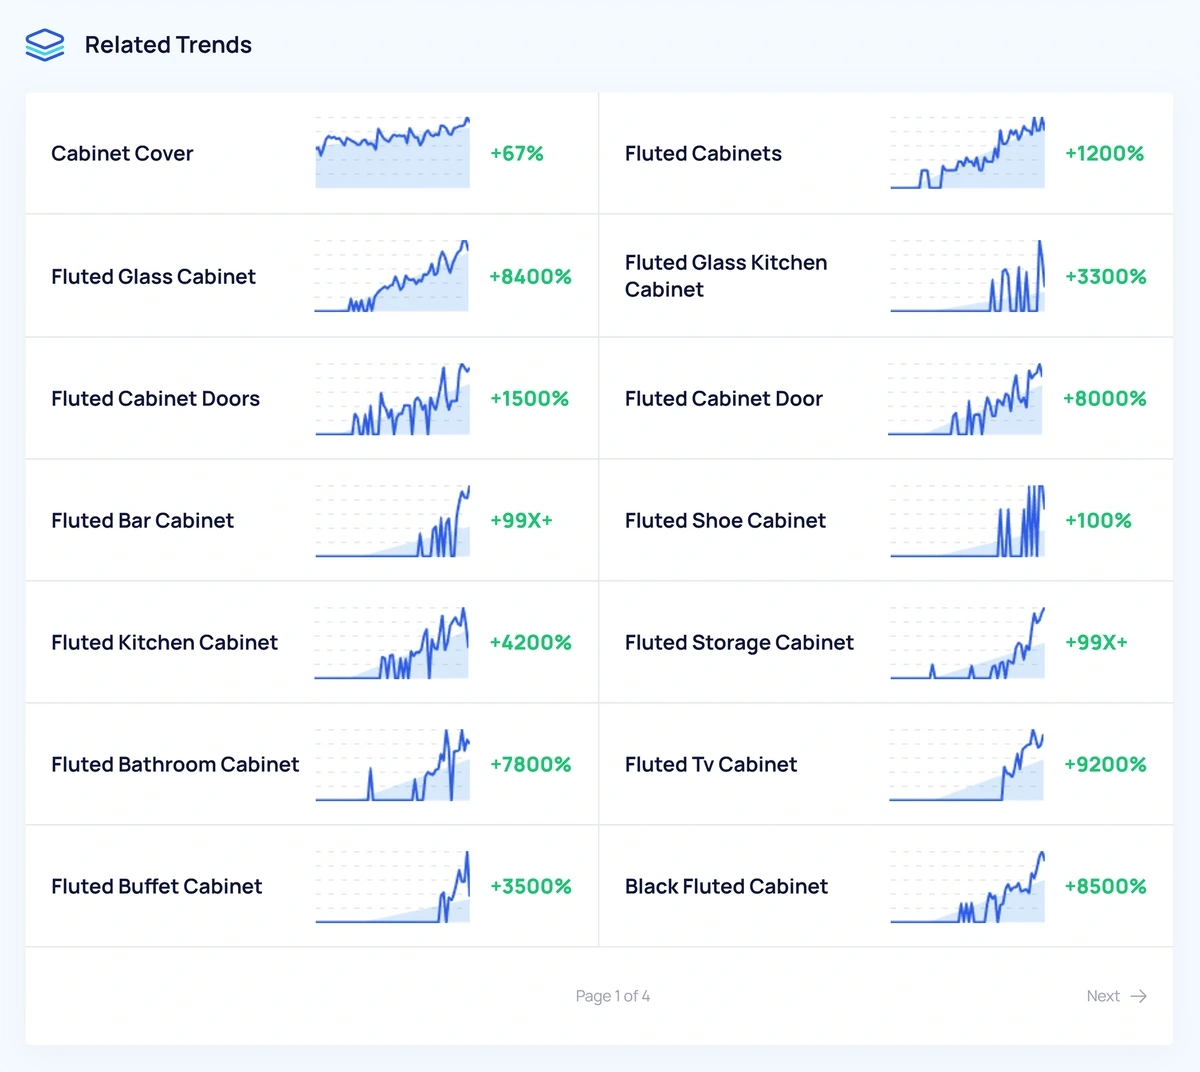
- Related trends
If a trend is rising in your niche but you don't yet carry a product that addresses it, you have a lead time advantage—you can source, list, and build E-commerce SEO content around it while competitors are still catching up.
Use what you find to test your long-term forecasts. If you were planning a modest inventory for a product category that Exploding Topics shows accelerating in interest, that's a signal to revisit your assumptions.
And if a product or trend is projected to keep climbing over the next 12 months, for instance, you can build that into your reorder plans and stock calculations rather than going only by your historical sales.
Conversely, if a category you were planning to expand into shows a peaked or declining forecast, you have data to justify stocking less.
Step 4: Choose a Forecasting Method
Now, with your clean historical data and trend signals in hand, you need a method to turn that information into an actual forecast. Forecasting methods generally fall into two categories: passive and active.
Passive forecasting uses your historical sales data to project forward. It works best for stable, established product lines where demand is relatively predictable from one period to the next.
Active forecasting incorporates external data such as market research, trend signals, economic indicators, and consumer behavior data alongside your sales history. It's better suited for trend-sensitive categories or any product where external factors are likely to shift the demand.
You’ll probably want a blend of both passive and active forecasting. Your core catalog might run on passive forecasting with a seasonal adjustment, while newer or trend-driven SKUs would benefit from checking active signals like the Exploding Topics data you gathered in Step 3.
Within those categories, the specific method you choose depends on how much data you have and how much complexity your operation can support.
A moving average is a practical starting point. A simple moving average takes your average unit sales over a defined period (like the last 12 weeks) and projects that forward. A weighted moving average does the same thing but gives more influence to recent weeks, which is useful if your sales are trending up or down.
If your products have strong seasonal patterns, layer in a seasonal index. Calculate the ratio of each month's sales to your annual monthly average, then apply that multiplier to your baseline forecast. For example, a product that historically sells 40% above average in November gets a 1.4x multiplier applied to whatever your baseline projection is for that month.
If you have a longer sales history and more SKUs, you may benefit from a time-series analysis, which detects trends and seasonal cycles in your data automatically. These are typically built into demand planning software rather than done manually in a spreadsheet.
For new products where you have no sales history, shift to qualitative methods: look at comparable product launches in your catalog, use Exploding Topics trend data to gauge interest trajectory, and factor in supplier minimums and your risk tolerance.
If you don’t currently have software to handle these, you can find a few helpful tutorials through the Association of Chartered Certified Accountants (ACCA).
Step 5: Build Your Forecast and Set Reorder Points
With your method chosen, build out your forecast SKU by SKU for your timeframe. For each product, produce two numbers: your demand estimate (how many units you expect to sell) and your reorder point (the inventory level at which you need to place a new purchase order to avoid a stockout).
Your reorder point accounts for two things: lead time and safety stock.
Lead time is how long it takes from placing a purchase order to receiving inventory.
Safety stock is a buffer you hold above your expected demand to absorb forecast errors or supply chain delays.
A simple formula for reorder point is:
(average daily sales × lead time in days) + safety stock
For safety stock, a common approach is to multiply your average daily sales by the number of days of buffer you want to hold. How many days of buffer depends on how variable your demand is and how reliable your supplier lead times are.
Keep in mind that trend-driven products, like anything you've flagged as emerging in Exploding Topics, warrant a more conservative buffer, since demand can accelerate faster than your lead time allows you to respond.
Document your assumptions as you build. If your forecast turns out to be wrong, you can note whether the error came from a bad demand estimate, an unexpected lead time change, or a supplier issue. Those audit notes will make your next forecast better.
Step 6: Review and Update Your Forecast Regularly
A forecast is a living model, not a one-and-done task. Set out to review it monthly at minimum, comparing your forecast against actual sales for each SKU.
Revisit your Exploding Topics data at the same interval. Trends can shift quickly, and a category you flagged as emerging three months ago, for example, might now be approaching its peak or continuing to accelerate. Keeping your trend signals current makes sure your long-term forecasts reflect the current market, not the one you mapped out a few months ago.
You can even automate a lot of this process using the Exploding Topics API, one of a number of really helpful E-commerce APIs.
How AI Is Changing E-commerce Demand Forecasting
Traditional forecasting methods work the best when demand is relatively stable and your sales history is long enough to show meaningful patterns. If that’s not true for your business, you’d definitely benefit from AI-powered forecasting.
Whereas a moving average or seasonal index can process the data you feed it manually, machine learning models can ingest dozens of variables (sales velocity, competitor pricing, social media signals, weather patterns, etc.) and identify relationships between them that no human analyst would spot in a spreadsheet.
The more data the model sees over time, the more accurate its predictions become.
The most practical application of AI in forecasting right now (unless you’re a large business) is using tools that already have AI built in. Demand planning platforms like Inventory Planner and Cin7 use AI to automate replenishment recommendations and flag anomalies in your sales data.
Exploding Topics also uses AI to find rising consumer interest trends from search and social behavior at scale, detecting signals that would be incredibly difficult to track manually.
AI also changes how quickly you can respond to forecast errors. Traditional models are updated on a fixed schedule, whereas AI-powered systems can detect when actual sales are diverging from the forecast in real time and prompt you to adjust before a stockout or overstock situation develops.
That said, AI forecasting is only as good as the data behind it. Feeding a machine learning model incomplete, uncleaned historical data will not have a good outcome. The fundamentals in the steps above still apply regardless of which tools you use.
Variables That Can Throw Off Your Forecast
Even a well-built forecast will miss sometimes. These are some of the most common variables that can cause errors in your forecasting:
- Seasonality is the most predictable variable but also the most underestimated. You’ll probably account for obvious peaks like Black Friday and the holiday season, but it’s easy to miss smaller seasonal shifts like the post-holiday return surge or the Q1 slowdown that follows.
- Competitor activity can shift demand without any change in the overall market. A major competitor launching a similar product, running an aggressive promotion, or going out of stock themselves can all move your numbers a lot. This is difficult to forecast, but monitoring your competitors regularly may give you an earlier warning when something changes.
- Supply chain disruptions affect your ability to fulfill demand, which in turn affects how you should interpret your own sales data. If you ran out of stock for two weeks because a shipment was delayed, your sales data for that period will be off.
- Viral demand spikes from social media, press coverage, or influencer mentions can drive short-term sales that have no predictive value for future periods. These events are almost impossible to forecast in advance. The best defense is to treat any unusual sales spike as a potential anomaly until you can identify a repeatable cause.
Forecasting Smarter Starts With the Right Signals
Demand forecasting is fundamentally about reducing uncertainty. You'll never eliminate it entirely, but if you combine clean historical data with forward-looking trend signals consistently, you’ll make better inventory decisions and grow your sales faster.
Start with your historical data as a baseline, build seasonality and lead times into your reorder points, and use Exploding Topics to identify rising trends in your category.
Stop Guessing, Start Growing 🚀
Use real-time topic data to create content that resonates and brings results.

Exploding Topics is owned by Semrush. Our mission is to provide accurate data and expert insights on emerging trends. Unless otherwise noted, this page’s content was written by either an employee or a paid contractor of Semrush Inc.
Share
Newsletter Signup
By clicking “Subscribe” you agree to Semrush Privacy Policy and consent to Semrush using your contact data for newsletter purposes
Written By


Jolissa Skow is a senior content writer and content strategist with a background in SEO, Google Analytics, and WordPress. She's be... Read more